 Part II: PivotTables and PivotCharts
by Stephen L. Nelson, E. C. Nelson
Excel Data Analysis For Dummies, 2nd Edition
Part II: PivotTables and PivotCharts
by Stephen L. Nelson, E. C. Nelson
Excel Data Analysis For Dummies, 2nd Edition
- Introduction
- Introduction
- Part I: Where's the Beef?
- Chapter 1: Introducing Excel Tables
- Chapter 2: Grabbing Data from External Sources
- Chapter 3: Scrub-a-Dub-Dub: Cleaning Data
- Editing Your Imported Workbook
- Cleaning Data with Text Functions
- What’s the big deal, Steve?
- The answer to some of your problems
- The CLEAN function
- The CONCATENATE function
- The EXACT function
- The FIND function
- The FIXED function
- The LEFT function
- The LEN function
- The LOWER function
- The MID function
- The PROPER function
- The REPLACE function
- The REPT function
- The RIGHT function
- The SEARCH function
- The SUBSTITUTE function
- The T function
- The TEXT function
- The TRIM function
- The UPPER function
- The VALUE function
- Converting text function formulas to text
- Using Validation to Keep Data Clean
- Part II: PivotTables and PivotCharts
- Chapter 4: Working with PivotTables
- Chapter 5: Building PivotTable Formulas
- Chapter 6: Working with PivotCharts
- Chapter 7: Customizing PivotCharts
- Part III: Advanced Tools
- Chapter 8: Using the Database Functions
- Chapter 9: Using the Statistics Functions
- Counting Items in a Data Set
- Means, Modes, and Medians
- Finding Values, Ranks, and Percentiles
- MAX: Maximum value
- MAXA: Alternate maximum value
- MIN: Minimum value
- MINA: Alternate minimum value
- LARGE: Finding the kth largest value
- SMALL: Finding the kth smallest value
- RANK: Ranking an array value
- PERCENTRANK: Finding a percentile ranking
- PERCENTILE: Finding a percentile ranking
- FREQUENCY: Frequency of values in a range
- PROB: Probability of values
- Standard Deviations and Variances
- STDEV: Standard deviation of a sample
- STDEVA: Alternate standard deviation of a sample
- STDEVP: Standard deviation of a population
- STDEVPA: Alternate standard deviation of a population
- VAR: Variance of a sample
- VARA: Alternate variance of a sample
- VARP: Variance of a population
- VARPA: Alternate variance of a population
- COVARIANCE.P and COVARIANCE.S: Covariances
- DEVSQ: Sum of the squared deviations
- Normal Distributions
- NORM.DIST: Probability X falls at or below a given value
- NORM.INV: X that gives specified probability
- NORM.S.DIST: Probability variable within z-standard deviations
- NORM.S.INV: z-value equivalent to a probability
- STANDARDIZE: z-value for a specified value
- CONFIDENCE: Confidence interval for a population mean
- KURT: Kurtosis
- SKEW and SKEW.P: Skewness of a distribution
- t-distributions
- f-distributions
- Binomial Distributions
- Chi-Square Distributions
- Regression Analysis
- Correlation
- Some Really Esoteric Probability Distributions
- BETA.DIST: Cumulative beta probability density
- BETA.INV: Inverse cumulative beta probability density
- EXPON.DIST: Exponential probability distribution
- GAMMA.DIST: Gamma distribution probability
- GAMMAINV: X for a given gamma distribution probability
- GAMMALN: Natural logarithm of a gamma distribution
- LOGNORMDIST: Probability of lognormal distribution
- LOGINV: Value associated with lognormal distribution probability
- POISSON: Poisson distribution probabilities
- WEIBULL: Weibull distribution
- ZTEST: Probability of a z-test
- Chapter 10: Descriptive Statistics
- Chapter 11: Inferential Statistics
- Chapter 12: Optimization Modeling with Solver
- Understanding Optimization Modeling
- Setting Up a Solver Worksheet
- Solving an Optimization Modeling Problem
- Reviewing the Solver Reports
- Working with the Solver Options
- Understanding the Solver Error Messages
- Solver has found a solution
- Solver has converged to the current solution
- Solver cannot improve the current solution
- Stop chosen when maximum time limit was reached
- Solver stopped at user’s request
- Stop chosen when maximum iteration limit was reached
- Objective Cell values do not converge
- Solver could not find a feasible solution
- Linearity conditions required by this LP Solver are not satisfied
- The problem is too large for Solver to handle
- Solver encountered an error value in a target or constraint cell
- There is not enough memory available to solve the problem
- Error in model. Please verify that all cells and constraints are valid
- Part IV: The Part of Tens
- Chapter 13: Ten Things You Ought to Know about Statistics
- Descriptive Statistics Are Straightforward
- Averages Aren’t So Simple Sometimes
- Standard Deviations Describe Dispersion
- An Observation Is an Observation
- A Sample Is a Subset of Values
- Inferential Statistics Are Cool but Complicated
- Probability Distribution Functions Aren't Always Confusing
- Parameters Aren't So Complicated
- Skewness and Kurtosis Describe a Probability Distribution’s Shape
- Confidence Intervals Seem Complicated at First, but Are Useful
- Chapter 14: Almost Ten Tips for Presenting Table Results and Analyzing Data
- Chapter 15: Ten Tips for Visually Analyzing and Presenting Data
- Chapter 13: Ten Things You Ought to Know about Statistics
- Appendix: Glossary of Data Analysis and Excel Terms
- About the Authors
- Cheat Sheet
- More Dummies Products
Part II
PivotTables and PivotCharts
 Visit www.dummies.com/extras/exceldataanalysis for more handy PivotTable tools.
In this part …
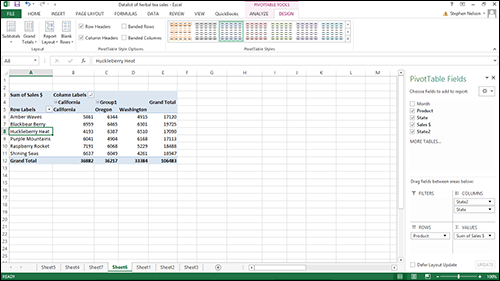
- Use PivotTables to cross-tabulate data and gain new insights into your information.
- Extend the power of Excel’s PivotTables by creating your own customized formulas.
- Display cross-tabulated data in a chart for new perspectives on opportunities and problems.
- Customize PivotCharts to make sure your graphical information communicates the right messages.
-
No Comment
..................Content has been hidden....................
You can't read the all page of ebook, please click here login for view all page.