
CHAPTER 13
Monitoring Cloud Operations
Once you've containerized your applications and configured your orchestrators, clearly you need somewhere to host your workloads. Thanks to a decade and a half of cloud platform maturity, it is now possible to integrate your workloads tightly with dynamic cloud services. Keeping them running and limiting downtime requires effort, and much depends on how securely they are configured. In this chapter, however, we look at the Ops side of the cloud and how to navigate confidently through the challenges involved.
There are a number of reliable open source cloud monitoring tools that can greatly improve the visibility of your cloud estate and improve your cloud security posture management (CSPM) as a result.
Having a large screen in an office with dashboards offering useful and continuous, real-time updates about cloud infrastructure gained popularity as screens became cheaper, but being able to quickly interrogate varying cloud resources using specific criteria through a browser or API can mean that issues are spotted before they cause headaches. And do not forget that a welcome side effect of keeping a close eye on your cloud resources is also significant cost savings. For example, what if a race condition caused endless EC2 instances to be spawned unnecessarily? Or suppose repeated API calls push AWS account limits to their maximum, causing downtime after AWS directly rate-limited API calls in your account.
In this chapter, we will look at two excellent tools that offer varied operational dashboard functionality: Netdata and Komiser. The first deals with nodes, and the second sits at the cloud platform level. Although both offer a lens into different parts of a cloud estate, between them they provide comprehensive coverage and offer an exceptional open source capability that is well worth exploring further.
Host Dashboarding with NetData
Netdata is focused on providing per-host feedback, but it is far from a run-of-the-mill, 1970s-style reporting system when the tools-of-old struggled to create any graphical representation of statistics. According to its website, Netdata (netdata.cloud) is one of the most starred projects on the Cloud Native Computing Foundation (CNCF, www.cncf.io) site, which makes it a hard act to follow. As well as sponsoring the CNCF, Netdata is a member and sponsor of the Linux Foundation. The versatility of the software is worth mentioning, and the developers describe it as suited for all types of deployments including physical, virtual, container, IoT, and edge applications.
The dashboarding is completely reactive, which means that on a touchscreen you can pinch and zoom and rewind logging timelines with ease. Two impressive aspects of Netdata that are immediately obvious are first its ease of installation (which is both painless and efficient and gives you confidence in the maturity and maintenance of the product) and the unquestionably impressive levels of effort that have been put into the product's aesthetics. Those users familiar with Kibana and the like will no doubt have seen some impressive dashboards, but Netdata is quite simply beautifully presented and is hard to beat.
Installing Netdata
Like other tools that we have examined in this book, Netdata can be installed in two different ways, either as a host installation or simply running as a container. As always, the second will be our preference from a Cloud Native perspective.
Host Installation
If you choose to go down the host installation route for Netdata, be prepared for a few different steps to be displayed on your terminal as the installation completes but with little interaction thankfully. The process throws no errors (at least on modern Debian derivatives) and communicates well throughout. You might want to use this form of installation if you are not running containers on specific hosts, for example, and do not want to install a container runtime specifically for Netdata.
We will begin by downloading the installation script, which we will use to install Netdata from source directly onto our machine. We can do just that by running this command:
$ curl https://my-netdata.io/kickstart.sh
If you scrutinize the kickstart.sh script, you can see that a few host directories will be used for files, and in addition a number of packages will be installed. At the least you might expect the following packages to be installed, for example:
autoconf autoconf-archive autogen automake autotools-dev cmakecmake-data libc-dev-bin libc6-dev libelf-dev libjson-c-devlibjsoncpp1 libjudy-dev libjudydebian1 liblz4-dev libmnl-devlibopts25 libopts25-dev librhash0 libssl-dev python3-bsonpython3-pymongo uuid-dev zlib1g-dev
Note that Netdata does expect elevated permissions to run; in this case we will use the root user directly.
For installation use the following command, which will pull in the script that we just downloaded at and then execute it rather than just allowing you to inspect it beforehand. You will need to be running the Bash shell for this, or with another shell you might be able to run chmod +x on the script and alter the way your shell interacts with the script.
$ bash <(curl -Ss https://my-netdata.io/kickstart.sh)
In Figure 13.1 we can see the start of the process spawned by that install script; even the ASCII output is well-presented. As mentioned, the process does not take long to complete, but there are a few interactions along the way. Figure 13.2 shows the end of the installation process as it completes successfully.
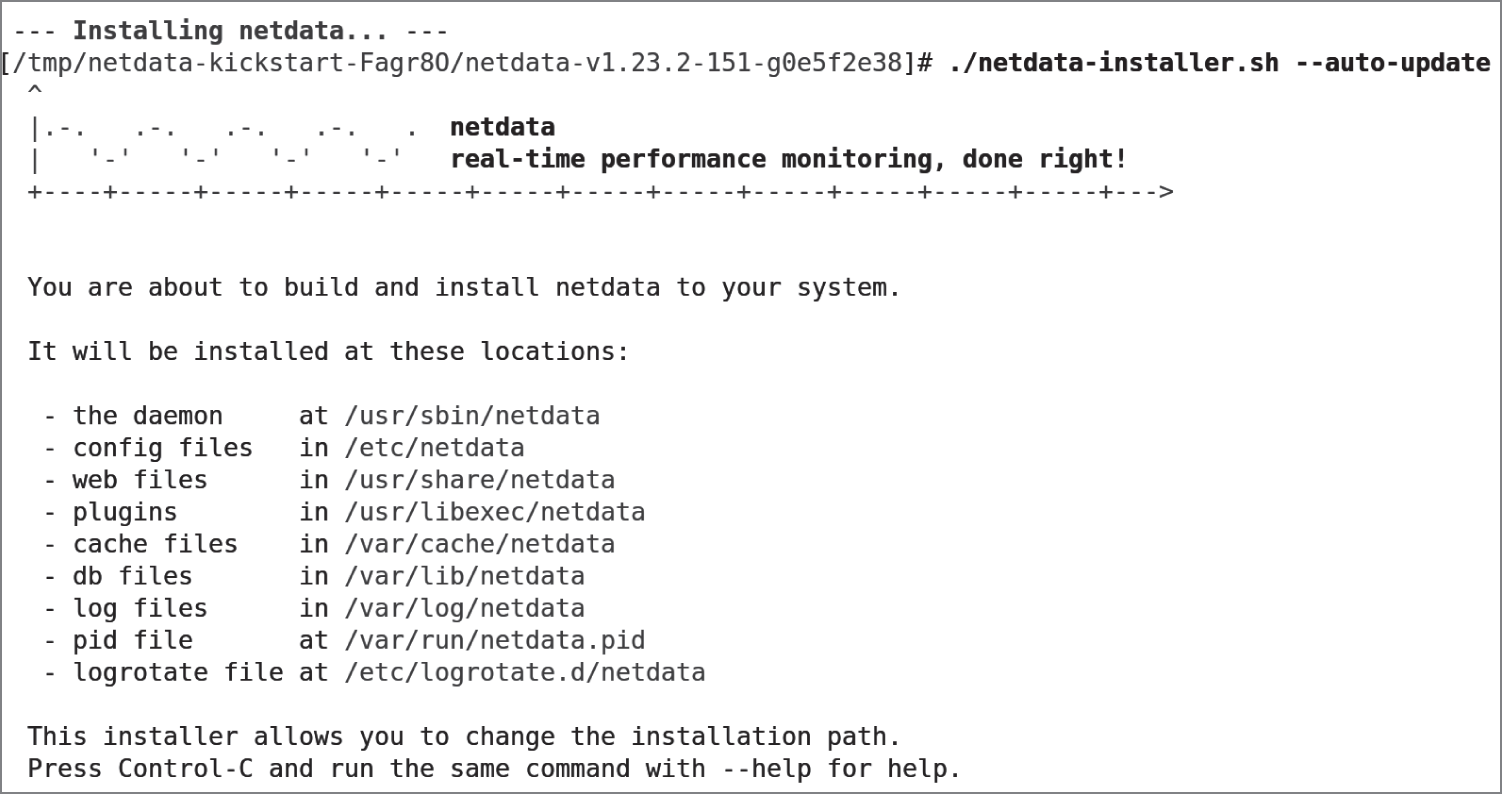
Figure 13.1: The start of the Netdata installation process
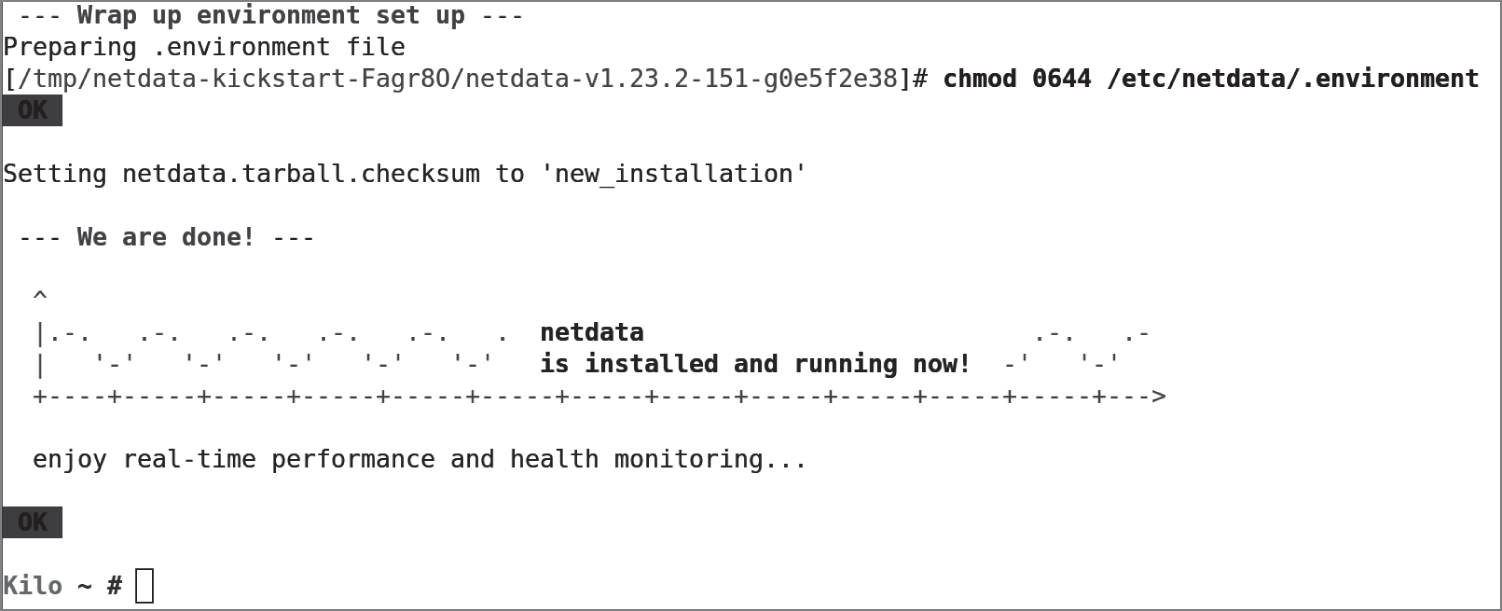
Figure 13.2: Netdata has completed its installation successfully.
The promise of real-time performance and health monitoring here is just the start of the story. If we navigate within a browser to http://localhost:19999, we are presented with Netdata's crystal-clear user interface. In Figure 13.3 we can see the top of the long, scrollable, and detailed dashboard.
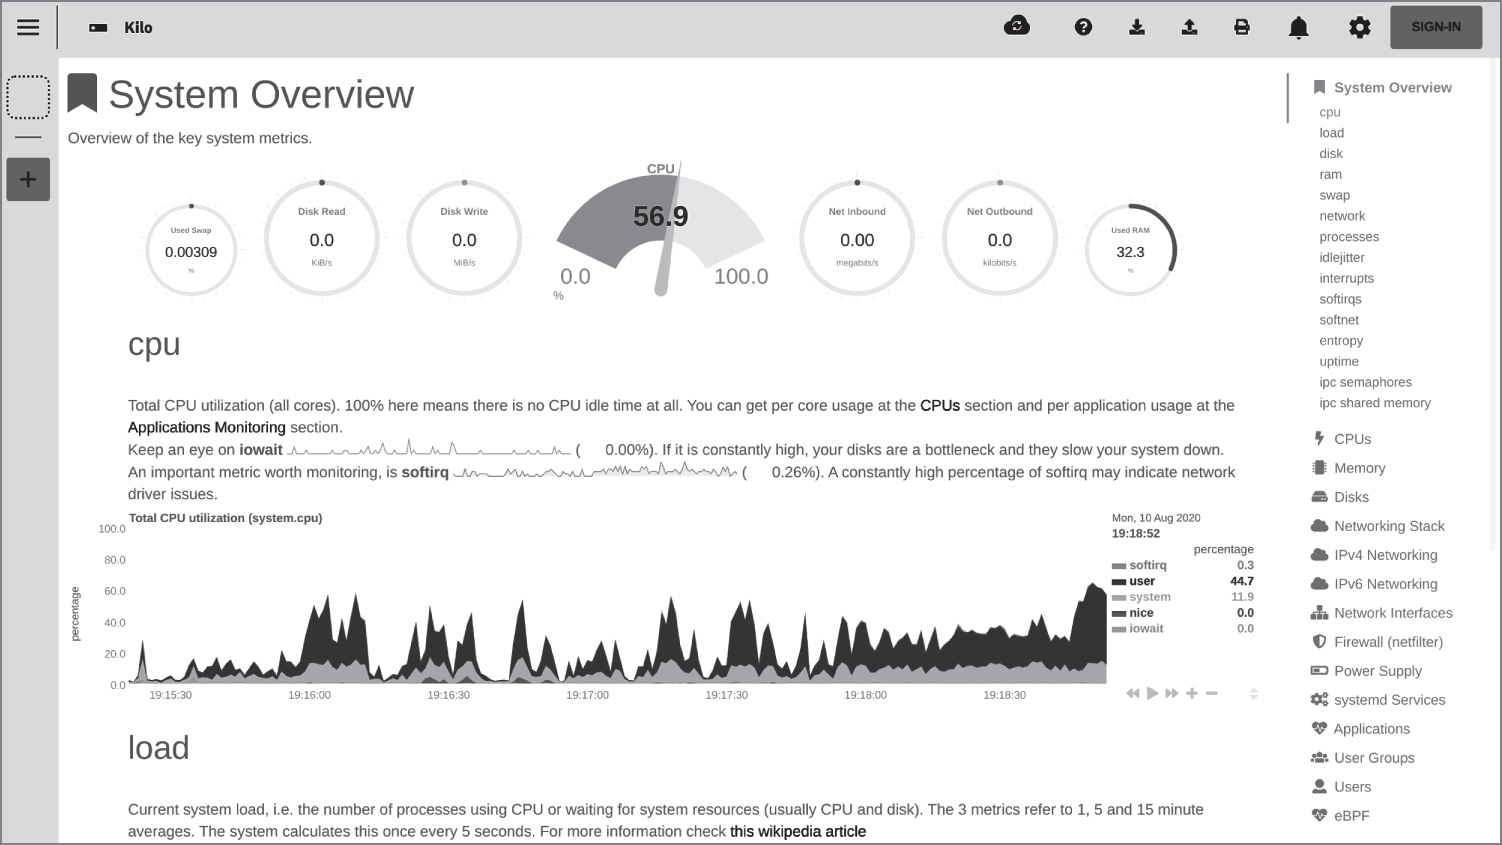
Figure 13.3: The top of the dashboard
Here we are presented with real-time updates of the present state of our system. On the right side of the screen, the navigation panel offers around 30 options, covering every aspect you can think of on your system. And they do not simply create a snapshot of what is happening right now but instead offer a scrollable, historical view that provides visibility of all things salient to your running host, whether that host is a local laptop or a remote cloud server.
Container Installation
We will look at more of the dashboard content in a moment, but first we need to install Netdata via a container installation, without adding any extra packages to our host at all.
The command, as shown in Listing 13.1, is relatively lengthy but easy to cut and paste into a script for later use if you prefer.
As you can see in Listing 13.1, this code offers the container the SYS_PTRACE kernel capability, which allows the container to make changes to other processes in the host's process table. Additionally, on Ubuntu in particular, and other derivatives, we are relinquishing the protections afforded to the system by AppArmor for this container. Make sure you are willing to run a container under these conditions with these permissions on all of your hosts before proceeding.
Also, in Listing 13.1 you can see the ability to quickly alter which network port is visible; this capability is a useful addition when multiple network interfaces are in use.
The resulting output from the long command in Listing 13.1 simply shows a container starting up with its own hash ID. There are extremely detailed instructions for getting the most out of your containerized version of Netdata available on the GitHub site (github.com/netdata/netdata/blob/master/packaging/docker/README.md), which is definitely well worth a read. Key points include recommendations to use Docker Compose, give Netdata containers a specific name, inspect specific storage volumes, and integrate with the Travis CI/CD tool.
In Figure 13.4 we can see other features and the utilization percentages of our network interfaces.
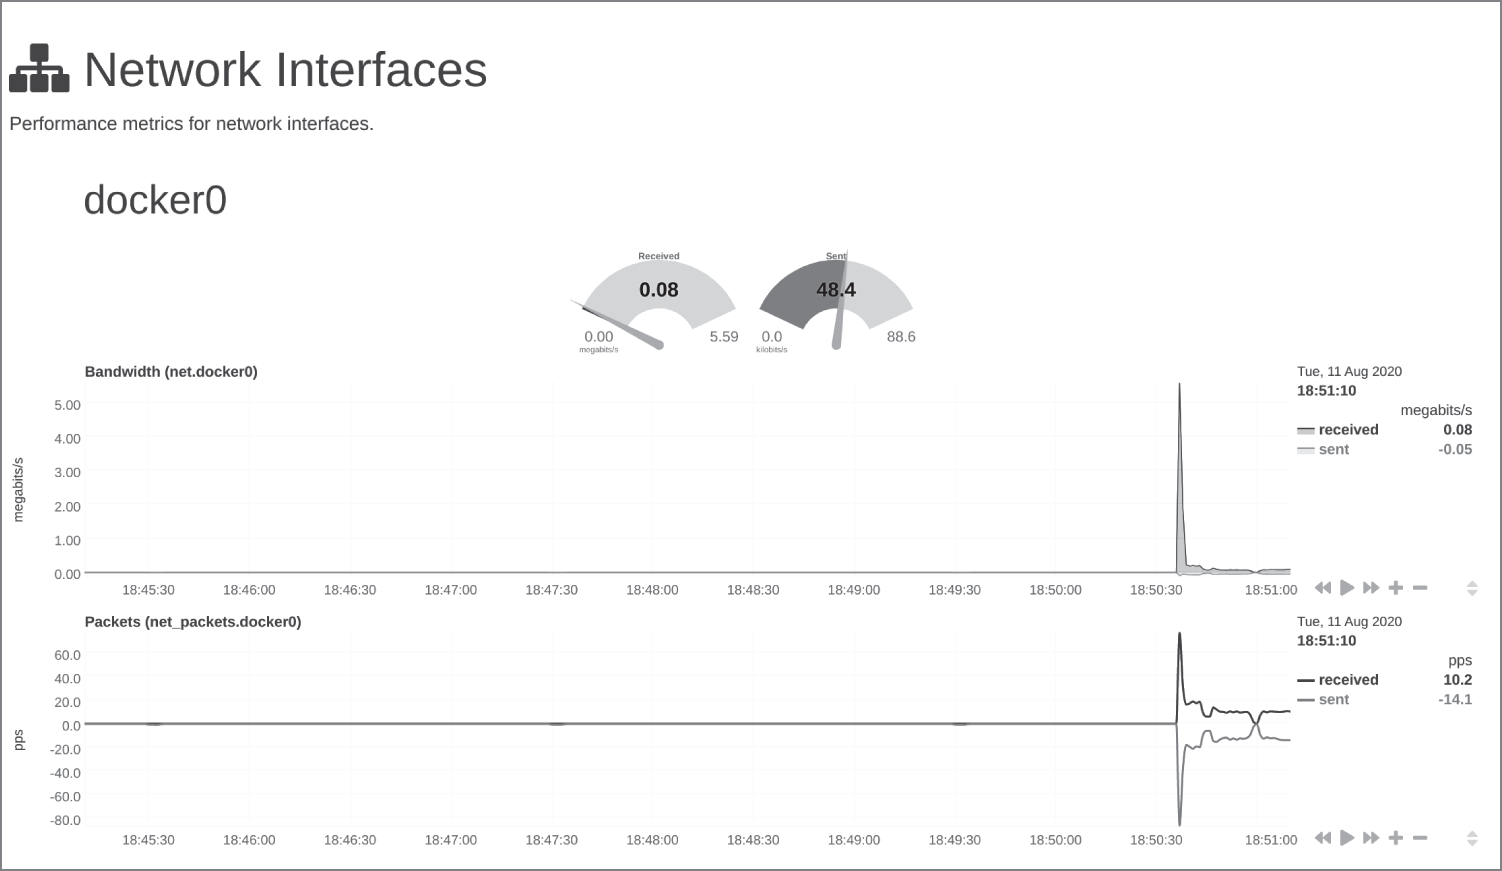
Figure 13.4: Networking information showing the docker0 network interface
Here we are able to monitor traffic closely across any of our network interfaces, historic and current; this can show us spikes in traffic for DDoS attacks, potential trends for future use (think about applications that are being used once a year and nearing resource capacity), and the like. The view that we can see is just after starting up the container that is running Netdata itself. Having clicked cpuidle on the right then, in Figure 13.5, we are able to see when energy-saving kicks in and a CPU core is sitting idle.
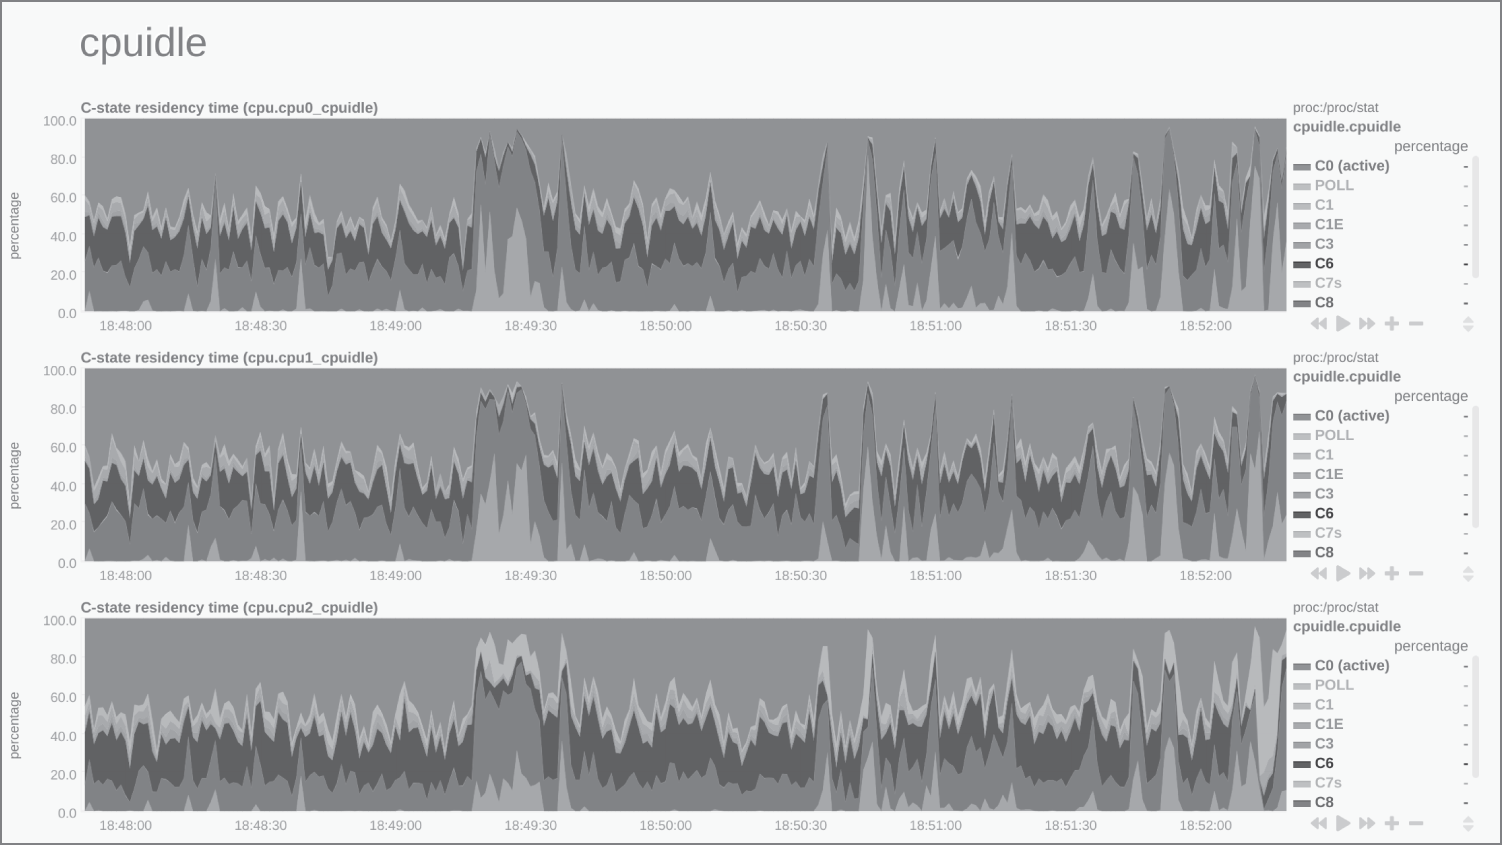
Figure 13.5: The cpuidle dashboard to show how quiet your CPU cores are
Figure 13.6 presents sample output from the sensor readings that provide temperature telemetry.
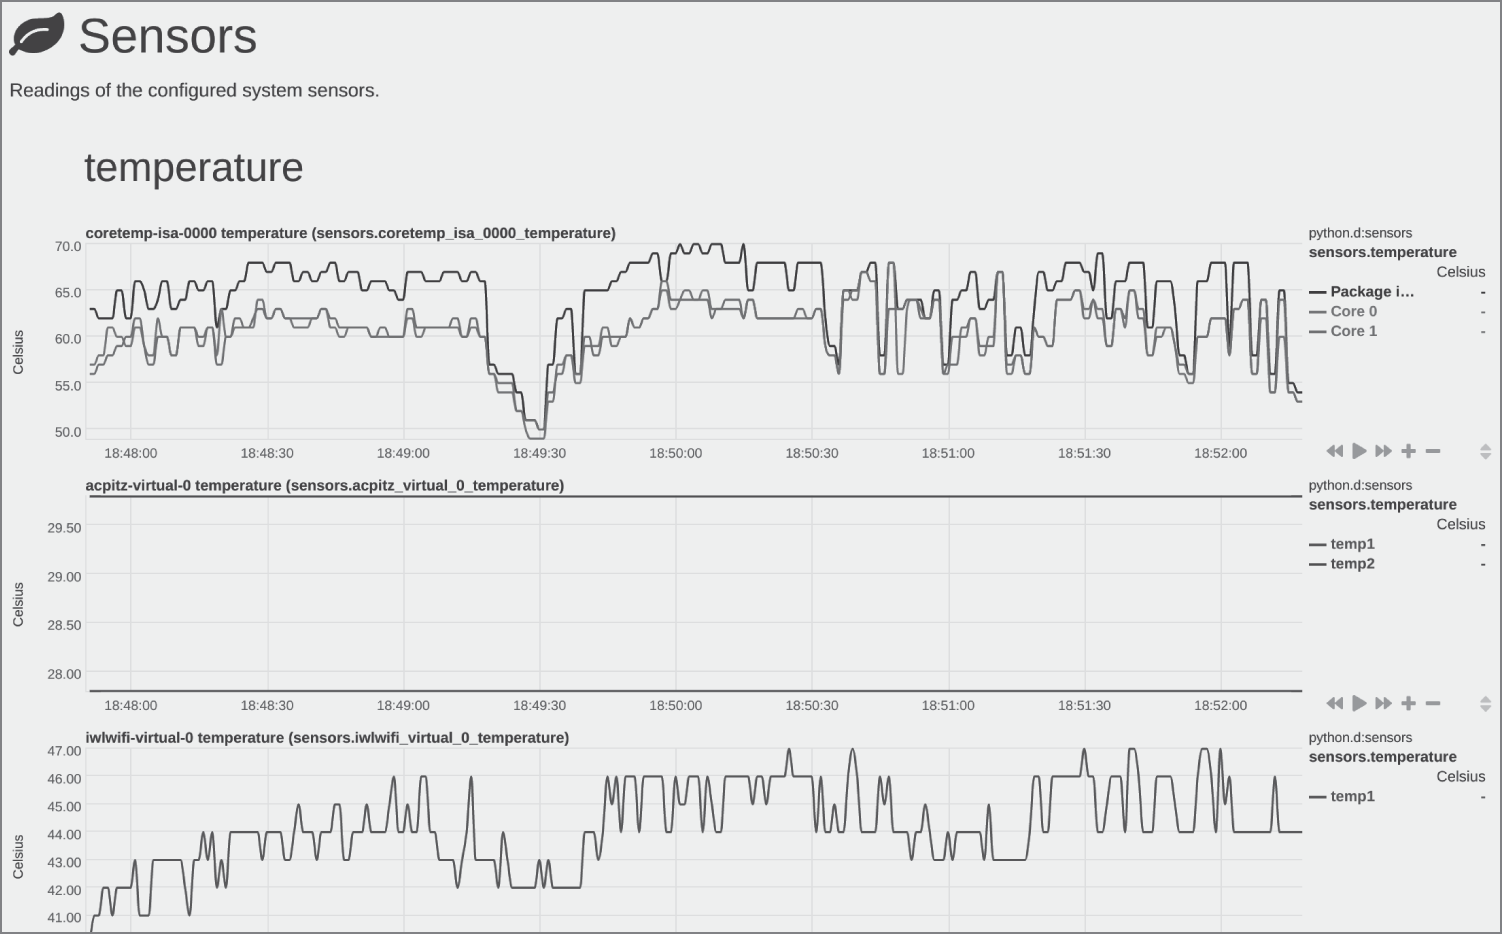
Figure 13.6: Temperature metrics can be useful for on-premises hosts that have data center heat cooling issues.
On this screen are some useful temperature statistics for hardware components. A reminder again that if the dashboard is viewed on touchscreen devices, the ability to inspect a particular set of graphs makes it far easier to pinpoint, and then pinch, a certain timeline or to change the displayed measure of statistics.
We have looked at only a handful of the criteria that Netdata monitors. There are apparently thousands of metrics available, and standard Netdata is equipped with insightful alarms when health checks do not pass tests as expected. This section of the documentation offers insight into what is possible with Netdata: learn.netdata.cloud/docs/collect/how-collectors-work. The left navigation menu under Collect lists the types of metrics.
Coupled with the fact that there is no registration required to use Netdata and that commercial-grade software is available as open source software, there is little reason not to try deploying Netdata on your hosts. Just be certain that you are aware of any security considerations and that you pay attention to accidentally exposing the dashboard's network port to unwanted visitors.
To centralize your many hosts, again without a fee, Netdata comes with an additional service called Netdata Cloud (app.netdata.cloud). This service allows you to register your Netdata host agents so that you can then manage all of your nodes from one central place.
Surprisingly, there are no limits on the number of nodes, the number of metrics captured, or individual team members, and you can even log in with your GitHub or Google account for ease.
Finally, there are also a number of tweaks you can make to the running configuration of the service. For example, you might adjust whether automatic updates are installed and if you are running the latest or the most stable software releases.
It is highly recommended that you look at the excellent documentation to get you started. There is a well-written step-by-step guide, which can be found here: learn.netdata.cloud/guides/step-by-step/step-00.
Collectors
Netdata calls its data ingest points collectors, and now that you've seen how the software operates, you probably would not be surprised to learn that it can ingest data from all sorts of services. According to the docs these include nginx, Apache, MySQL, statsd, cgroups (from containers, Docker, Kubernetes, LXC, and so on), Traefik, and web server access.log files. From a Cloud Native perspective, the Kubernetes collector is extremely welcome to automate multiple containers in a cluster being monitored (learn.netdata.cloud/docs/agent/collectors/collectors#kubernetes). Visiting that page offers the welcome knowledge that the Kubernetes collector allows kubelet monitoring, kube-proxy monitoring, and additionally service discovery monitoring.
Uninstalling Host Packages
Incidentally, if you want to uninstall the host package installation of Netdata, there are instructions on this page: learn.netdata.cloud/docs/agent/packaging/installer/uninstall. As discussed earlier, the installation uses a number of host directories, so cleanly uninstalling packages is a sensible approach.
Cloud Platform Interrogation with Komiser
As mentioned in the introduction to this chapter, to maintain a robust cloud security posture on modern server estates, it is really important to have exceptional levels of visibility on your resources.
Another sophisticated tool that is designed to assist with that requirement is called Komiser (github.com/mlabouardy/komiser). It offers some welcome functionality to assist with improving the cost analysis and hardening of your Amazon Web Services accounts. The tool will run through a number of your AWS services to offer the security insight that is required on a per-region basis. Our discussion of Komiser will assume that you have an AWS account available to you (and that you have run the aws configure command to set up your credentials; see docs.aws.amazon.com/cli/latest/userguide/install-cliv2.html if you do not know how).
Let's look at installing it now. The process is incredibly simple, but we will need AWS credentials (access and secret keys) copied into the environment variables to help populate a container's environment. To interact with the authentication role-based access control (RBAC) components of AWS, we will use an Identity and Access Management (IAM) policy as provided by raw.githubusercontent.com/mlabouardy/komiser/master/policy.json. You will need to create as a custom policy that is not designed to give excessive permissions to change resources but instead just read, list, and describe AWS services. If you are new to IAM users, roles, and policies, then you can find the official AWS documentation at docs.aws.amazon.com/IAM/latest/UserGuide/access.html.
Once you have attached that policy to your user or role, you do not even need to clone a repository to run Komiser. Just run this Docker command in a script or as one line if it fails to run (displayed with the credentials redacted):
$ docker run -d -p 3000:3000 -e "AWS_ACCESS_KEY_ID=AKXXXXXXXXXXGN4"-e AWS_SECRET_ACCESS_KEY="GLXXXXXXXXXXXXXXXXKY"-e AWS_DEFAULT_REGION="eu-west-1"--name komiser mlabouardy/komiser:2.4.0
To confirm that the container spawned as we hoped, use this heavily redacted ps command:
$ docker psIMAGE COMMAND PORTSmlabouardy/komiser:2.4.0 "komiser start" 0.0.0.0:3000->3000/tcp
That looks great, as if it spun up as hoped, using TCP port 3000. We can now use our browser to navigate to that on our localhost:
http://localhost:3000
The test AWS account is not giving too much information away on the splash screen, but the dashboard is well-designed and intuitive, as we can see in Figure 13.7.
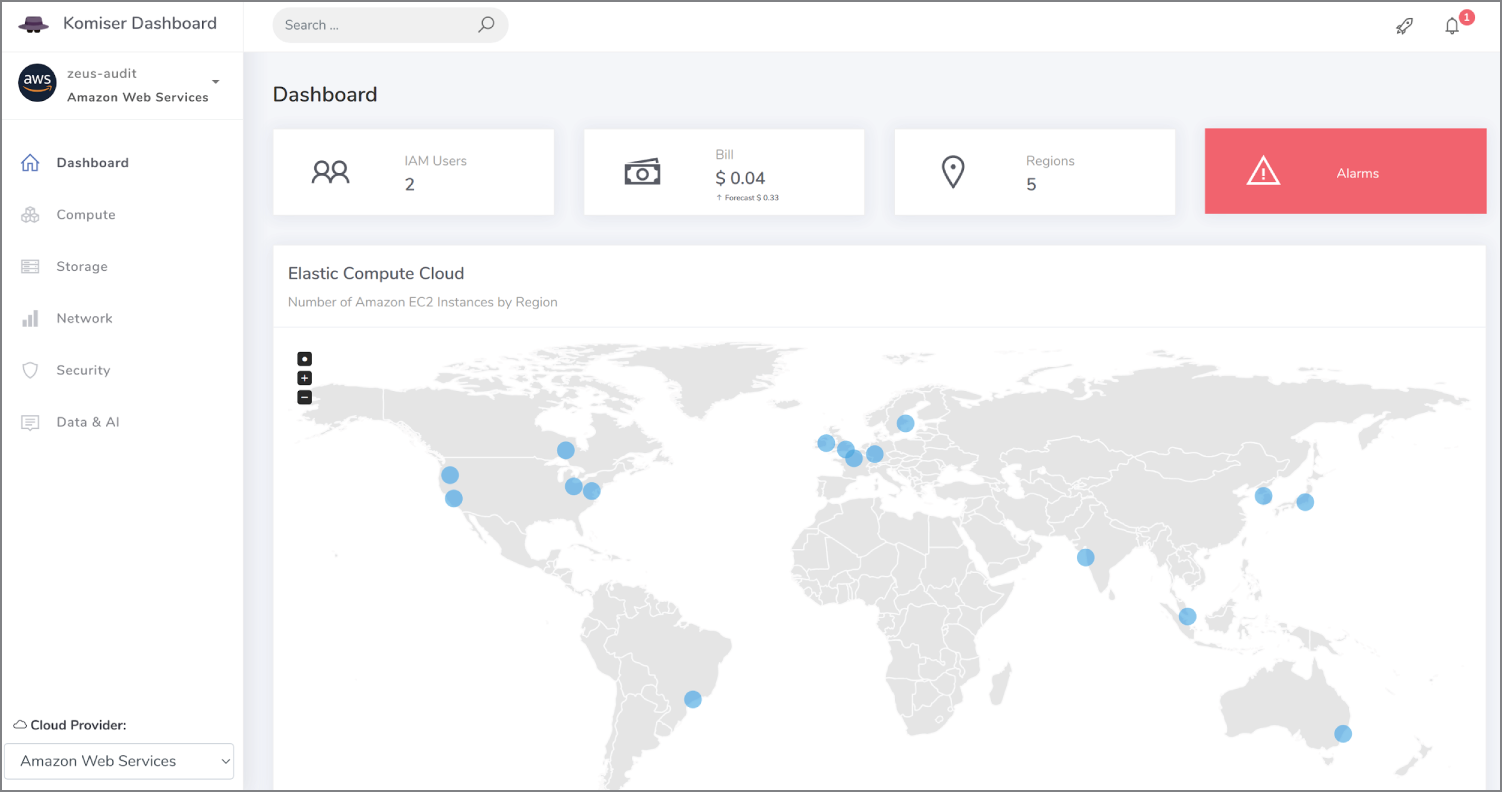
Figure 13.7: The splash screen for Komiser made available by our container
In Figure 13.7 we can see that there are two IAM users in our default region and a minuscule AWS bill of a few US cents due, forecasted to rise because it is the beginning of the billing period. We can see that there are five regions listed as areas of interest, and in the map, we can see the AWS regions that have been discovered. If we hover over them, we immediately see how many EC2 instances are live and running.
In Figure 13.8, we can see a summary of our support tickets for this region, having scrolled down on the splash screen and our tiny billing forecast. The instant snapshot of per-service billing costs is a welcome addition.

Figure 13.8: A billing summary per-service plus outstanding support tickets
Hidden away at the top right of the screen is a rocket-shaped icon to list any service limit checks, a feature that could be useful if you are nearing API call limits or EC2 instance limits due to stress events, such as an attack or a runaway race condition due to a misconfiguration.
If you have ever worked with hundreds of EC2 instances, you will know how important it is to be able to quickly check how many are running and how many have been terminated recently. In Figure 13.9 we can see that the considerate Komiser offers this information in a timely fashion.
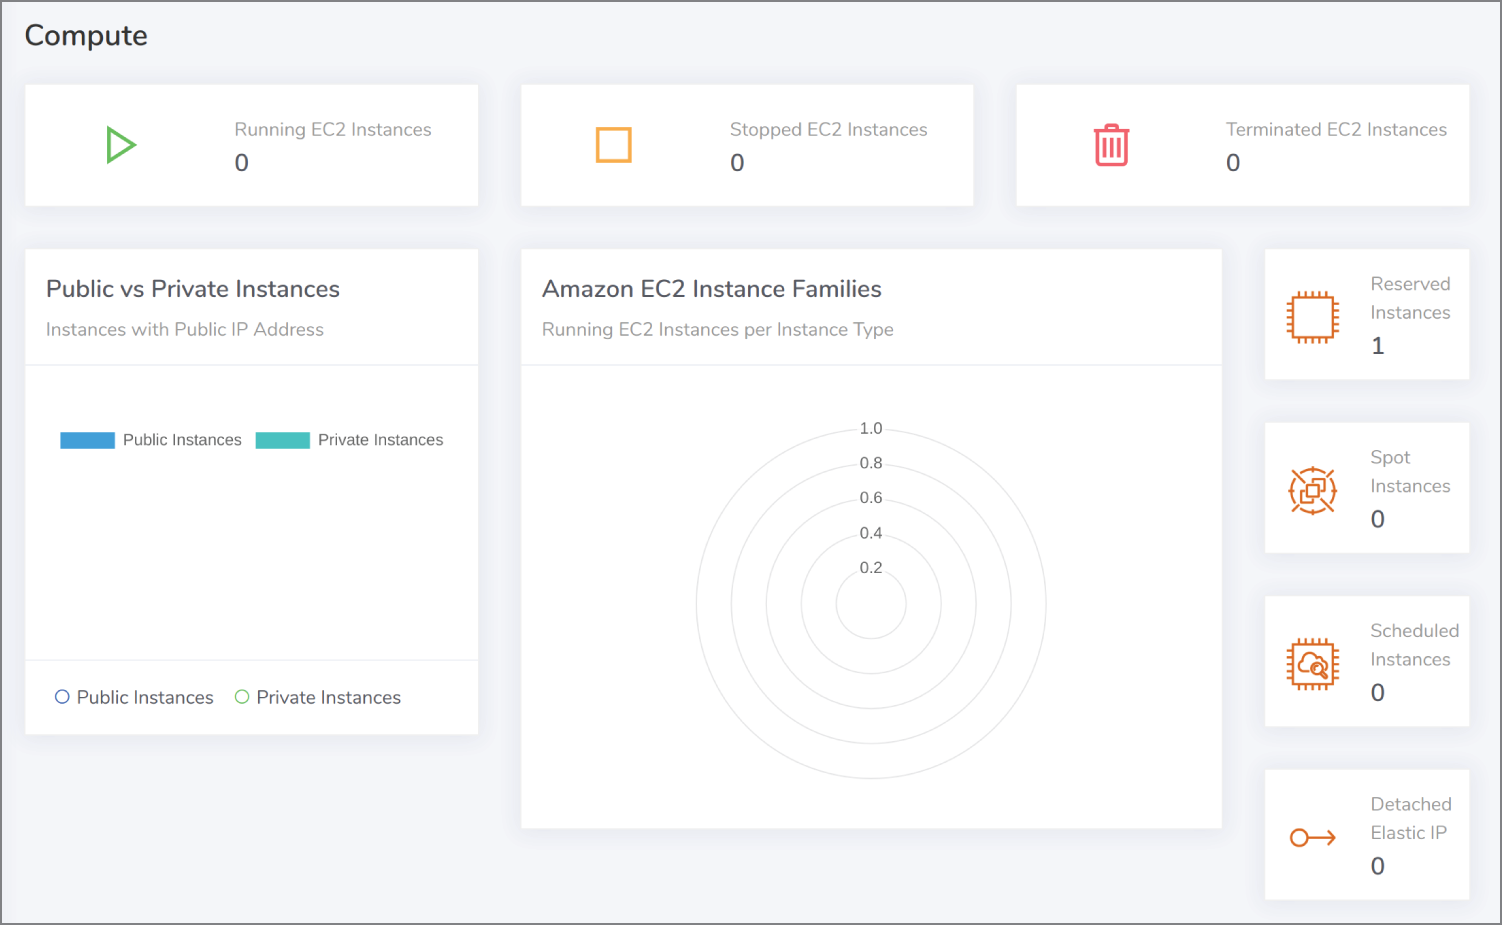
Figure 13.9: Checking running instances is useful not just for costs but stress events too.
Another valuable addition relates to Serverless functions in AWS. Komiser presents a must-have, critically important view of any Lambda function execution errors. If your functions are running security tasks and they fail to run, or equally fail to complete their execution without errors, then this is an extremely important metric to pay attention to for obvious reasons. We can see this metric in Figure 13.10.
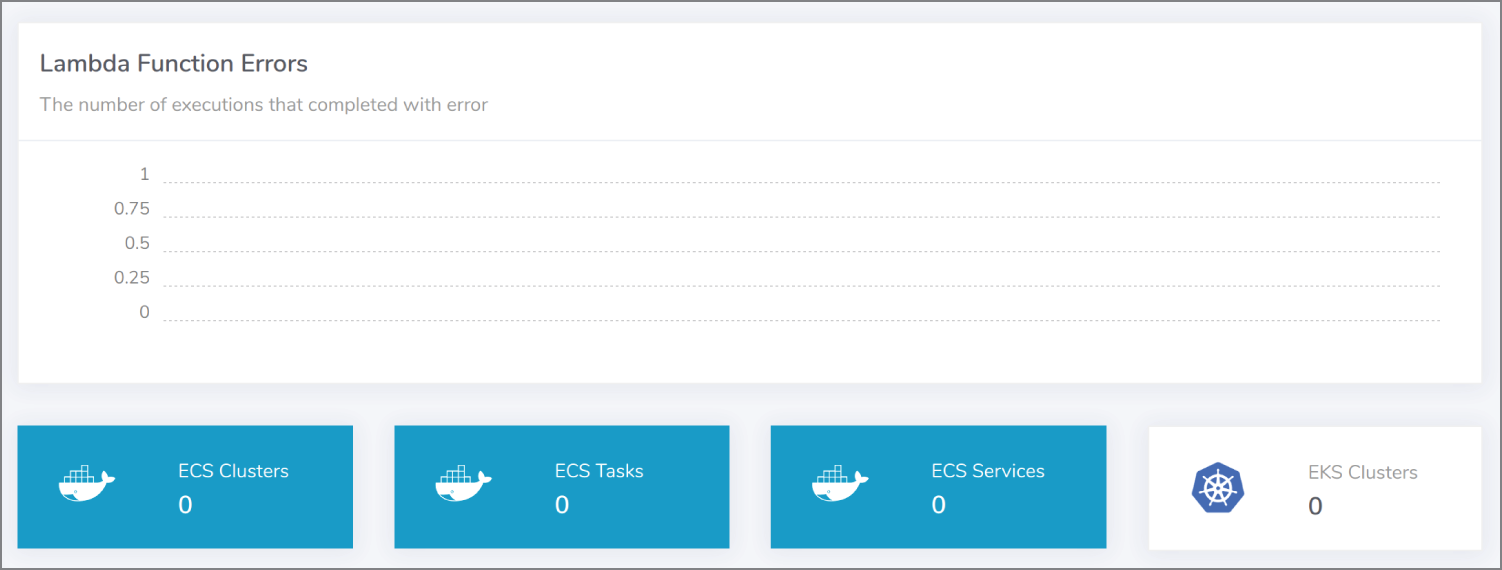
Figure 13.10: Lambda functions aren't forgotten about in Komiser.
Additionally, there is a section regarding AWS S3 and a useful aggregator of the size of all combined S3 buckets and their total number, which will of course affect your billing.
Moving onto the Network tab in the dashboard, the sophisticated Komiser also offers a detailed insight into elastic load balancers, NAT Gateway traffic, API Gateway requests, and inbound CloudFront CDN requests. There is additionally a nice summary of current networking resources in use, as shown in Figure 13.11.
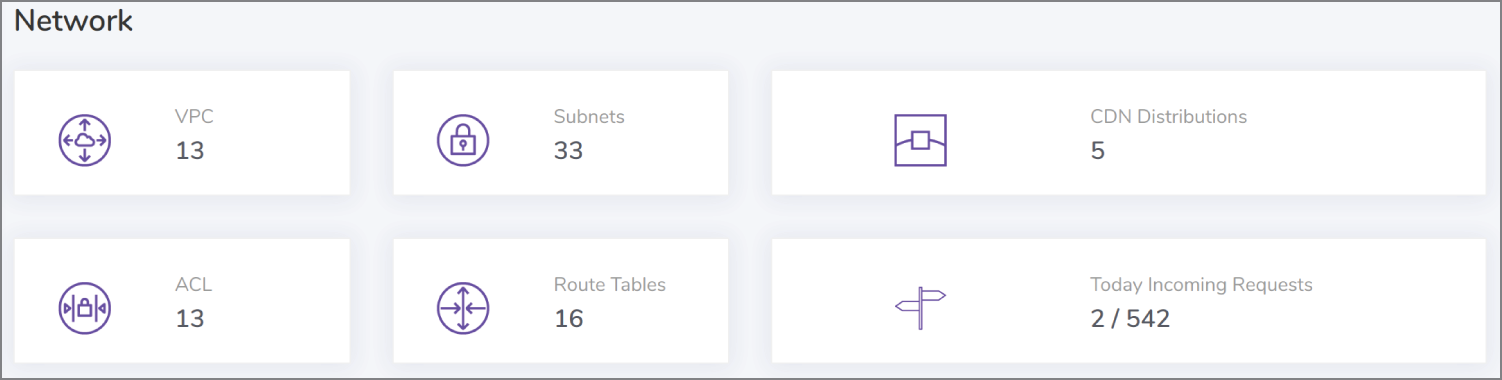
Figure 13.11: Potentially costly utilized network resource in an AWS region
On the Security tab, in the navigation on the dashboard, there is also a succinct summary of the security services that you might want to pay attention to. Among others that are shown, there are recent sign-in events in graph form, how many KMS keys from the Key Management Service are in use, the number of keypairs, and a count of the number of security groups in use. You can see a live login map of where current users are logged in from currently on a global map, and additionally you can see a list of unrestricted security groups in the region, plus the top IP addresses accessing the AWS API currently, which is a nice touch.
The final section of the dashboard offers a large number of metrics on data and AI. Within that section, you will find SQS, SNS, Active MQ, and Kinesis streams, to name but a few.
And, if all the features that we have looked at are not comprehensive enough, then you are also able to move freely between different cloud platforms to monitor your resources within them too, namely, Google Cloud, Digital Ocean, and OVH.
Installation Options
If for some reason you did not want to run Komiser via a container, there is versatility in the form of package downloads for multiple operating systems.
For Linux you can use this command to download the package:
$ wget https://cli.komiser.io/2.4.0/linux/komiser$ chmod +x komiser
Also available are packages for Windows and macOS X in addition.
If you take this installation route, then you will still be required to provide authenticated access to the AWS platform. If you need assistance, then refer to the IAM instructions earlier in the chapter to create a user or role with this IAM policy: komiser.s3.amazonaws.com/policy.json.
Once it is installed, you can just run this command to start the service up for Komiser:
$ ./komiser start --port 3000
Finally, if you want to do so, then it is possible to also use Redis as a caching server as follows (this is apparently only for preexisting Redis installations on the system, so install it first):
$ ./komiser start --port 3000 --redis localhost:6379 --duration 30
Listing 13.2 shows the startup options available for Komiser to complement the previous command.
Summary
In this chapter, we looked at two exceptional monitoring tools. Even a daily check of issues from such tools can greatly improve your chances against unwelcome attacks or misconfigurations and tangible cost issues that affect your cloud estate.
First we saw Netdata in action that provided a centralized location to monitor the health of all your cloud and on-premises hosts. The clarity provided by its dashboards is a sight to behold. And, running Netdata as a container is a painless exercise. You would be wise to change the configuration to your needs and ensure that your security requirements are satisfied when deploying it to multiple hosts.
Next we looked at real-time checks against resources in AWS that are currently in use, with a dashboarding system called Komiser. Although both tools provide quite different perspectives, both play a critical role in how you approach cloud security posture management and the health of your cloud estate. You are encouraged to look at the paid-for enterprise edition for further features if you make extensive use of Komiser via its website: www.komiser.io. There is some well-written and nicely formatted documentation available for Komiser on the docs site: docs.komiser.io. Adopting the paid-for version means that you will be able to declare credentials in different ways among other benefits. And, with the right version, you can output alerts to Slack so that critical issues are not missed. There is also an online service which is still in private beta at cloud.komiser.io, which is worth keeping an eye on and signing up for when it goes live.