
CHAPTER 15
Cloud Auditing
Certain open source security tools focus specifically on one particular area, and others are more diverse. It is perfectly possible to audit multiple infrastructure components, whilst checking against a variety of detailed benchmarks, for no charge under the right licensing conditions.
As we saw in previous chapters, one set of criteria that is often used to audit systems and cloud platforms is from CIS Benchmarks (https://www.cisecurity.org/cis-benchmarks), where industry consensus offers a great deal of insight into how you might harden your infrastructure better.
In this chapter, we will look at three tools to assist with auditing: Lunar, Cloud Reports, and Prowler. Two of these tools focus on meeting rule definitions from CIS Benchmarks directly. We will begin with a sophisticated and diverse tool that is primed to cover multiple areas at once. These are some of the key areas that we have covered previously, so combining their coverage within one tool is a welcome proposition: container runtime security, hosts, and cloud platforms.
Runtime, Host, and Cloud Testing with Lunar
The first tool that we will look at is called Lunar (https://github.com/lateralblast/lunar). Although the tool is sophisticated enough to output Ansible code, to automatically assist with using its test results as Ansible playbooks, it has been created using shell scripts. The author unashamedly declares that coding is not necessarily his forte, and for compatibility with air-gapped systems, using shell scripts was the most logical approach. As we saw in Chapter 11, “Automated Host Security,” Ansible has a relatively shallow learning curve and can provide sophisticated, automated configuration management.
You might be pleasantly surprised at how easy it is to get started with Lunar. There are just a couple of commands to run. Before we do that, though, let's look at some of its features.
Although we mentioned the CIS Benchmarks earlier, Lunar also pulls in its knowledge from other frameworks. However, when CIS Benchmarks is used, the author provides references within the codebase to help out as much as possible.
Unusually, it seems that Lunar can also make changes to a running system, but you are encouraged to avoid that unless you know exactly what is being changed. You have been warned! Instead, it is more sensible to use the auditing functionality and learn from the tool's findings. There is apparently a “backout” option for rewinding any changes that you make, but experienced admins will take heed from what the developer recommends for good reason. Downtime is never welcome, planned or otherwise. If you accidentally find yourself making changes, apparently pressing Ctrl+C will stop Lunar dead in its tracks. Reverting any changes already made might not be very easy, however.
With that caution in mind, we can look at the features that Lunar offers. Table 15.1 offers an insight into how diverse the tool is.
Table 15.1: The Many Areas of Coverage That Lunar Offers
| PLATFORM/ SYSTEM/APPLICATION |
AUDITING CAPABILITY |
|---|---|
| Docker | Detailed auditing across multiple criteria |
| AWS | In-depth multiservice auditing |
| Apache | Incomplete audits (work in progress) |
| Kubernetes | Incomplete audits (work in progress) |
| Operating systems | RHEL/CentOS 5, 6, 7; Scientific Linux; SLES 10, 11, 12; Debian; Ubuntu; Amazon Linux; Solaris 6, 7, 8, 9, 10, 11; macOS audits |
| Operating systems (work in progress) |
FreeBSD, AIX, ESXi |
As we can see, there is no doubt that Lunar boasts an exceptional range of coverage. Let's get it up and running.
Installing to a Bash Default Shell
We will use a Linux Mint laptop (based on Ubuntu 18.04) for the Lunar installation. As standard, Ubuntu has moved its default shell away from the venerable Bash to Dash to speed up boot times and lighten the load because Bash is brimming with features and a little more cumbersome. This means that when /bin/sh is called, /bin/dash is actually run instead of /bin/bash. It appears this does not play nicely with Lunar, so a simple fix is needed, as described in the following series of commands. Note that this may not apply to your system, so be careful, or potentially much of Lunar's functionality may not work on your machine if there is no default shell alteration. Reverse these changes after trying them if you do not want Bash as your default shell.
First, you can check that /bin/sh is just a symlink to Dash with this command:
$ ls -al /bin/shlrwxrwxrwx 1 root root 9 Aug 8 18:49 /bin/sh -> /bin/dash
As we can see, /bin/sh is just a symlink to /bin/dash.
We will temporarily delete the symlink from Dash to /bin/sh with this command:
$ rm /bin/sh
Next, we will re-create the symlink to point at Bash with this command:
$ ln -s /bin/bash /bin/sh
You could also globally change all references from /bin/sh to /bin/bash in the Lunar scripts if that seems less impactful.
Execution
We are all set to clone the Lunar GitHub repository and run Lunar next:
$ git clone https://github.com/lateralblast/lunar.git
Enter the lunar directory with the cd command, and in Listing 15.1 we can run the main shell script to generate the help output.
Here we can see lockdown options to make changes to systems; to preserve sanity, we will avoid those so that we do not make changes to the system. Instead, we will begin with a look at auditing operating systems, which is Linux in this case.
If we choose the lowercase -a switch for the script, it will not run all the exhaustive filesystem checks, whereas the -A switch would instead provide this functionality. Let's try that now with this command:
$ ./lunar.sh -a
The output of the command is extensive to say the least and completes with this summary:
Tests: 470Passes: 191Warnings: 279
Listing 15.2 shows a sample of the OS auditing output.
Here we see just the upper lines of the output generated. Other areas of the checks include PAM, squid, filesystem permission, NFS, apache2, SMB, tunable kernel parameters, syslog, system accounts, and password complexity policies, to name but a few. If you have worked with the CIS Benchmarks before, you will spot a number of familiar items that need to be hardened.
Let's look at the container runtime audits next. Running this type of audit is as simple as changing the command to use the following switch (Docker needs to be installed for this set of tests):
$ ./lunar.sh -d
Again, the output is impressive and completes without much of a wait. Some of the areas of coverage include the following:
- Checking for Linux kernel capabilities for running containers (including more privileged capabilities, such as
CAP_SYS_ADMIN,CAP_NET_ADMIN,CAP_SYS_MODULE, and the like) - Whether health checks configuration is present for containers
- Which logging level the Docker Engine is using
- Whether host-based networking is enabled
- Whether
auditdis picking up the actions of the container runtime - Whether the root filesystem is read-only
Again, CIS Benchmarks are put to good use here. If you search within the cloned repository directory locally by using the next command, you will see a number of references to CIS:
$ grep -R CIS *
This command produces lengthy output, including the following:
modules/audit_docker_security.sh:# Refer to Section(s) 5.4Page(s) 132 CIS Docker Benchmark 1.13.0modules/audit_docker_security.sh:# Refer to Section(s) 5.9Page(s) 141 CIS Docker Benchmark 1.13.0modules/audit_docker_security.sh:# Refer to Section(s) 5.12Page(s) 146–7 CIS Docker Benchmark 1.13.0modules/audit_docker_security.sh:# Refer to Section(s) 5.15Page(s) 152–3 CIS Docker Benchmark 1.13.0modules/audit_docker_security.sh:# Refer to Section(s) 5.16Page(s) 154–5 CIS Docker Benchmark 1.13.0
This output is exceptionally useful because it translates into remediating issues much more easily. Visit the CIS website and download the benchmarks directly (https://cisecurity.org/benchmark/docker) to gain more insight into any discovered issues and find remediation tips there too. In Listing 15.3, we can see some sample output from running the excellent Lunar against our container runtime.
The tool is comprehensive and does not fail to deliver from a runtime perspective either, with a significant number of checks summarized on the author's device as follows:
Tests: 1722Passes: 1106Warnings: 616
Cloud Auditing Against Benchmarks
To test against AWS, we need sufficient permissions attached to a role or user via a policy. Lunar offers some advice but does not provide a policy verbatim about exactly which permissions you will need to permit. You will need the AWS CLI tool installed locally. If you are not sure how to get this, the documentation can be found at https://docs.aws.amazon.com/cli/latest/userguide/install-cliv2.html. You may have had it installed to set up your credentials (with the aws configure command) previously.
Also, you need to fine-tune some rules, but Figure 15.1 shows a reasonable start.
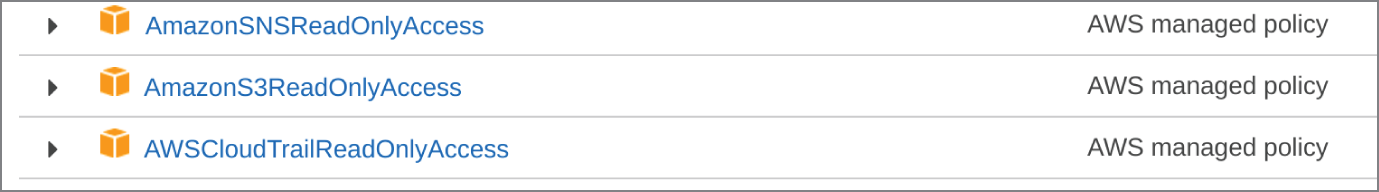
Figure 15.1: Some of the permissions that your user/role will need in AWS, but not all
In Figure 15.1 we can see some read-only permissions. If you have not supplied the correct permissions, then certain checks will result in a permission-denied error of sorts.
There are two AWS modes to run Lunar in: recommendations mode and auditing mode. We will start with this “recommended” tests scan as follows:
$ ./lunar.sh -x
The output begins as follows:
Running: In audit mode (no changes will be made to system)Auditing: AWS—Recommended Tests# SYSTEM INFORMATION:Virtual: LENOVOProcessor: x86_64Machine: x86_64Vendor: LinuxMintName: LinuxVersion: 19Update: 19Checking: EC2 Recommendations
We are then offered a number of useful suggestions such as tagging our security groups with recognizable names and pruning older EC2 snapshots. The checks include coverage of RDS, CloudWatch, RedShift, ElastiCache, Inspector, VPCs, security groups, DynamoDB, ELBs, and EC2. In Listing 15.4 we can see a sample of the output.
Next, let's run “audit” mode over an AWS account and see the difference in output. We can do this using the following command:
$ ./lunar.sh -w
This time, the output is much more familiar and relates to CIS Benchmarks. Note that, at the time of writing, there seems to be a bug within the lunar.sh script with reference to the -w switch in the latest release. Once that bug is resolved, the sample output should again be as shown in Listing 15.5. There appears to be an issue with functions being disordered within the script.
Because of the vast number of checks run in audit mode this time, the tool takes longer. If you want to select specific functions in AWS to check, use the -W switch to retrieve a list of available functions that you can choose from first. Once you've done so, you can then run Lunar using the -s switch to run in selective mode. Refer to Figure 15.1 to see the switches required for the other areas of coverage that the broad-reaching Lunar provides.
AWS Auditing with Cloud Reports
Now that we have looked at the uber-diverse Lunar, let's focus on a tool that deals only with AWS. Although this next tool is not focused on comparing its results with CIS Benchmarks, it is a valuable exercise to gain an understanding of the different output that varying tools provide.
There is a clever piece of software called Cloud Reports (https://github.com/tensult/cloud-reports) that will return shiny PDFs and HTML reports relating to your security posture. On its GitHub page there is a list of currently audited AWS services, according the AWS Well-Architected Framework best practices (https://aws.amazon.com/architecture/well-architected). Let's dive straight in and generate a report now.
You will need multiple Node packages available to you on the machine that will connect into AWS. Expect the packages shown in Listing 15.6; although there are many packages, they only use a little over 40MB of disk footprint. The command to use to install the packages on Debian derivatives is as follows:
$ apt install npm
The next task is to clone the repository from GitHub using this command:
$ git clone https://github.com/tensult/cloud-reports.git
Figure 15.2 shows the start of the build taking place, after we run the next command from within the cloud-reports/ directory:
$ npm run build
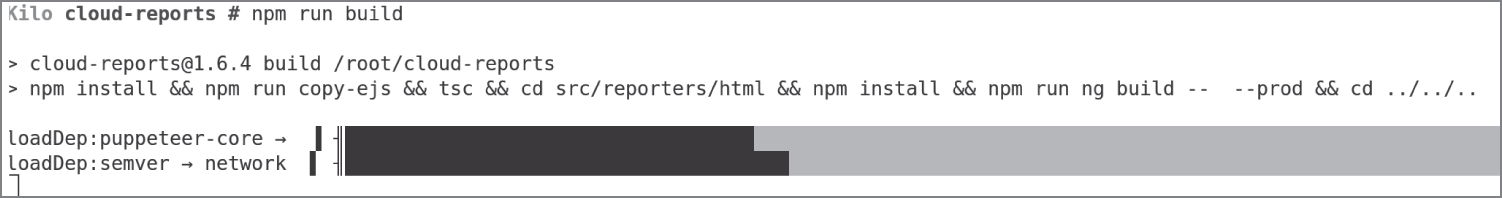
Figure 15.2: The start of the Cloud Reports build process, courtesy of Node.js
You will need a modicum of patience to get through the build process, which includes downloading the Chromium Browser. If you become impatient, it is probably worth logging into AWS at this stage and getting ready to provide some credentials unless your machine is lightning fast. On a medium-spec laptop, it is probably going to take around 10 minutes to complete the build. The end of the process looks like the output in Figure 15.3.
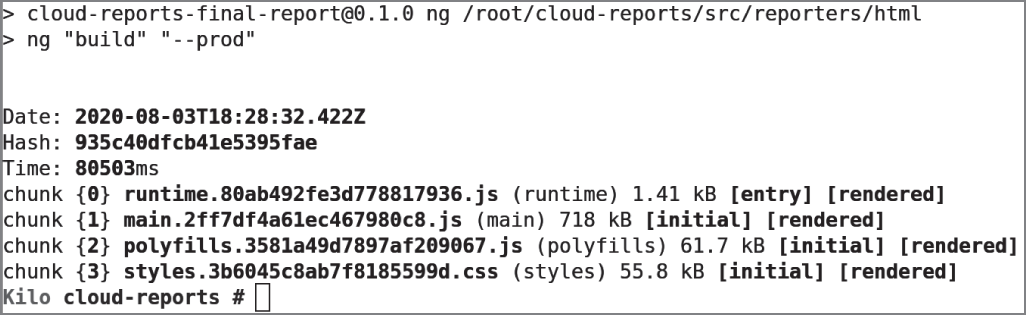
Figure 15.3: The end of the build process
For the purposes of this demonstration, we will create a new user called cloud-reports and attach an IAM policy directly to the user. For a nonproduction account, we can just brave the overly permissive ReadOnlyAccess to many of the AWS services that you will definitely want to fine-tune yourself in the future. Figure 15.4 shows List and Read permissions.
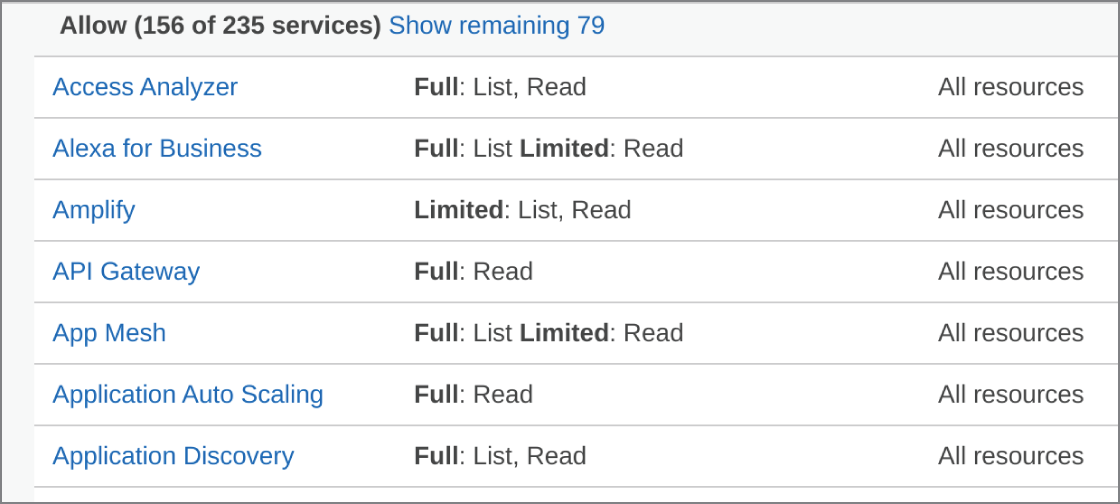
Figure 15.4: The IAM policy is very permissive, even as read-only, so be sure to tune it to your security needs.
To scrutinize the existing policy and create a customized policy afterward, you can visit the IAM page directly here:
https://console.aws.amazon.com/iam/home?region=us-east-
1#/policies/arn:aws:iam::aws:policy/ReadOnlyAccess$jsonEditor
You should use IAM roles and not users as per standard role-based access control (RBAC) recommendations. AWS states that “a role does not have standard long-term credentials such as a password or access keys associated with it. Instead, when you assume a role, it provides you with temporary security credentials for your role session.” Further information can be found at https://docs.aws.amazon.com/IAM/latest/UserGuide/id_roles.html.
Finally, we will run the CLI command from the awscli command to add our credentials. This step depends on how many AWS accounts you are using at the same time; for our needs we will just use default as the profile name as per this redacted command output:
$ cat ~/.aws/credentials[default]aws_access_key_id = AKIAYSXXXXXXXXRSPKaws_secret_access_key = XXXXXXXXXXXXXXXXXXXXXX
Generating Reports
We are all set to run the tool and generate reports. That was an easy process, even if the build took a little while. To get started, enter the default profile name and use the following command, which creates a PDF named scan_report.pdf
:
$ npm run scan -- --profile default
Make sure that you execute that file within the cloud-reports/ directory and wait patiently for the AWS API to respond to an abundance of requests. Do not be too alarmed if, during the process, you see some errors related to createPDF
; they appear to be innocuous, but if your scan fails, use the instructions that follow to output to HTML instead. Should you be unsure if the process is working, check the Last Used section in the Security Credentials tab to see which service the tool last accessed. It will show an AWS service name and an accessed time and date associated with it (under the Last Used column), as shown in Figure 15.5.
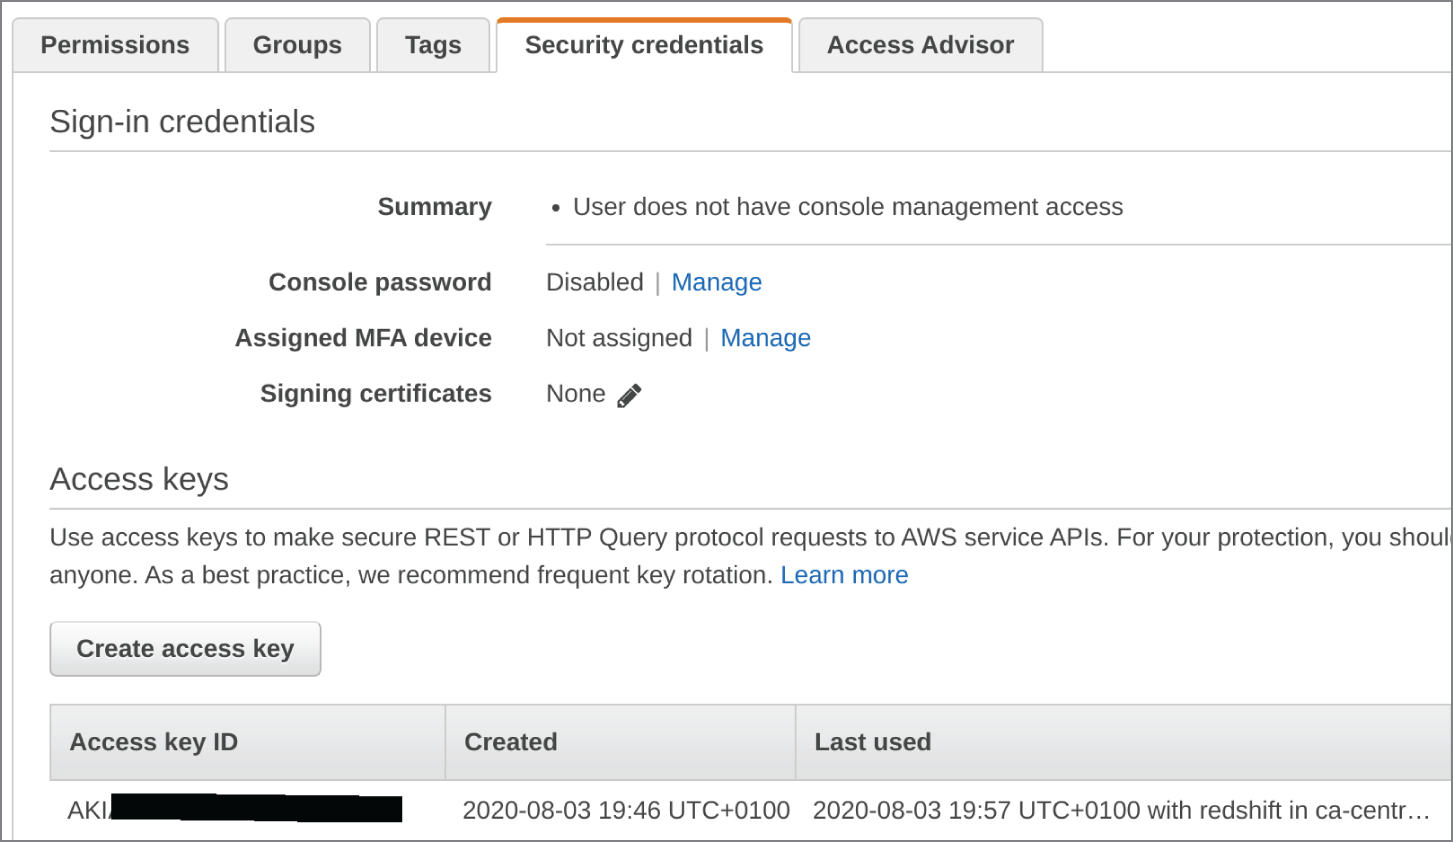
Figure 15.5: Check your progress via the Last Used column in IAM for your user or role.
Cloud Reports recommends running on an EC2 instance directly and, to speed things up, making sure that you have at least 2GB of RAM available. If, however, you do not want to scan everything and scan remotely, for example, then you can name specific AWS services with a command this way:
$ npm run scan -- -m s3,acm
You can also limit your regions, as follows:
$ npm run scan -- -m s3,acm -r us-east-1,eu-west-2
If you add -f html to your command, you will output to HTML format instead of to PDF. The same is true if you choose csv for a CSV file format. Adding -o will change the generated report name to something more familiar. If you have opted for HTML to avoid createPDF errors, just hit Ctrl+C when you are presented with some error output and look for the scan_report.html file. The command that generated the HTML report in Figure 15.5 was as follows:
$ npm run scan -- --profile default -m s3 -r eu-west-1 -d -u -f html
Note the -d and -u flags. The first is for debugging output to assist with troubleshooting, and the second is to reuse some of the data from previous scans in order to speed up the processing and then reduce the time it takes to produce a report. If you are frustrated with processing time because you are on a slow machine, start with as few services as possible.
The output from the tool is clean and easy to fathom. We can see in Figure 15.6 that we have only scanned AWS S3, and 21 buckets have been discovered. There are explanations in text about what Failed, Warning, Passed, and Info results mean, and there are a couple of things to note from this report.
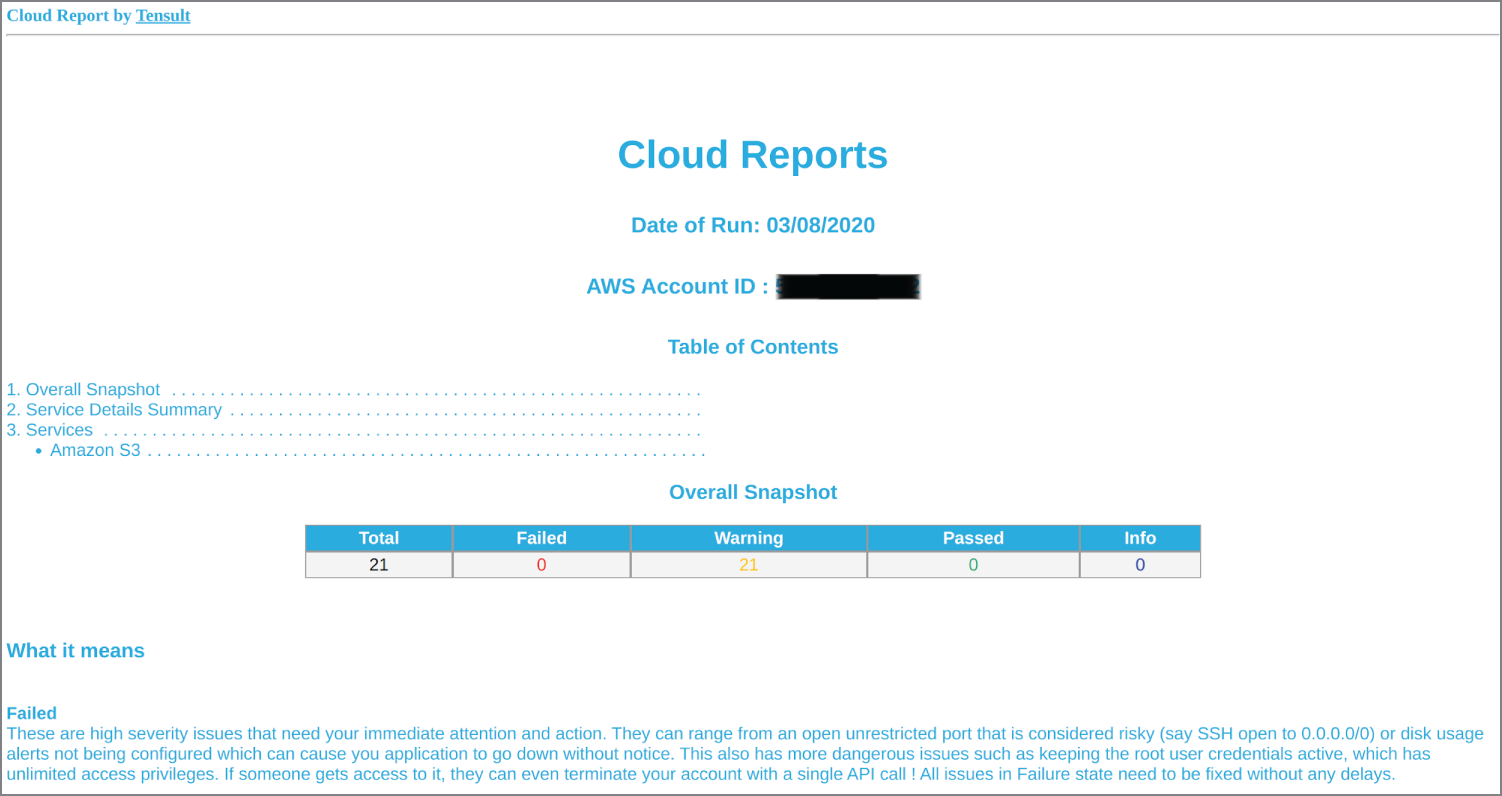
Figure 15.6: HTML output after using the -f html switch, with the AWS account redacted
First, out of the 21 buckets, one has been identified as having public access permissions, which is usually not a good thing at all for data loss prevention (DLP). In this case, however, it is a bucket plugged into the AWS CloudFront CDN service with public assets such as website images, so it is safe. The other warnings are that the buckets do not have cost optimization enabled with “Bucket Life cycle rules are not configured,” and we are dutifully told to “Configure life cycle rules” as a result.
EC2 Auditing
The report for EC2 on this particular AWS account is not quite as complimentary. The command used was as follows:
$ npm run scan -- --profile default -m s3 -r eu-west-1 -d -u -f html
For example, two keypairs were unused and in two different security groups: “SSH Port is open to entire world.” What did pass with flying colors, however, were the MySQL, RDS, Oracle, and Postgres ports, which were all closed within the security groups.
The welcome detail from Cloud Reports is that the auditing is still very comprehensive, even though in that region there were not any running EC2 instances. In Figure 15.7 we can see just how thorough it is.
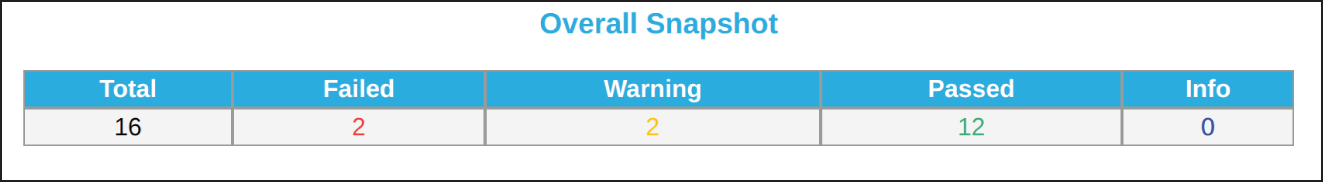
Figure 15.7: A relatively empty region in the AWS account still produced 16 findings.
You can apparently also run Cloud Reports against Microsoft Azure, too. When it is processing the associated API data, it first sorts them into collectors, which look something like the JSON shown in Listing 15.7.
The next part of the process involves what are called analyzers. As you may have guessed, these rules, of sorts, check against known best practices on the cloud platform of choice and are then run past the data found by the collectors. Listing 15.8 shows the analyzer output for reference.
Finally, the reporters generate the file type from the analysis as you would expect.
The excellent Cloud Reports is well worth a look. The attention to detail is invaluable to assist in periodically auditing the security posture of your AWS accounts.
CIS Benchmarks and AWS Auditing with Prowler
Another outstanding tool designed to compare findings against CIS Benchmarks is called Prowler (https://github.com/toniblyx/prowler). It produces colorful output and can be used in a CI/CD pipeline for testing.
If you have the Python package installer available on your system (named pip), then you are all set to install Prowler by using this single command:
$ pip install awscli detect-secrets
On modern Debian derivatives, you should be able to install pip with this command:
$ apt install python3-pip
You will also need the jq package available for formatting JSON output more cleanly:
$ apt install jq
Next, clone the GitHub repository and enter the directory, as follows:
$ git clone https://github.com/toniblyx/prowlerCloning into 'prowler'..remote: Enumerating objects: 6, done.remote: Counting objects: 100% (6/6), done.remote: Compressing objects: 100% (6/6), done.remote: Total 5012 (delta 0), reused 2 (delta 0), pack-reused 5006Receiving objects: 100% (5012/5012), 1.58 MiB | 70.00 KiB/s, done.Resolving deltas: 100% (3377/3377), done.$ cd prowler
We will assume that our AWS credentials are present in the file ~/.aws/credentials.
Or the preferred route is to export your AWS details with Environment Variables as so:
$ export AWS_ACCESS_KEY_ID="AXXXXXXXXXXX"$ export AWS_SECRET_ACCESS_KEY="XXXXXXXXXXXXXXX"$ export AWS_SESSION_TOKEN="XXXXXXXXXXXX"
For IAM permissions, we will need our user or role to have the following permissions attached from a policy or multiple policies. In this case, we will just attach the SecurityAudit and ViewOnlyAccess AWS Managed Policies. In Figure 15.8, we can see the UI version of listing these policies.
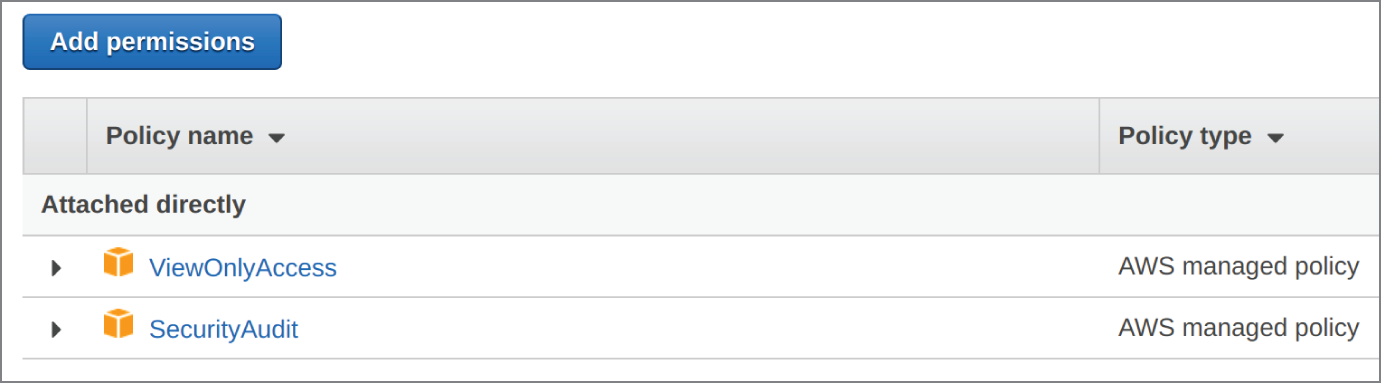
Figure 15.8: Prowler needs two IAM policies attached to an IAM user or role.
Run this command to execute Prowler:
$ ./prowler
The results are extremely comprehensive, just as the CIS Benchmarks are. We can see the start of the redacted output in Figure 15.9.
The auditing is not particularly speedy, because of the large number of checks made. As already mentioned, you will be offered insight into what each finding means, but it is important to cross-check with the CIS Benchmarks themselves to gain more information to assist with remediating issues.
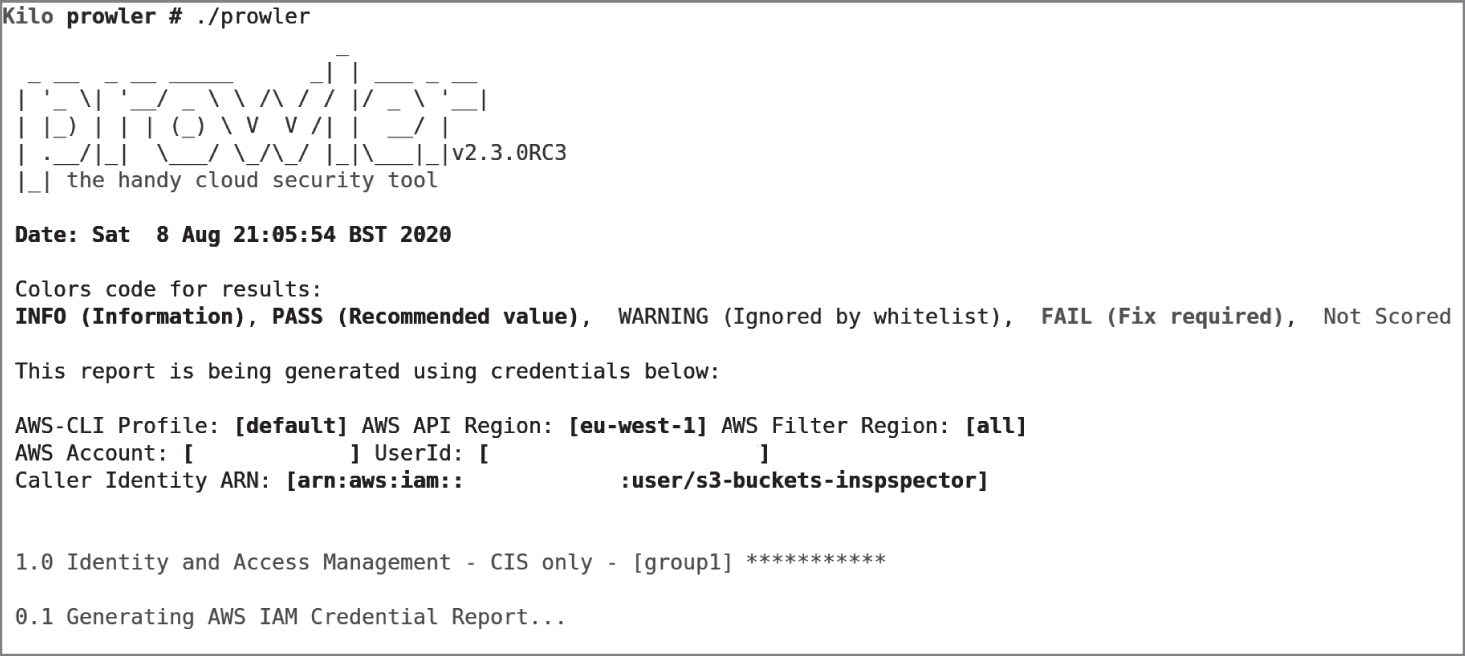
Figure 15.9: Prowler is firing up and ready to scan a (redacted) AWS account.
In Listing 15.9 we can see a sample of the output with the CIS item reference listed next to the findings.
The output for FAIL entries is always in red text for clarity, and PASS entries are in green text. The AWS account that the audit has run against is producing multiple FAIL warnings. The account is a laboratory account and not used in production, but the sheer volume of issues Prowler is capturing demonstrates nicely how many default settings you should change in order to harden your AWS accounts. In Listing 15.10 we can see more sample output.
Summary
In this chapter, we looked at three invaluable tools to help you secure your cloud estate. The first tool, Lunar, was incredibly diverse and gave instant feedback on Linux hosts, the container runtime, and AWS. Being written in shell scripts means it is more versatile than some other tools. Its output is thorough and provides useful information across all facets that it audits. Additionally, if you dare, it can also make changes to running systems in order to improve their security posture automatically.
The second tool we looked at, Cloud Reports, offers a useful perspective on multiple AWS services and presents findings in useful human-readable reports.
The third tool, the highly popular Prowler, also looked at AWS and focuses heavily on the recommendations found in CIS Benchmarks. The output, whether run once or periodically, is a real eye-opener on the level of work that you need to undertake to ensure that your AWS accounts are in good standing from a security perspective.
It would be prudent to run a combination of these tools against your hosts, container runtime, and AWS accounts to gain as much information as possible about the potential security flaws present. Creating a historical audit trail, in which periodic reports are archived, can be an excellent way of tracking changes to your infrastructure in addition.