
Chapter 11
Figuring Out the Financial Details
IN THIS CHAPTER
![]() Understanding how you calculate profits
Understanding how you calculate profits
![]() Balancing assets against your liabilities
Balancing assets against your liabilities
![]() Keeping track of your cash
Keeping track of your cash
![]() Looking at your company’s financial ratios
Looking at your company’s financial ratios
Numbers. Some people love them; others are bored by them; some begin to stammer, shake, and exhibit other physical signs of distress around them. But almost everyone agrees that — love ’em or hate ’em — numbers are the way that you keep track of things. Think baseball, cholesterol, your performance in school, the stock market, and, of course, your very own business venture. Numbers tell you more than simply the score at the end of the game or the final Dow Jones closing, however. When you put them together in the right ways, numbers paint a detailed picture of everything from the career of a ball player to the state of the global economy.
You’re probably familiar with the financial forms that a lender requires when you want to borrow money for a new car, a bigger house, or your dream cabin in the mountains. Those tedious documents include an income statement, as well as some sort of balance sheet. The income statement tells the funding fairies where you get your money and where you spend it, and how much is left over when the countin’ is done. The balance sheet lists the value of all the assets you own and balances the value against the money that you owe, including your car loans, mortgages, credit cards, and even personal I-owe-yous.
Financial statements tell the lender a great deal about you, and the decision-makers there discover even more by taking numbers from the statements and calculating a bunch of ratios (likely both calculated and evaluated by an algorithm today). It totals your monthly loan payments and divides that number by your monthly income, for example, and then compares this ratio with the average for other borrowers. The result gives the lending source a good measure of your ability to repay the loan. (And to be thorough, we also should inform you that any potential lender will access your FICO score; this metric, invented by a firm called Fair, Isaac and Company, uses an algorithm to estimate your creditworthiness.) Taken together, the statements and ratios create a financial portrait that the lender uses to get to know you better. And the better your lender knows you, the more comfortable it is with the decision to loan you money. The same goes for when you try to obtain money to start a business.
In this chapter, we introduce the basic financial statements and ratios that professionals widely use in business planning. In fact, they look almost identical to those that paint a picture of your personal finances, only a little more complicated. We show you how an income statement and a balance sheet are put together. We explain cash-flow statements, which do pretty much what the name implies (they detail where the money comes from, where it goes, and how much is left over). Finally, we explore simple financial ratios that you can use to evaluate your business.
Finance and economics might be on the dull side for many entrepreneurs, as well as seasoned managers, but if you don’t have at least a basic grasp of how your firm survives day to day in terms of its financial situation, you could well find yourself in the unemployment line.
 Heads up: This chapter and Chapter 12 are just chock-full of financial reporting minutiae, some — we know, we know — boring at best. But our intention is to let you make the choice: Analyze the data in detail to get a clear sense of what the numbers mean and how they relate to your business, or just do a quick speed-read and perhaps let someone else in the firm do the down-and-dirty work.
 And don’t forget that several excellent software programs out there can do all of the heavy lifting for you after you plug in your basic numbers. For one, try
 www.capterra.com and click on “Software Categories” on the menu bar; then click “Browse All Categories” and scroll down to those covering “Financial.” It will give you links to top-rated financial software vendors along with a snapshot evaluation of each. This will save you a ton of time, especially if you’re not a numbers junky.
Reading Income Statements
An income statement presents the proverbial bottom line. By adding all the revenue that you receive from selling goods or services and then subtracting the total cost of operating your company, the income statement shows net profit — how much money your company makes or loses over a given period. Here’s how to think of net profit:
Net profit = Revenue – Costs
The most important thing to remember here is the fact that the income statement captures a very simple idea. No matter what your accountants call it — an income statement, an earnings report, or a P&L statement of profit and loss — or how complicated they make it look, the income statement still uses the same basic principle of subtracting cost from revenue to show profit.
Your income statement should cover a period that makes the most sense for your business planning: monthly, quarterly, or yearly. You get a better financial picture of your company and its direction if you look at income statements over several periods and even over several years and compare the numbers. In Chapter 12, you develop a pro-forma income statement — a forecast of your future profits based on projected revenue and costs.
In this chapter, we use a fictional firm we call “Yenta’s Yogurt” (YY). It’s a yogurt-based drink maker and marketer, selling a branded product through grocery stores, convenience stores, and an online channel. Yenta’s has been up and running for several years now, and gross revenue is approaching $1 million.
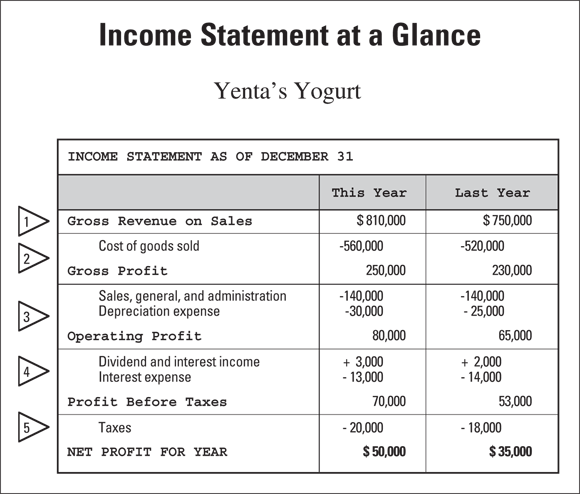
Look at the various parts of an income statement for Yenta’s Yogurt in Figure 11-1. Notice that it includes a two-year comparison to show how revenue, costs, and profits have changed. YY is a small company; if you want to make it a big company, just add three zeros after all the numbers (don’t you wish you could do this for your own business — poof, you’re a millionaire!). In either case, the income statement works exactly the same way.
Rendering revenue
Revenue refers to all the money that a company takes in. The most important source of revenue (usually the sale of goods or services) always appears as the first item on the income statement — in the case of Yenta’s Yogurt (refer to Figure 11-1), you see gross revenue on sales. In this context, gross doesn’t mean anything unpleasant; it indicates the total revenue without costs subtracted. Revenue from sources other than sales, such as interest earned or other payments not related to product revenue, usually shows up a bit later on the income statement.
© John Wiley & Sons, Inc.
FIGURE 11-1: An income statement subtracts the costs of your various business activities from your gross revenue to arrive at the company profit.
Gross revenue on sales is based on the number of units sold during a particular period multiplied by the prices paid. YY sold 32,400 12-pack cases of the drink at a price of $25 each case, for a gross revenue of $810,000 (this was the wholesale price received by YY; retailers marked up the retail price by varying percentages when selling to their own customers). You may have several products or kinds of services, or your prices may change over time. Maybe you have to make an allowance for items that customers return. All these considerations contribute to your calculation of gross revenue on sales.
Calculating costs
Typically, most businesses have to spend money to make money. You can divide the cost of doing business into general categories that reflect the separate activities that your company is involved in and the different kinds of expenses that you incur. Major cost categories include cost of goods sold, sales and administration expenses, depreciation, interest expense — and don’t forget taxes (though we’d love to). Each item deserves its own entry on the income statement.
Cost of goods sold
The cost of goods sold (COGS) combines all the direct costs of putting together your product or service, such as raw materials, supplies, and labor. If you offer a daycare service for young children, for example, the costs associated with delivering the service — meals, pillows and blankets, books and toys, and salaries for your assistants — go into the COGS.
Sales, general, and administration expenses
Sales, general, and administration expenses (SG&A) combine all the costs associated with supporting your product or service; these are often referred to as “overhead,” since they are not costs directly related to making the product (your COGS noted in the previous section). If the company consists of you, your laptop, and some spare space in the guest bedroom, the costs don’t amount to much. But for larger companies, these costs seem to go on and on. SG&A includes salaries and overhead for the sales staff, as well as the receptionist, clerical employees, and the boss. SG&A also can include advertising and promotion, travel, telephone calls, accounting fees, office supplies, dues and subscriptions, and everyone’s favorite: miscellaneous expenses.
Depreciation and interest expenses
Depreciation expense is a standard way to spread both the cost and the usefulness of big-ticket items out over time. Whether you buy a building, a truck, or a computer, almost any durable item slowly declines in value due to simple wear and tear or because new technology makes the item obsolete. Bean counters have come up with various ways to calculate that depreciation. All the methods allow you to allocate a portion of the purchase price as a business expense. Interest expense includes all the money that you pay out to the parties that loan you funds to operate your business.
Taxes
Even Albert Einstein stopped short of trying to figure his own taxes (and then again, so did a number of folks now serving 5 to 10). But taxes are a fact of life and represent another cost of doing business. You can minimize your company’s taxes by keeping careful track of all your other expenses — expenses that lower your profit and, therefore, lower your taxes. But be careful here; when in doubt, consult a tax authority. Better safe than sorry.
Pondering profits
Profit is the pot of gold at the end of the business rainbow. When you run your business well, the total costs flowing out are less than all the revenue coming in. Your profit, of course, represents the difference. But you should consider different kinds of profit at various stages along the way:
- Gross profit: Gross profit (terrible term, we agree) measures how much money your company still has after you subtract all the direct costs of putting together your product or service (cost of goods sold) from the total revenue generated by sales.
- Operating profit: Operating profit accounts for all the additional sales, general, and administration (SG&A) costs that you incur as part of operating your business.
- Profit before taxes: Profit before taxes takes everything else into account, including any financial transactions that you make. Your income from other sources (such as investment dividends and interest) is included here.
- Net profit: Net profit, of course, represents the bottom line after the government subtracts the company’s tax bite. In our example, Yenta’s Yogurt (refer to Figure 11-1) made money in its most recent annual reporting period (yeah!).
Interpreting Balance Sheets
An income statement reports on the financial results of your business over a given period; a balance sheet is more like a snapshot of your financial condition at a particular time. The income statement lists your revenue, your costs, and the profit that you make. The balance sheet, on the other hand, captures what your company owns, what it owes, and, therefore, what it’s worth at a given moment. Ideally, the balance sheet tells you how much money you would have left over if you sell absolutely everything and then pay every last one of your debts. Your investors and particularly your lenders are interested in your balance sheet, because it gives them some idea of what their investment in your company is worth.
The things that your company owns are called assets. The amounts that you owe make up your liabilities. The difference between the two represents the equity in your business. Think of equity in terms of the following equation:
Equity = Assets – Liabilities
The equation couldn’t be simpler. So, naturally, accountants dreamed up another, less-straightforward way of looking at this equation — and, of course, you find this one on most balance sheets. It looks like this:
Assets = Liabilities + Equity
You always find a balance sheet divided into two parts. The top half deals with all the company’s assets; the bottom half lists liabilities and equity. Because of the second equation, the top and bottom half are always in balance, adding up to exactly the same amount.
With the preparation of tax returns in mind, you often compile the balance sheet for the last day of the year. Figure 11-2 shows YY’s balance sheet. In this case, we provide figures for two years so that you can make a comparison; this is always a good idea as you — and your investors — want to have an indication of current trends.
Ascertaining assets
Your company’s assets include anything and everything you own that has any monetary value. When you think about your assets in terms of the balance sheet, all that should concern you is how much each asset is worth and how quickly you can sell it. So you separate assets into categories, depending on how liquid they are — how fast and easy you can liquidate (or sell) them into cold, hard cash. You can dispose of current assets within a year if you have to, whereas fixed assets often take much longer to get rid of.

© John Wiley & Sons, Inc.
FIGURE 11-2: The balance sheet captures what the company owns, what it owes, and what it’s worth.
Current assets
Current assets represent your company’s readily available reserves. As such, you draw on these assets to fund your day-to-day business operations; you may have to turn to them in a financial emergency as well. Current assets include the following:
- Cash: You can’t get any more liquid than cash, which is just what you expect it to be: bills and coins in the till, the petty-cash fund, money deposited in the bank, and cryptocurrency with your online DeFi source if that’s your thing.
- Investment portfolio: Investments are usually liquid assets. Your investment portfolio includes savings accounts, short-term government bonds, and other safe securities that you invest in to watch your cash earn a bit of money while you wait to use it.
- Accounts receivable: Accounts receivable represents the money that customers owe you for goods and services that you previously delivered. Maybe you give customers 30, 60, or 90 days to pay.
- Inventories: The cash value of your inventories should reflect the costs of the raw materials and supplies that you have on hand, as well as the value of partially finished products and products that your shipping department is ready to transport.
Fixed assets
Fixed assets are fixed in the sense that you can’t readily convert them into cash. These assets are the big-ticket items that usually cost a great deal of money up front and are meant to last for several years.
On the balance sheet, the value of a fixed asset is based on its original cost minus its accumulated depreciation over time, so the figure doesn’t necessarily reflect the true market value of the asset or how much it may actually cost to replace it. Fixed assets can include the following:
- Land: You list the land that your company owns separately on the balance sheet, because it doesn’t depreciate over time; its value on the books remains the same from year to year. (This, unfortunately, is one of the quirks of modern accounting. Suppose that you purchased the land in your business ten years ago. By now, it’s worth double because of appreciation in the local real estate market. But yet on the books, it still shows as the original purchase value. Result? Your firm might be worth far more in value than what shows on the balance sheet.)
- Buildings, equipment, and machinery: This asset class represents the original cost of all the big-ticket items that you invest in to operate your company.
- Minus accumulated depreciation: Depreciation measures the decline in the useful value of a big-ticket item over time, so the original cost of all your fixed assets (excluding any land) is reduced by an amount equal to the total depreciation accumulated over the years. Notice that YY shows accumulated depreciation increasing by $30,000 in its most recent year (see Figure 11-2). Because its fixed assets are now worth $30,000 less on paper, YY also takes a $30,000 depreciation expense on its income statement (refer to number three in Figure 11-1).
Intangibles
You can’t hold them in your hand or store them in a warehouse, but intangibles can be extremely important to your company. Intangibles include such things as your rights to a manufacturing patent, a long-term contract, an exclusive service franchise, or a brand name or logo. How important is the “swoosh” to Nike, for example?
Categorizing liabilities and owners’ equity
Your company’s liabilities cover all the debts and obligations that you enter into as you run your business. In the same way that you divide up your assets, your liabilities come in categories based on how soon you must pay. Current liabilities are those that you have to pay off within a year; long-term liabilities may stay on the books much longer. When you subtract these liabilities from total assets, you come up with owners’ equity, which is a measure of how much the company is worth.
Current liabilities
Current liabilities are the debts that your company agrees to pay in the short term (say, within a year), so you have to be able to cover them from your current assets. What you have left over (the difference between your current assets and current liabilities) is so important that it has a name: working capital, or the chunk of money that you actually have to work with in the short term.
Accounts payable represents the amounts that you owe your regular business creditors as part of your ongoing operations. Your company also owes salaries and wages to its employees, interest on bank loans, and the taxes that you haven’t sent in. These liabilities are accrued expenses payable.
Long-term liabilities
Long-term liabilities usually represent large chunks of money that you pay back over several years. You may have gone to the bank and secured a loan against your company’s assets. In any case, you probably use the money to invest in the long-term growth of your business.
Owners’ equity
There are two major sources of equity: money and resources that flow in from outside the company, and profits that the owners keep and pump back into the company. Owners’ equity can be any of the following:
- Invested capital: The money that people invest in your company can take various forms, from the direct infusion of cash by inside owners to the buying and selling of stocks that represent small chunks of the company owned by outside investors. Invested capital represents the total of all this money.
- Accumulated retained earnings: After your company starts making a profit each year (and we hope it does), you can distribute it to the owners (that arrangement is where dividends come from) or keep part of it to reinvest in the business. Accumulated retained earnings represent the profits that you put back into the company year after year.
Examining Cash-Flow Statements
If you know what your company is worth and how much it makes every year, can’t you just relax and assume that your financial plan is in reasonably good order? After all, what else do you need to know?
As it turns out, you have to keep close track of one other absolutely indispensable resource: cash. No matter how good your situation looks on paper — no matter how bright the balance sheet and how rosy the income statement — you still need cash on hand to pay the bills. The fact that you retain assets and make a profit doesn’t automatically mean that you have money in the bank.
The cash-flow statement monitors changes in your cash position over a set period. The top half of the statement tracks the flow of cash in and out of your company; the bottom half reports where the funds end up. Just like a balance sheet (see the earlier section “Interpreting Balance Sheets”), the money represented on the top and bottom halves of a cash-flow statement match. For newer firms, this is the statement that usually gets the most attention from your investors: When you’re out of cash, you’re usually out of business.
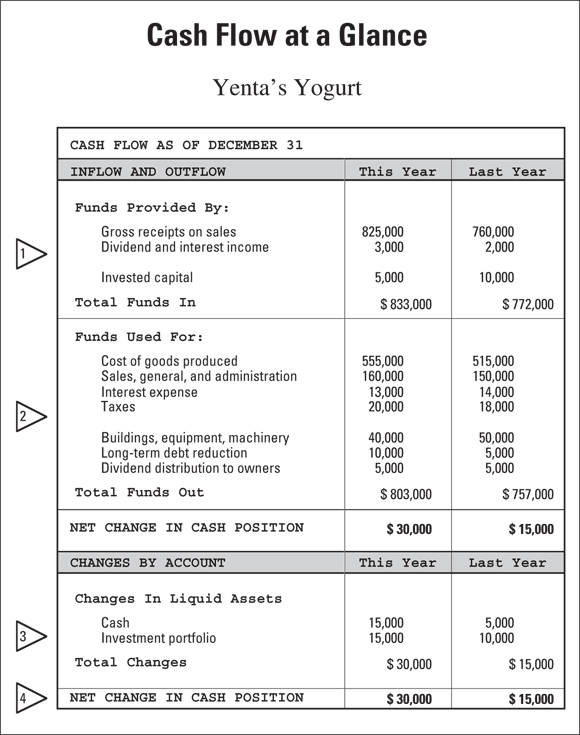
Figure 11-3 shows a cash-flow statement for Yenta’s Yogurt. The cash-flow statement contains many of the same elements as an income statement with a few critical adjustments.
© John Wiley & Sons, Inc.
FIGURE 11-3: A cash-flow statement monitors changes in a company’s cash position over time.
Moving money: Cash in and cash out
The top half of the cash-flow statement deals with the inflow and outflow of cash, tracking where your company gets funds and how you use them. The cash-flow statement is a little more telling than an income statement, because the cash-flow statement shows money coming in only when you actually deposit it and money going out only when you actually write a check.
Knowing where your funds come from
Where does all your money originate? Your funds are usually made up of the following:
- Gross receipts on sales: This entry represents the total money that you take in on sales during the period. Gross receipts are based on your gross revenue. YY, as Figure 11-3 shows, received all $810,000 in gross revenue this year plus $15,000 in accounts receivable that customers owed the company from last year, for a total of $825,000.
- Dividend and interest income: Your income from savings accounts and other securities is also reported in your income statement.
- Invested capital: The money invested in your company shows up as part of the owners’ equity on your balance sheet. As Figure 11-3 shows, YY received an additional $5,000 in invested capital this year.
Gauging how you use your funds
Where does all your money go? The cash-flow statement keeps track of the costs and expenses that you incur for anything and everything. These funds usually consist of the following:
- Cost of goods produced: This entry represents the total cost of producing your product or service during the period. YY, as shown in Figure 11-3, reduced its overall inventory by $5,000 this period, so the company’s cost of goods produced was $5,000 less than its cost of goods sold from the income statement.
- Sales, general, and administration (SG&A): These expenses are the same SG&A expenses that appear on an income statement (see the earlier section “Sales, general, and administration expenses”). YY, as shown in Figure 11-3, paid down $10,000 in both its accounts payable and expenses payable this year, increasing its SG&A cash outflow by $20,000 for a total of $160,000.
- Interest expense and taxes: Interest expense and taxes show up on the income statement as well. The number reflects the amount that you actually pay out during the period.
- Buildings, equipment, machinery: When your company buys a big-ticket item, it doesn’t appear on your income statement as an expense, because you’re really just trading cash for another asset. When you buy the building, truck, or computer, however, you have to pay for it. The cash-flow statement reflects the costs. YY, as shown in Figure 11-3, shelled out $40,000 this year for new equipment.
- Long-term debt reduction: It costs you money to pay down any long-term debt that your company may have, and that expense doesn’t appear on the income statement. YY reduced its long-term debt by $5,000 last year and $10,000 this year.
- Dividend distribution to owners: The portion of your company’s profits that you decide to give back to the owners comes directly out of your cash box. YY distributed $5,000 to its owners this year.
Watching cash levels rise and fall
The flow of cash in and out of your business is like water flowing in and out of a reservoir. If more water comes in than goes out, the water level goes up. When your company’s cash reserves rise, the money flows into one or more of your liquid-asset accounts. The bottom half of your cash-flow statement keeps track of what happens to those accounts. This year, for example, YY improved its cash reserves, liquid assets, and investment portfolio by $30,000 (see Figure 11-3). Not coincidentally, this $30,000 is the difference between the $833,000 that YY took in during the year (total funds in) and the $803,000 that it spent (total funds out).
Evaluating Financial Ratios
Armed with an income statement, a balance sheet, and a cash-flow statement, you have a relatively complete financial picture of your company in front of you (if not, check out the three preceding sections on those topics). But when you look over everything, what does that financial picture actually tell you? Is it good news or bad news? What should you plan to do differently as you go forward?
Your financial picture may tell you that you pay your bills on time, keep a cash cushion, and make some money. But could your company do better down the road? Ideally, you could look at the picture year after year and compare it against a competitor, several competitors, or even your entire industry. But companies come in all shapes and sizes, and comparing numbers from any two companies and making sense of them is a hard task.
As a result, companies use financial ratios. When you divide one number by another, you create a ratio and eliminate many of the problems you encounter when comparing numbers on different scales.
If you want to compare your company’s financial ratios with those of major competitors or with an industry average, you need to get your hands on some outside data. You can always start by asking your banker, accountant, or investment advisor, because financial institutions keep close track of standard ratios across industries. But you should also check out financial-data services. The U.S. Library of Congress provides access to Standard and Poor’s Industry Surveys (www.loc.gov/rr/business//company/industry_surveys.html). Value-Line and Moody’s are also sources of detailed industry data, while Dun & Bradstreet offers a publication called Industry Norms and Key Business Ratios, also available on the Library of Congress website (https://guides.loc.gov/dun-and-bradstreet/key-business-ratios). There really is a massive amount of data out there today, most of which is available at your fingertips. Try some artful Googling and see what you come up with that is specific to your own needs.
Financial ratios fall into three categories. The first two categories take your company’s vital signs to gauge your chances of pulling through (remaining solvent, that is). One set of ratios measures your company’s capability to meet its obligations in the short term; the other looks at the long term. The final set of ratios indicates just how strong and vigorous your company really is, measuring its relative profitability from several points of view.
Meeting short-term obligations
The overriding importance of promptly paying your bills every month is the major reason why current assets and current liabilities receive special attention on a company’s balance sheet (see Figure 11-2). The difference between the two — your working capital — represents a safety net that protects you from financial catastrophe.
Having liquid assets available when you absolutely need them to meet short-term obligations is called liquidity. You can use several financial ratios to test your company’s liquidity.
Current ratio
You determine your company’s current ratio by looking at your balance sheet and dividing your total current assets by your total current liabilities:
Current ratio = Current assets ÷ Current liabilities
Yenta’s Yogurt, for example, has a current ratio of $320,000 ÷ $140,000, or 2.3 (refer to Figure 11-2). You can also express this ratio as 2.3 to 1 or 2.3:1.
What magic number should you aim for? If your company falls below a current ratio of 1.0, you face serious financial danger. In most cases, you want the number to stay above 2.0, which means that you have more than twice the current assets that you need to cover current liabilities.
Quick ratio
You sometimes hear the quick ratio called the acid test, due to it being more stringent than the current ratio. The quick ratio doesn’t allow you to count inventories and prepaid expenses as part of your current assets because of the difficulty in turning them back into cash quickly. This situation holds particularly true in industries in which products go out of fashion rapidly or become quickly outdated by new technology.
The quick ratio is as follows:
Quick ratio = (Cash + Investments + Receivables) ÷ Current liabilities
YY has a quick ratio for this year of $200,000 ÷ $140,000, or 1.4 (refer to Figure 11-2). You want to keep your company’s quick ratio above 1.0 by a comfortable margin or measure it by standards in your industry.
Inventory turnover
Inventory turnover tells you something about the liquidity of your inventories. This ratio divides the cost of goods sold, as shown on your yearly income statement, by the average value of your inventories. If you don’t know the average, you can estimate it by using the inventories listed on the balance sheet at the end of the year. Here’s the formula:
Inventory turnover = Cost of goods sold ÷ Inventories
YY has an inventory turnover of $560,000 ÷ $115,000, or 4.9. (Refer to Figures 11-1 and 11-2 for the company’s income statement and balance sheet, respectively.) This ratio means that YY turns over its inventory almost five times each year. Expressed in days, YY carries a 75-day (365 ÷ 4.9) supply of inventory.
Is a 75-day supply of inventory good or bad? It depends on the industry and on the time of year. For Yenta’s Yogurt, 75 days is likely too much; after all, these are perishable products. As automation, computers, and information systems make business operations more efficient across all industries, inventory turnover is on the rise, and the average number of days that inventory of any kind hangs around continues to shrink.
Receivables turnover
Receivables turnover gives you information about how fast customers pay you by dividing the sales that you make on credit by the average accounts receivable. If an average isn’t available, you can use the accounts receivable from the balance sheet. Here’s the formula:
Receivables turnover = Sales on credit ÷ Accounts receivable
If YY makes 80 percent of its sales on credit, its receivables turnover is ($810,000 × 0.8) ÷ $135,000, or 4.8. (Refer to Figures 11-1 and 11-2 for YY’s income statement and balance sheet, respectively.) In other words, the company turns over its receivables 4.8 times per year, or once every 76 days on average — not a good turnover if YY’s payment terms are 30 or 60 days. Unlike fine wine, receivables don’t improve with age.
Remembering long-term responsibilities
Your company’s liquidity keeps you solvent from day to day and month to month, but what about your ability to pay back long-term debt year after year? Two financial ratios indicate what kind of shape you’re in over the long haul. The first ratio gauges how easily your company can continue to make interest payments on the debt; the second determines whether the principal amount of your debt is in any danger.
If you’ve read this chapter from the beginning, you may be getting really bored with financial ratios by now (actually, you may be snoring). But your lenders — bankers and bondholders, if you have them — find these long-term ratios incredibly fascinating, due to your possession of their money.
Times interest earned
Earnings before you pay any interest expense and taxes (EBIT) represents the profit that you have available to make your interest payments. Here’s the formula:
Times interest earned = Earnings before interest and taxes ÷ Interest expense
Yenta’s Yogurt, for example, has an EBIT of $83,000 divided by an interest expense of $13,000 this year for a times-interest-earned ratio of 6.4. (Refer to Figure 11-1 for the company’s income statement.) In other words, YY has 6.4 times as much profit as it needs to pay off its interest expense obligation.
You may also hear the same number called an interest coverage. Lenders get mighty nervous if this ratio ever gets anywhere close to 1.0, because at that point, you must use every last cent of profit to pay interest on the long-term debt.
Debt-to-equity
The debt-to-equity ratio says a great deal about the general financial structure of your company. After all, you can raise money to support your company in only two ways: Borrow it and promise to pay it back with interest, or sell pieces of the company and promise to share all the rewards of ownership. The first method is debt; the second, equity. Here’s the formula:
Debt-to-equity = Long-term liabilities ÷ Owners’ equity
YY has a debt-to-equity ratio of $90,000 ÷ $385,000, or 0.23. (Refer to Figure 11-2 for YY’s balance sheet.) This ratio means that the company has more than four times as much equity financing as it does long-term debt.
Lenders love to see plenty of equity supporting a company’s debt, because they know that the money they loan out is safer. Equity investors, on the other hand, actually want to take on some risk. They like to see relatively high debt-to-equity ratios, because that situation increases their leverage (see the later section “Return on equity”) and can substantially boost their profits (as the following section points out).
Reading relative profitability
Profitability shows you how well you measure up when it comes to creating financial value out of your company. Profitability ratios allow you to keep track of your performance year by year. They also allow you to compare your profitability against the performance of other competitors, other industries, and even other ways of investing resources. By comparing profitability ratios, you begin to see whether your company measures up, generating the kinds of financial rewards that justify the risks involved.
Profitability ratios come in three flavors. The first type of ratio examines profit relative to your company sales. The second type examines profit relative to total assets. The final type examines profit relative to owners’ equity. Each of the ratios reflects how attractive your company is to an investor.
Net profit margin
The net profit margin ratio says more about your costs in relation to the prices that you charge than about net profit divided by gross revenue. If your net profit margin is low compared with the margins of other companies in your industry, your prices are generally lower or your costs are too high. Lower margins are acceptable if they lead to greater sales, larger market share, and bigger profits down the road, but you want to monitor the ratio carefully. On the other hand, no one quibbles with high net profit margins, although the high number is an awfully good way to attract new competitors.
Here’s the ratio:
Net profit margin = Net profit ÷ Gross revenue on sales
YY has a net profit margin this year of $50,000 ÷ $810,000, or 6.2 percent. (To examine YY’s income statement, refer to Figure 11-1.) That result shows a substantial increase from the 4.6 percent the year before. This is good.
When you calculate your net profit margin, you should also think about calculating margins based on your operating profit and gross profit. Together, these ratios give you a better idea of where your company’s profitability comes from.
Return on investment
Net profit divided by total assets gives you the overall return that you can make on your company’s assets — sometimes referred to as return on assets (ROA). Here’s the formula:
Return on investment = Net profit ÷ Total assets
Because these assets are equal to all your debt and equity combined (refer to the earlier section “Interpreting Balance Sheets”), the ratio measures an average return on the total investment in your company. What does the ratio mean? Return on investment (ROI) is widely used as a test of company profitability, because you can compare it to other types of investments that an investor can put money into.
 The value of the total assets you use in the calculation of ROI usually is taken from your company’s balance sheet and may be way off base. If the assets have been around for a while, the numbers on the page may not reflect real replacement costs, and if the assets are undervalued (like real estate purchased long ago), the ROI is bound to be a bit exaggerated.
YY has an ROI this year of $50,000 ÷ $615,000, or 8.1 percent. (Refer to Figures 11-1 and 11-2 for the company’s income statement and balance sheet.) That figure is up from 5.9 percent the year before, and the increase certainly represents good news.
Return on equity
Net profit divided by the owners’ equity in your company gives you the return on the equity portion of the investment (ROE). Keep in mind that you already took care of all your bankers and bondholders first by paying their return — the interest expense on your debt — out of your profits. Whatever remains goes to the owners and represents their return on equity. Here’s the ratio:
Return on equity = Net profit ÷ Owners’ equity
You always pay your creditors first, and you pay them a fixed amount; everything else goes to the owners. Now you find out where leverage comes in. The more you finance your company by building debt, the more leveraged you are; the more leveraged you are, the more you use other people’s money to make money. Leverage works beautifully as long as you successfully put that money to work — creating returns that measure higher than your interest costs. Otherwise, your lenders may end up owning your company. Ouch!
YY, for example, has an ROE of $50,000 ÷ $385,000, or 13.0 percent. (The income statement and balance sheet shown in Figures 11-1 and 11-2 shed some light on where these figures come from.) Without any leverage, that ROE is the same as the company’s return on investment (ROI), only 8.1 percent (see the previous section). More leverage may raise the ROE even higher, upping your risk of losing your company if your revenues fall too far too fast. In short, leverage makes the good years better for the owners and the bad years much worse.