
2
Block Diagrams
A block diagram portrays the general structure of a device or system. Such a diagram can provide a simplified rendition of a complicated system by separating its main parts and showing you how they interconnect and interact. In computer engineering, block diagrams can help you envision how programs or other processes work.
A Simple Example
Figure 2-1 shows a block diagram of a device that converts alternating current (AC), of the sort you find at the electric outlets in your house, to direct current (DC), of the sort you get from an electrochemical battery. Hobbyists and professionals call this type of device a power supply.
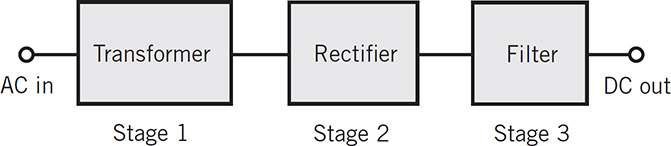
FIG. 2-1 Block diagram of an AC-to-DC converter, also called a power supply. You’ll naturally sense that the electricity flows from left to right, so the lines have no arrows.
The terminal at the far left accepts the AC input. As you go from left to right, the electricity passes through the transformer, the rectifier, and the filter before arriving at the output as pure DC. In this case, the lines between blocks have no arrows; the diagram’s creators assume that you can sense the process direction without them.
Functional Drawings
Block diagrams can indicate the interconnections among small circuits in a larger device, or among diverse devices in a massive system. When you see a block diagram rendered in the style of Fig. 2-1, you can call it a functional diagram because it tells you something (but not a lot) about what the device does. If you want to know more detail, you’ll need to see the schematic.
An engineer who wants to design a complex electronic system can start with a block diagram. It shows all the circuit sections (stages) in a functioning device, but none of the internal details of those stages. Then the engineer develops schematics of circuits that fill each block and serve the appropriate function. The first block gets replaced by the schematic of the circuit it represents. The engineer proceeds through the blocks in functional order, creating schematics that you can use to build each stage in the system. When every block has been replaced with a schematic, a detailed (but so far only theoretical) system design exists.
Another way of using block diagrams involves starting with the complete schematic of a system. Imagine that the schematic is quite complicated, and for some unknown reason the system doesn’t work as the engineer thinks it should. Although a schematic can describe the functioning of an electronic system, it’s not as clear as a functional block diagram for that purpose. The schematic literally has too much information! Lacking a block diagram, a repair technician would have to start with the schematic, laboriously identify each stage in the system, and then draw the entire system diagram in block form. When finished, the block diagram would reveal how each stage interacts with the others. Using this method, the technician could identify one or more stages as likely trouble zones, and refer back to the original schematic to conduct tests in those suspect circuits.
You can describe the operation of a specific type of radio system, for example, an amplitude-modulated (AM) voice transmitter, by means of a block diagram. Of course, no two AM transmitters built by different manufacturers are identical, but all of them contain similar functional stages. One type of oscillator might work differently from another type, but all oscillators do the same thing: generate an RF signal! When you want to know or portray small differences among circuits that do essentially the same things, then you need schematics of them all.
The block diagram of Fig. 2-2 shows a strobe light system as you might see it in the assembly manual for a kit comprising self-contained circuits, a set of cables, and an instruction manual. You connect the cables (solid lines with arrows) among the self-contained circuits (blocks) provided with the kit, meticulously following the instructions in the manual.
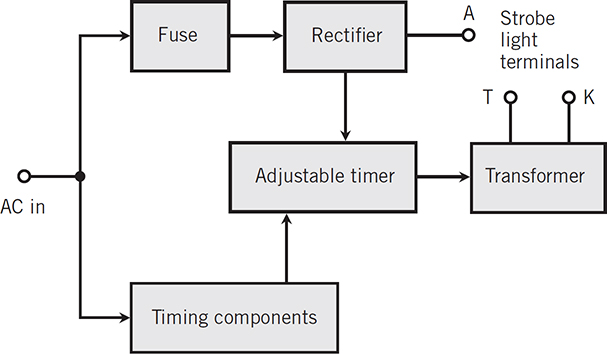
FIG. 2-2 Block diagram of a circuit designed to provide power to a strobe light. Arrows show how the electricity flows.
The input signal enters at the left; it’s utility AC such as you get from a standard wall outlet. In the United States, this AC has a nominal voltage of 117 volts (117 V) and a frequency of 60 hertz (60 Hz), where “hertz” means “cycles per second.” (In some countries the voltage is about 234 V, and in some countries you’ll find a frequency of 50 Hz rather than 60 Hz.) The input AC goes to a fuse, and also to a combination of components that provide timing.
The top path, where you see the fuse, leads to a rectifier whose output passes to one terminal of a three-terminal strobe lamp. The rectifier output also connects to an adjustable timer that provides a variable flash rate for the lamp. The timer output goes to a transformer, which in turn connects to two more lamp terminals. You don’t have to know what the designators “A,” “T,” and “K” mean; you need only know how to hook up the cables as you assemble the kit! Some people call this sort of “monkey see, monkey do” instructional drawing a wiring diagram.
Current and Signal Paths
Figure 2-3 is a block diagram of a power supply that produces several outputs having various electrical characteristics. As you proceed through the diagram from the left-hand end (the input) to the right and downward (the outputs) according to the arrows, you’ll see that the system operates from 117 volts AC (117 VAC), commonly found at utility outlets in the United States. The entire power supply could reside in a single cabinet with a single cord and plug for a wall outlet and screw-on terminals for connection to multiple devices.
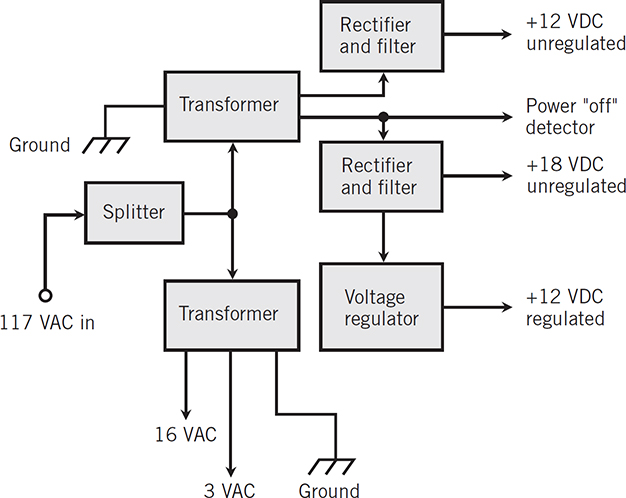
FIG. 2-3 Block diagram of a power supply that produces several different outputs.
The input AC gets split into two identical paths, both at 117 VAC. One splitter output goes to the “lower” transformer that provides 16 VAC and 3 VAC output. The other splitter output runs to the “upper” transformer, which goes to:
• A “top” rectifier/filter that provides +12 volts DC (+12 VDC) without voltage regulation
• A power “off” detector, such as an AC voltmeter or alarm
• A “bottom” rectifier/filter that provides +18 VDC without voltage regulation
In addition, the “bottom” rectifier/filter output connects to a voltage regulator that maintains it at a steady +12 VDC regardless of minor power surges and dips in your household voltage as it comes from the utility company.
Figure 2-4 is a block diagram of a simple AM radio transmitter. You speak into the microphone, which leads to an AF preamplifier to give your voice signal some power (but not much). A second AF amplifier gives your voice a lot of “punch”! The AF matching network ensures that the voice signal will deliver the most possible power to the modulator/amplifier, which receives its RF energy from an oscillator whose frequency is determined by a quartz crystal. The instantaneous RF modulator/amplifier output power fluctuates in accordance with the instantaneous AF input level to produce an AM signal, which passes through an RF tuning network to the antenna.
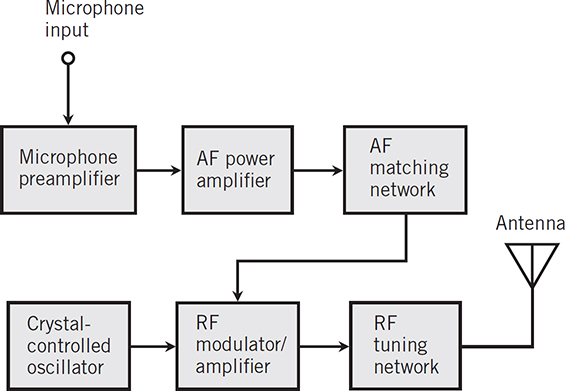
FIG. 2-4 Block diagram of an AM radio transmitter.
Flowcharts
Block diagrams can describe how electronic systems work, but in the world of computers, another form of diagram, called a flowchart, can portray the functioning of a program or software. A flowchart resembles a block diagram, except that the symbology applies to the sections of a computer program, an intangible thing (as opposed to an electronic system, a tangible thing). A flowchart provides a graphic representation of the logical steps that a computer takes as it executes a program. Software engineers prepare flowcharts in conjunction with specifications, and modify the flowcharts as user requirements change.
For complex problems, a formal written specification can ensure that everyone involved understands and agrees on the nature of the problem, and on the desired results of the program. For example, suppose that a schoolteacher (that’s you!) uses a computer program to help determine a student’s final course grade by calculating an average from scores the student got for quizzes during the course period. You input each and every quiz score to the program. The program outputs the average of all those scores. Figure 2-5 shows a flowchart of the program process, as follows.
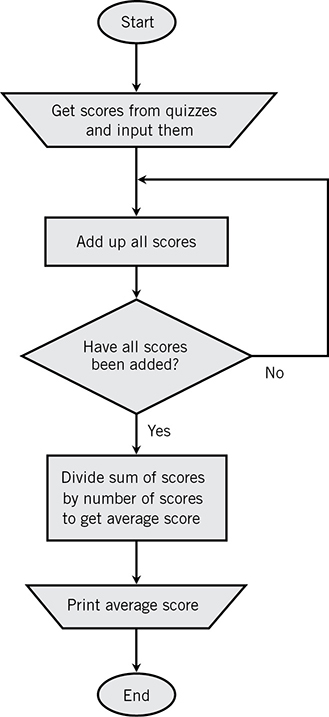
FIG. 2-5 A flowchart that describes a computer program.
• Receive the quiz scores from you.
• Add up all the quiz scores to get their sum.
• Verify that you have accounted for all the quiz scores.
• Divide the sum by the number of quizzes to get the average quiz score.
• Print the average quiz score.
The computer leaves the hardest task in the process to you, the teacher: Decide what grade the student deserves! If the quizzes were difficult, you might accept fairly low average scores for standard “letter grades” (such as A, B, C, D, or F); if the quizzes were easy, you might demand higher average scores for given grades.
The flowchart graphically presents the structure of the program, revealing the relationship among the steps and paths. When a program has many different paths that result from numerous decisions, a flowchart can help you sort things out. You can use the flowchart as a tool to understand the problem and to aid in program design.
You might need quite a lot of time to conceive and draw up a good formal flowchart. Modifying a flowchart to incorporate changes, once a program has been written and its flowchart composed, can prove difficult. Because of these limitations, some programmers shy away from flowcharts, but for others they provide valuable assistance in understanding a program. In order to promote uniformity in flowcharts, standard symbols have been adopted. Figure 2-6 shows the most common ones. In a sophisticated flowchart, you might find them all.
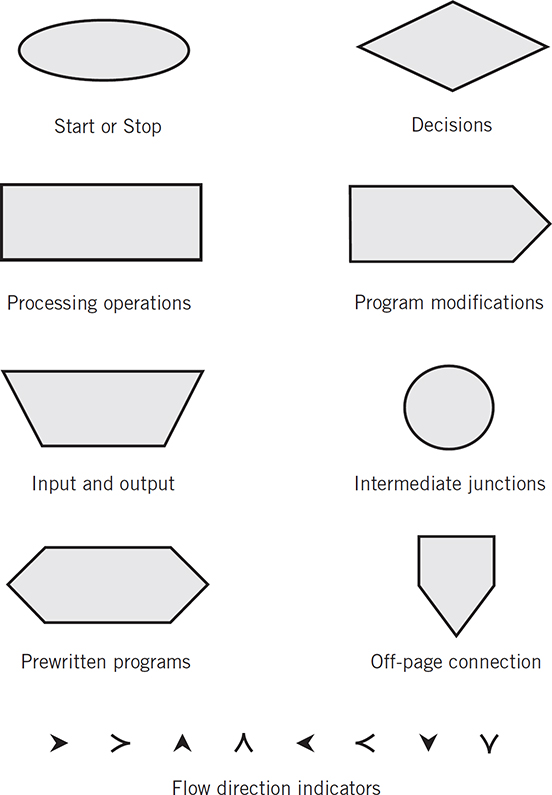
FIG. 2-6 Common symbols for flowcharts intended to represent computer programs.
Ovals show start or stop points. Arithmetic operations go in rectangular boxes. Input and output instructions go in trapezoids. If you want to show a program that someone wrote earlier within the context of a larger flowchart, you don’t necessarily have to draw the flowchart for the entire “subprogram.” Instead, you might represent the entire program as a flattened hexagon. If a box indicates a decision, you use a diamond shape. A five-sided box portrays a part of the program that changes itself. A small circle identifies a processing junction point. Such a point in the program can go to several places. A small five-sided box, which has the shape of the home plate on a baseball field, shows where one page of a flowchart connects to the next, if the entire flowchart has more than one page.
You should label all intermediate junction and off-page connection points with numbers and letters to tell your readers that all like symbols with the same character inside connect together. Arrows indicate the direction of the flow.
Figure 2-7 shows a flowchart for a program that duplicates punched cards, and at the same time prints the data on each card. Let’s trace the flow. The program begins at the “Start” oval at the top and proceeds in the direction of the arrows. According to the text in the trapezoid below “Start,” the program reads a card. Proceeding on down the chart, the program punches the card’s contents (data) as holes in a blank piece of heavy paper and sends the data to a printer. The program then goes back along the dashed line to the top and reads the next card. The circles marked “A” represent inflow and outflow points. In this case they’re superfluous, but in a complicated flowchart they can prove useful when you’d get a mess by including all the applicable dashed lines. The program repeats itself as long as it has cards to read and punch.
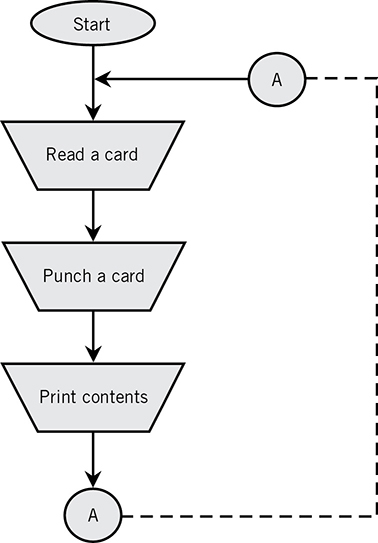
FIG. 2-7 Flowchart that outlines the steps in a program intended to duplicate punched cards. The circles labeled “A” represent inflow and outflow points in the feedback loop shown by the dashed line.
Process Paths
Let’s look some more at Fig. 2-7. Suppose that you want to change the card-punching program so that the computer ignores blank (hole-free) cards and duplicates only those cards that have at least one hole. Because the computer must make a decision about each card, you’ll need to include a decision block in the flowchart. Figure 2-8 shows the result.
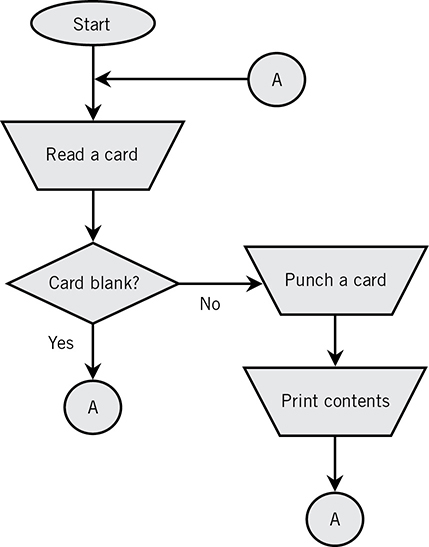
FIG. 2-8 A flowchart with a decision block (diamond). The circles labeled “A” all represent a single junction point through which data moves as shown by the arrows.
Microcomputers use many different types of diagrams that deal mostly with software (operating systems and programs) rather than hardware (physical components). In the computer world, functional block diagrams abound and are usually more numerous than schematic diagrams. From an understanding standpoint, block diagrams can serve to portray machine functions in general, but hardware maintenance and repair procedures require well-defined schematic drawings. Computers take advantage of the latest state-of-the-art developments in electronic components and are relatively simple when you consider all the things they can do. However, from a pure electronics standpoint and as far as schematic diagrams are concerned, computers are immensely complicated. You’d need a lot of pages full of schematics to represent even the most rudimentary computer.
Summary
Block diagrams can help you show and understand how electronic circuits work. They’re comparatively easy to draw, usually requiring only a marking instrument, some paper, and a straight edge (or a vector-graphics computer program and a little bit of training on it). Schematic diagrams, in contrast, need more tools and can, in some cases, take many hours to render in a form that people can read and interpret.