
3
Correlation analysis
What is it?
Correlation analysis is a statistical technique that allows you to determine whether there is a relationship between two separate variables and how strong that relationship may be.
This type of analysis is only appropriate if the data is quantified and represented by a number. It can’t be used for categorical data, such as gender, brands purchased, or colour.
The analysis produces a single number between +1 and −1 that describes the degree of relationship between two variables. If the result is positive then the two variables are positively correlated to each other, i.e. when one is high, the other one tends to be high too. If the result is negative then the two variables are negatively correlated to each other, i.e. when one is high, the other one tends to be low.
So, for example, if (as a hypothetical example) correlation analysis discovered that there was a correlation of +0.73 between height and IQ then the taller someone was the higher the likelihood is that they also have a higher IQ. Conversely, if that correlation was discovered to be −0.64 then the taller someone was the more likely he or she was also to have a low IQ.
A positive score denotes direct correlation whereas a negative score denotes inverse correlation. And zero means there is no correlation between the two variables. The closer the score is towards 1 – either positive or negative – the stronger the correlation is. The result is considered ‘statistically significant’, i.e. important enough to pay attention to if the result is 0.5 or above in either direction.
When do I use it?
Correlation analysis is most useful when you ‘know’ or suspect that there is a relationship between two variables and you would like to test your assumption or hypothesis. For example, you may believe that temperature is affecting sales. An ice-cream seller will definitely sell more ice cream in hot weather but is there a correlation between your product and service and temperature? Correlation analysis would allow you to work that out.
Alternatively you can use correlation analysis when you want to know which of several pairs of variable shows the strongest correlation. So you may want to see whether temperature affects sales more than time of year for example.
And finally you can use this type of analysis speculatively on quantifiable data sets to see what emerges. Sometimes correlation analysis will highlight an unexpected relationship that could warrant further analysis and potential exploitation. For example, Walmart discovered an unexpected relationship between the purchase of Pop-Tarts and a hurricane warning. Apparently when there was a severe weather warning in the US, the sale of Pop-Tarts increased. This knowledge allowed Walmart to position Pop-Tarts at the entrance of the store following a hurricane warning, further pushing up sales. An unexpected correlation was also discovered between beer sales and nappy sales in the United States. Presumably the father sent to buy nappies would be reminded that he wouldn’t be going out this weekend and bought some beer instead. These types of insights can of course be extremely useful and lead to even higher sales with a little in-store product positioning.
What business questions is it helping me to answer?
Essentially, correlation analysis can help you to make connections between quantifiable variables that can help you to make better decisions and improve performance. It can help you to answer:
- Are our most loyal customers also our most profitable?
- Do customers purchase more when the price is lower?
- Does pay influence length of tenure?
- Does number of annual holidays influence absenteeism?
- Is there any relationship between factor X and factor Y?
Correlation analysis can be essential for testing assumptions prior to alterations in strategy or product mix.
How do I use it?
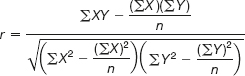
If you are feeling brave and you have a scientific calculator to hand then you can use what is known as ‘Pearson’s correlation coefficient’®.
- First you need to gather your data for the two variables you want to analyse. You can calculate the correlation for any quantifiable data set.
- Create a spreadsheet or table that lists the data sets vertically in columns. In the first column, labelled x, add all the data for your first variable (x) and in the second column, labelled y, add all the data for your second variable (y).
- Label column three, four and five ‘x y’, ‘x x’ and ‘y y’ respectively.
- Perform the relevant calculations in column three, four and five, i.e. ‘x y’ = x multiplied by y, ‘x x’ = x multiplied by x, and ‘y y’ = y multiplied by y.
- Add all the values in each column and add the total at the bottom of each column.
- Insert the numbers into the equation to establish the correlation between the variables under investigation.
Alternatively you can use software and there are many correlation tools on the market.
You can make your life a little easier by using desktop software such as Microsoft Excel that contains pre-installed formulas to calculate your correlations. There are many simple online tutorials available to explain how you use it.
Practical example
Say you wanted to find out whether there was a relationship between the price you charged for your product and the number of units sold at that price. Often the assumption is that the cheaper a product is the more units of that product you are likely to sell, but that hypothesis does not always hold true. Considering how important price and sales are to revenue and growth you decide it’s time to actually establish if that assumption is true or not.
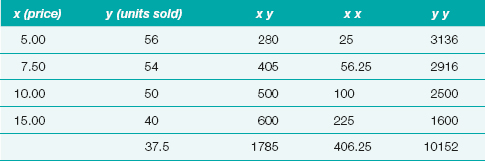
∑xy = (5)(56) + (7.50)(54) + (10)(50) + (15)(40) = 1785
∑x = 5 + 7.50 + 10 + 15 = 37.5
∑y = 56 + 54 + 50 + 40 = 200
∑x2 = 25 + 56.25 + 100 + 225 = 406.25
∑y2 = 3136 + 2916 + 2500 + 1600 = 10152

So:
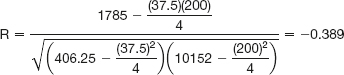
This result indicates that there is no statistically significant correlation between price and unit sold.
Tips and traps
If you already have the data, you might like to try some speculative correlation analysis to see if you can find unexpected relationships or connections that you could exploit for additional sales.
If two variables are correlated that does not imply that one caused the other it simply means there is a relationships between them. Don’t be caught out by assuming causation. Equally, just because two variables are not correlated does not mean they are independent of each other.
Remember, establishing a correlation between two variables is not a sufficient condition to state categorically that there is a causal relationship between the two. A business experiment would help to clarify if a causal relationship does exist.
Further reading and references
Correlation analysis is a basic statistical method that is covered in more detail in most statistics books and websites. See for example:
- Urdan, T. (2010) Good books are Statistics in Plain English, London: Routledge
- Rumsey, D. (2011) Statistics For Dummies, Hoboken, NJ: Wiley Publishing