
8
The Documenting Approach
8.1 Core Ideas
The documenting approach is, so far, the least explicitly discussed in organization and management research, but it is nevertheless commonly used in research on organizations and organizing. It also has a long tradition in visual anthropology and ethnography (Collier & Collier, 1986). Much like the dialogical approach, multimodal artefacts are seen not only as data sources to be interpreted, but also as integral tools in the research process itself. More specifically—and in contrast to the dialogical approach—multimodal artefacts are created by researchers to either enrich data from other sources and enable a more sensually complete capturing of organizational life (see also Kunter & Bell, 2006; Ray & Smith, 2012), to support theory building (Swedberg, 2016), to render interpretations more transparent and facilitate the holistic presentation of results (Czarniawska, 2010), or to present findings, for instance, in the form of models (as has become almost ‘standard’ in articles that develop theory), diagrams (Kvåle, 2016; Ledin & Machin, 2016), photo essays (Jewitt, van Leeuwen, Triggs, & Longford, 2011; Preston & Young, 2000), or non-linear multimedia publications (Goldberg & Hristova, 2007).
What this short overview shows is that multimodality is not only a way of better understanding social and organizational life and its manifold phenomena, but can also help create better science, since modes have specific affordances (see, for instance, Kress, 2010; Meyer et al., 2018). As the documenting approach does not—in contrast to the previous four approaches—provide a specific lens on organizations and organizing, but rather supports the research process, the following sub-section will address three aspects of doing research that may gain from multimodality: (a) data collection, (b) data analysis and theory development, and (c) presentation of findings.
8.2 Aspects of Research
The creation of multimodal artefacts by researchers is already a helpful strategy in the data collection stage of empirical research, especially when ethnographic research designs are pursued. Taking visual images of the research sites, for instance, creates more holistic impressions of the phenomenon under scrutiny and helps researchers record their impressions in a more vivid way than purely verbal field notes may achieve. Further, taking visual field notes in this way helps to later enrich ethnographic studies with additional photo elicitation interviews (see the dialogical approach above). Visual field notes are therefore useful tools for ‘returning’ to the research site in later stages of analysis, and as triggers for conversations with field actors (Buchanan, 1998). Often, it is not easy or even impossible to gain repeated access to certain research sites, and visual notes can remedy this problem. Of course, video ethnography is even richer in its documenting potential. Video provides a richness of information that forces researchers to rigorously select what to focus on during analysis, lest they be overwhelmed by the sheer volume of potential data (Hindmarsh & Llewellyn, 2018; Hassard et al., 2018). Another word of caution is also in order. Although it may seem that photographs and videos from the research site provide neutral, objective, and complete ‘souvenirs’ for later reuse in the research project, researchers must not forget that these artefacts are always incomplete in that they provide only certain perspectives, frozen in space and time. A photograph always misses more than it shows, and videos are taken from a particular angle, with a focus on particular events. Focusing on what has been recorded during the research visit therefore reifies earlier impressions and may lead to losing information that researchers experienced during the ethnography but did not record on photograph or film. It is therefore advisable to combine field notes using different modes.
Whereas the use of multimodal artefacts in data collection is comparably well documented, and there are some guidelines for good scientific conduct, the use of visual and multimodal ‘crutches’ for data analysis and theory development are much less discussed. Multimodal artefacts, particularly visual and material ones, may support the interpretation of data in that they make preliminary findings tangible and materialize them in a way that facilitates both material permanence and malleability. In the simplest way, drawing research or theory sketches (Swedberg, 2016) to record early ideas helps communicate these ideas to co-authors in a way that is not yet immutable, but has a certain permanence. Collier (2001), in an excellent paper on photo elicitation, advocates the use of ‘photomaps’, mounting a large number of photos of, for instance, an urban neighbour-hood, on a board in systematic ways, so as to discover patterns, both through ‘rapid open viewing’ and through structured analysis. He also advocates team analysis which allows for “comparing views and linking them to identifiable phenomena in the visual records” (Collier, 2001, p. 54). Visual text is also much better able to capture spatial properties of ideas, which helps to communicate and materialize relational properties of different parts of data, or of different elements of an emerging theory. Simple ways of materializing data (e.g., printing preliminary categories and cutting them into rearrangeable bits) help to constantly ‘play around’ with different avenues of clustering and interpreting findings (see also Ravasi, 2017). Of course, the digitalization of data opens up vast potential, too. Mind-mapping techniques can be used digitally as well as analogically and are quite frequently used in actual research practice. A rather novel way of using visuals in ethnographic research is suggested by Stowell and Warren (2018), who utilize their visual field notes to conduct photo interviews with the researcher conducting the participative ethnography. This allows for auto-ethnographic theming, which is then used to sensitize the researchers towards the embodied experiences of field actors.
Finally, multimodality is also an excellent resource for improving the presentation of findings to audiences. Different graphs and diagrams as ways of stressing the conceptual and analytical aspects of data (Kress & van Leeuwen, 2006, see also the chapter on diagrams in this volume, Chapter 11) are commonly used throughout the sciences. Lately, some researchers have utilized photography to provide audiences with more direct and holistic access to their data (see, for instance, Czarniawska, 2010). Some academic journals (most notably the Academy of Management Discoveries) are experimenting with novel ways of writing research articles, including the option to include video. The use of multimodal artefacts to communicate research findings and interpretation procedures is an excellent way to make analyses and findings more transparent to audiences, which increases the quality and impact of research. However, some challenges need to be considered. First, privacy regulations and copyright laws may be a serious hindrance to making visual data available (Bell & Davison, 2013; Meyer et al., 2013). Researchers are well advised to clarify early on which opportunities exist to print and publish visual material from their study. Second, the same limitations as regarding the use of multimodal artefacts for data collection also apply to data presentation. Whereas visuals and video are seemingly more ‘objective’ than verbal descriptions of researchers, such impression is misleading. Visuals also afford rhetorical usage to stress aspects of the data that fit the desired narrative. Transparency regarding the process according to which visuals were selected to illustrate findings is therefore paramount from an ethical perspective.
8.3 Exemplary Studies
There is a relative paucity of research in organization and management studies that openly accounts for the use of multimodal artefacts to document research. An often referred to example for research in this tradition is the study of Buchanan (1998). In this study, the author reconstructs the patient trail in a hospital, beginning with the referral to a specialist and continuing through the stages of admission, treatment, and discharge. The aim of the study is to achieve a systematic process mapping of what is happening on this patient trail. To do so, Buchanan (1998) applies a multi-method ethnography, which combines document analysis with prolonged periods of intensive observation, ‘mystery shopping’, as well as open-ended interviews. The study is of particular interest for illustrating the documenting approach, since the author collected a variety of verbal as well as visual data. Visual data consisted primarily of approximately 150 photographs that document different stages in the whole process. Apart from using these photographs as visual field notes, Buchanan (1998) also later employed them in photo elicitation sessions, which meant that various staff groups were confronted with researcher-taken photographs in the open-ended interviews. As a complement to his empirical article, Buchanan (2001) provides a methodological manuscript in which he elaborates and reflects extensively on the use of visual methods. He suggests that the use of visual artefacts enabled richer conversations with field actors (which relates to work in the dialogical tradition), but also allowed for deeper insights into organizational processes, as the photographs taken during the study helped capture richer details of the research setting than verbal field notes would have afforded. He also contends that these photographs revealed insights that did not emerge from the oral interviews, and therefore allowed for confronting field actors with aspects of organizational processes that they themselves were not personally involved in. In addition to capturing and preserving information for the researcher, the photo material, accordingly, was also employed to create additional transparency about the processes for the participants in the study.
Researcher-taken photographs play a slightly different role in Czar-niawska’s (2010) study of an urban recovery program. Here, the author aims at following the ‘chains of translations’ from a political decision to their actual unfolding in the city, which she finds to be difficult due to different factors making accounts less transparent. To do so, Czarniawska (2010, p. 420) conceptualizes city management as an “action net”—that is, “a set of actions accomplished within a seamless web of inter-organizational networks, wherein city authorities constitute just one point of entry and by no means provide a map of the whole terrain”. Of particular interest for the documenting approach is her decision to present a narrative in form of a photo-reportage alongside her analysis and findings. This photo-reportage, in essence, constitutes a parallel narrative that illustrates parts of the study in vivid imagery, for instance, a board explaining proper behaviour on a bicycle–pedestrian track that has been vandalized by multiple layers of graffiti, or a photograph of a specific part of this track where fences preventing reeds from overgrowing were supposed to be placed. In her discussion, Czarniawska (2010) explains that she sees visual accounts such as her own photo-reportage as one possible way in which researchers can act as ‘translators’. She calls for the research community to become multilingual and abandon their specialized discourse, which she sees as a prerequisite for making multiple communities speak to each other.
Unlike photography, video not only allows the visual recording of real-time processes, but it also records sound. In his studies of the passing on of information about patients during shift changes in the emergency departments of large hospitals, Iedema (2015) uses a ‘video-reflexive’ method in which the research problem is first collaboratively determined by the researcher and the participating clinicians. The clinicians’ work practices are then recorded on video, and the researcher asks the participants for ‘hot feedback’ immediately after the recording. Next, the videos are analysed, and the analysis is presented to the participants in the form of clips of up to 4 minutes, showing, for instance, moments of vagueness or omission. These clips are then discussed with the participants who often develop proposals for change during these discussions. Video is therefore used at different stages of the process, for data collection as well as for presenting the analysis to the participants. This, Iedema stresses, makes the analysis more vivid and accessible than is the case with the way researchers usually frame and present their data, and results in a “less predictable and more exciting research process” that “opens research up for different views and expectations” (Iedema, 2015, p. 196).
8.4 Implications of Different Modes for Documenting Research
The potentials for different modes in the documenting approach are closely tied to their different ways of meaning-making and meaning representation (Kress, 2010; Kress & van Leeuwen, 2001). Meyer et al. (2018) disentangle such potential of the verbal and visual mode by suggesting that texts drawing from the two modes provide distinct affordances in the sense of potentials for meaning construction that need to be realized between producers and consumers of texts in particular social situations. The core of such a perspective is that different problems require the use of different modes, depending on the potentials the modes offer. We wish to illustrate the power of the visual mode for both data analysis and the presentation of findings on the basis of a recent research project that one of the authors was personally involved in (Jancsary, 2013).
In this study, the author was interested in the latent understandings of ‘leadership’ as manifested in written leadership principles of companies. Whereas the study analysed purely verbal text, multimodality nevertheless featured heavily during data analysis and presentation of findings. Methodologically, the author was interested in the implicit (and often incomplete) arguments behind specific statements about leader–employee relationships. As an intermediary step, leader and employee roles were reconstructed based on the actions that leaders and employees were supposed to perform. To support the classification of actions into roles and further connect typical actions into specific forms of leader-employee relationships, the author created print-outs of subject–verb–object relations on pieces of paper that he could physically rearrange (see Figure 8.1a). This facilitated the interpretation and discussion of the data in a team (two
Table 8.1 Selection of Further Readings (Documenting Approach)
| Article (in Alphabetical Order) | Brief Description |
|
| |
| Powell, W. W., Oberg, A., Korff, V., Oelberger, K., & Kloos, K. (2017). Institutional analysis in a digital era: Mechanisms and methods to understand emerging fields. In: G. Kriicken, C. Mazza, R. Meyer, & P. Walgenbach (Eds.). New themes in institutional analysis (pp. 305-344). Cheltenham, UK & Northamption, MA, Edward Elgar. | The article is a good example of how visualization can offer richer and novel ways of presenting complex data and findings. The authors suggest circular network graphs to visualize mechanisms of field emergence based on relational features of the world wide web. |
| Ravasi, D. (2017). Visualizing our way through theory building. journal of Management Inquiry, 26(2), 240-243. | This essay offers a pointed reflection on the potential of visualization techniques in doing research, especially on how visualization can strengthen the analysis of qualitative data. |
| Rowley-Jolivet, E. (2004). Different visions, different visuals: A social semiotic analysis of field-specific visual composition in scientific conference presentations. Visual communication, 3(2), 145-175. | Based on an analysis of conference presentations, the study inquires how visual resources create cohesion, logical relations, discourse structure and rhetorical claims. The author shows that different disciplines exploit such resources in distinct ways. |
| Swedberg, R. (2016). Can you visualize theory? On the use of visual thinking in theory pictures, theorizing diagrams, and visual sketches. Sociological Theory, 34(3), 250-275. | Although not directly related to organization research, this article provides interesting insights into how visualizations like theory pictures, diagrams, and sketches may improve theory crafting through visual thinking. The author suggests that this may require the development of new visual conventions. |
| Toraldo, M. L., Islam, G., & Mangia, G. (2018). Modes of knowing: Video research and the problem of elusive knowledges. Organizational Research Methods, 21(2), 438-465. | Starting from the main argument that video-based methodologies offer unique potential for multimodal organization research, the authors discuss how video may be able to capture and translate embodied, tacit and aesthetic knowledge (what they call ‘elusive’ knowledges) into discursive and textual forms. |
people not involved in the research project joined for interpretation). The material properties of the print-outs allowed for shifting them back and forth according to emerging conceptual explanations, and photographs were taken whenever critical decisions were made, to enable a return to previous stages if needed. Photographs were then imported into an image-editing software, where the emerging interpretations were extended, and overlaps between types could be visualized in the style of Venn diagrams (see Figure 8.1b). Eventually, topoi and relationship types were plotted into a network-like diagram in PowerPoint and used to ‘map’ the different elements in relationship to each other (for the first draft of the map, see Figure 8.1c). The final plot was both a tool for data analysis as well as the presentation of findings, since the visualization of the network afforded a spatial representation of the data structure that facilitated the communication of the central findings to the readers. It was the specific affordance of the visual mode to present information in a spatial and relational way (Kress & van Leeuwen, 2006; Meyer et al., 2018) that made it attractive as a resource for this specific research project.
The distinct advantages of presenting research findings multimodally are discussed by Jakubowicz and van Leeuwen (2010) through a comparison between a traditional article and a non-linear online publication on the same issue (Hurricane Katrina) by the same author (David Theo Goldberg, an American sociologist). The multimodality afforded by online publishing not only adds an affective dimension, but also strengthens the presentation and analysis of the data. To start with the affective dimension, as Katrina is introduced, readers/viewers hear the sound of violently whooshing water and see a dramatic darkening of the screen. Later, African-American music underscores the plight of the black population of New Orleans. But digital publication can also combine incisive argument with much more extensive and detailed archival and documentary evidence than can be included in traditional linear texts, which often have to argue their point on the basis of much more selective and restrictive sets of examples. It can simultaneously provide a foreground and a background, for instance to ensure that a given argument is read against the background of a specific historical, political or social context. And it can make use of typography to provide elements of a text with specific textual identities, such as ‘main argument’ or ‘supplementary material’, and mark the modality of textual elements as, for instance, a piece of political activism (through typography reminiscent of handset activist leaflets) or as piece of historical evidence (sepia).
8.5 Specific Challenges and Opportunities Regarding Multimodality
Video is arguably the most clearly multimodal artefact that can facilitate and support research in a documenting approach, at least in terms of data collection and partially also data presentation, provided the format of publication supports it. Lately, there has been a renewed interest in the use
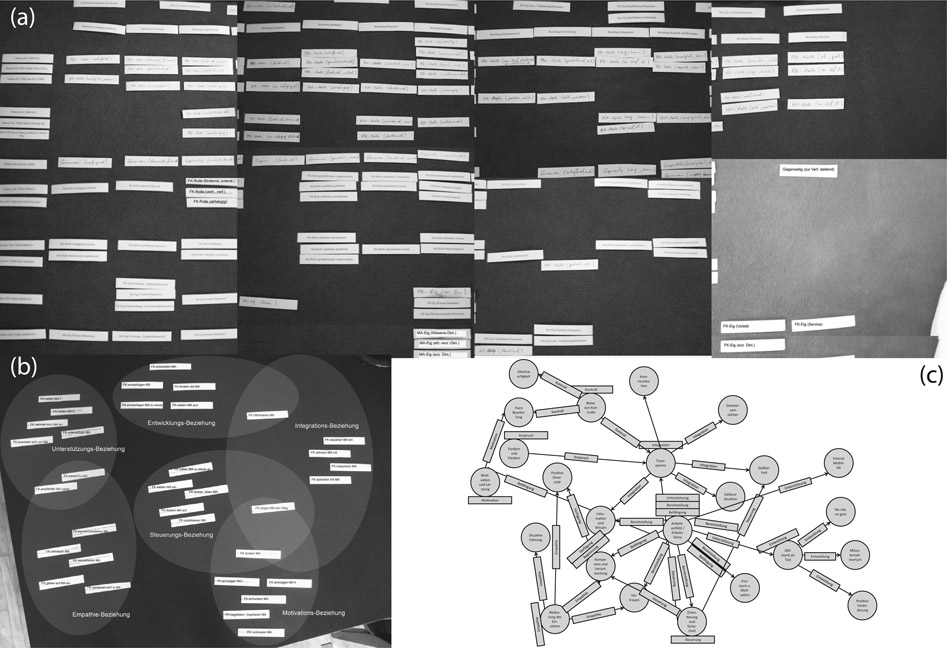
Figure 8.1 Illustration of Multimodal Support in the Research Process: (a) Arranging Print-Outs on the Floor; (b) Enhancing Photographs Through Software; (c) Creating a Conceptual Map
and potential of video and video analysis in organization research (see, for instance, the recent special issue on video in Organizational Research Methods in 2018). Christianson (2018) provides a literature review of articles published in top-tier organizational journals focused on publications where video was central to the research design. He finds a strong upward trend in the use of video over the years, including the following categories: video as detailed and permanent record, video as a way for examining non-verbal behaviours, video as a way for studying the temporal aspects of interaction, and video as a way of studying multimodality. All of these topics pertain to the documenting approach as outlined here.
The advantages of video for capturing organizational reality are manifold. Toraldo et al. (2018), for instance, outline that video allows for integrating what they call ‘elusive knowledges’, that is, tacit, aesthetic, and embodied aspects of organizational life. Iedema (2015) makes a similar point when he says that video reveals “facets of practice of which practitioners and patients themselves were not necessarily aware, or no longer consciously aware” (Iedema, 2015, p. 198). Hindmarsh and Llewellyn (2018) add that video recordings capture a ‘bewildering’ amount of detail. Congdon, Novack, and Goldin-Meadow (2018) particularly stress the ability of video documentation to capture small gestures, information that is often ignored in experimental research. In essence, this means that video documentation would also be a helpful complement to research in the strategic tradition (see above). However, there are also some voices arguing caution. Mengis, Nicolini, and Gorli (2018) show how video recording practices construct their subject matter in a particular way and are therefore far from being neutral ways of capturing reality. They illustrate how different views and angles in the recording of video privilege different understandings of space by directing the viewers’ gaze. Additionally, Whiting, Symon, Roby, and Chamakiotis (2018) remind us that video research implies particular subject positions for researchers and participants and that these often involve tension and paradox.
However, even video cannot capture the complete multimodal experience of ‘being in’ a certain place at a certain time. As Becker and Burke (2012) remind us, researchers in the field are exposed to a plethora of sensory impressions, not all of which are consciously perceived. Scent, for instance, is a particularly subtle and ephemeral mode, and researchers could strive to find ways of preserving the smell of particular field locations. Materiality, as well, is only incompletely retained in video data: Only its visual aspects are captured, but not the feel of texture, or, for instance, the weight and stability of artefacts—all of which may play important roles in the field. Additionally, insights on the role of sound need to be extended, encompassing both a closer focus on ambient noise in the field (as there is never truly a complete absence of sound anywhere) and the potential of sound and music as facilitators of data interpretation and theory generation. So far, we have barely scratched the surface of how multimodality can support researchers in their work.