
Logging Visualization in FINAL FANTASY XV
Data analytics have had a variety of uses in the gaming industry, most commonly in online games and the mobile market. However, in the development of FINAL FANTASY XV, an action style Role Playing Game (RPG), we have found an additional use for data logging combined with visualization. One challenge we face with a large team, measuring in the hundreds working across the globe, is ensuring quality game data. In an ideal scenario, the game’s design and tools would be well defined, and accurate data would be ensured at the time of authoring. However, games often have changing requirements, new features, and new fun and exciting ideas introduced during the development process. These aspects can make it difficult to know precise boundaries of still-developing areas of a game. Nevertheless, ensuring quality game data is still an important problem that all teams address with varying techniques. Furthermore as the project scale continues to grow, additional quality assurance challenges are introduced.
We address these issues in FINAL FANTASY XV through a comprehensive logging and data analysis toolset. We log various aspects of the game in a database and use a web-based front end for analysis. This enables us to investigate movement issues, monitor event distributions in both time and space, and observe changes in the navigation mesh over time. Conceptually, our approach enables similar analysis options as done by Thorzen for The Witcher 3 (Thorzen 2015). However, Thorzen directly populated a database with content information in order to find problematic data, while we are logging gameplay information to a database and analyzing that data.
In this chapter, we will describe the architecture we used and the reasons behind the choices we made, will look at the three main uses of our tool, and will discuss some of the future work we plan. By leveraging data visualization, we found that identifying potential issues, even in large worlds with lots of data, was easy and convenient for designers and developers. Additionally, the logging system was not intrusive and had no adverse effects to the gameplay experience and provided meaningful insight to our team.
The architecture for this system was influenced by two main goals: (1) minimize impact on game performance at all costs and (2) allow both designers and developers capabilities to analyze the data via web browser. Since we log a lot of data, effectively searching through it is important. Conveniently, these goals can be achieved with off-the-shelf database and web technologies. Our implementation employs MongoDB as our database and NodeJS as our web server. These meet the requirements while also allowing substantial flexibility during the development of our visualization tool (MongoDB 2016, NodeJS 2016).
3.2.1 Logging
In order to minimize the logging’s impact on performance, it needed to be fast and nonblocking. A logging system that affects frame rate or causes gameplay issues is more harmful than it is helpful. We implemented a nonintrusive logging system by doing most of the heavy computation via a process that can run on a different computer, which is important when playtesting on a console. In our case, the theoretical maximum bandwidth was 80 Mbps, which is a data volume limitation, but all the data described in this chapter did not reach this limit.
In Figure 3.1, there are three main components. The game and application logger make up the first component, which executes on the gaming console. The next component is the log aggregator, which we will cover momentarily. The final component is the client side view, for which we support a couple of options.
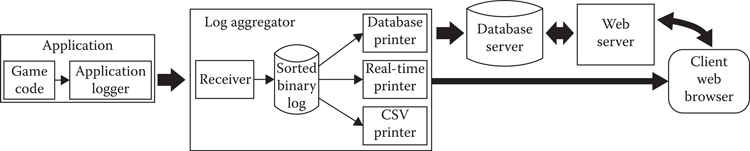
Figure 3.1
Data flow from game to web browser visualization.
We will come back to Figure 3.1, but for now let us focus on the logging system, which is compiled into the game’s runtime. As the player experiences the game, a variety of different events contain log statements that save data to the logging system. Figure 3.2 shows the logging system’s architecture. A single log entry can be arbitrarily complex and is composed of multiple elementary data chunks described in Table 3.1. Each chunk in the same log entry shares the same context ID, which is generated by atomic increment. Figure 3.2 shows two log entries, comprised of nine total chunks. As an example, when a player takes damage or an NPC activates a script, the system generates a context ID for that event and tags the relevant data chunks in the log. Since these events can happen simultaneously, the log system executes on multiple threads and writes to a double buffer. When a buffer fills, it is swapped out and sent to the sentinel. The sentinel accumulates data and adaptively sends it to the log aggregator over TCP/IP. The sentinel adapts to the rate of data commits to the aggregator, which is a function of how much data are coming in from the buffer. Based on the data-logging rate, the sentinel will send data between once per second to ten times per second. Furthermore, the sentinel also sends its own statistics to the log aggregator, so that system can also be monitored and tuned for performance.
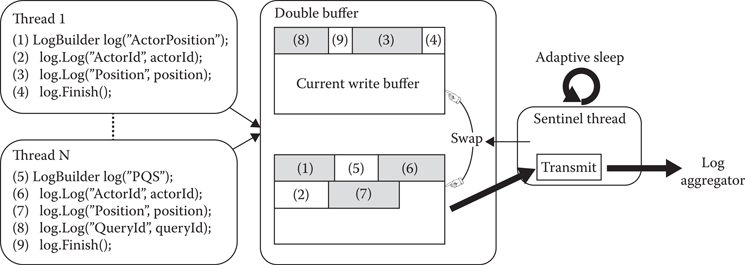
Figure 3.2
Logging library implementation pipeline shows multithreaded logging process.
Table 3.1 Elementary Data Chunk for Logging
Context Id | Unique Id for one log |
Action Id | Identify the chunk role |
Name Id | String to identify the data inside the database |
Type Id | Type of the binary data |
Data | Array of the binary data |
Writing a chunk is a three-step process:
1. Reserve: Increase the number of users of the buffer, and reserve the memory needed for writing the whole chunk. This is normally a nonlocking function because it only increments the buffer’s atomic variables. If there is not enough memory, then we have to block until the next buffer swap.
2. Write: Save the data.
3. Finish: Reduce the number of users of the buffer. The sentinel will wait until the buffer is unused before sending the data via TCP/IP.
The sentinel is working on its own thread and regularly wakes up to swap the buffer and send the logged data to the log aggregator via TPC/IP. The update frequency varies based on the rate of data sent. What is more, the statistics of this adaptive sleep are also logged and can be used to further tune the algorithm.
3.2.2 The Log Aggregator
Returning to Figure 3.1, the next component is the log aggregator. Since the logging system receives chunks for different log entries from multiple threads, essentially nothing is in a desirable order. The log aggregator’s role is to fix this issue so that data are easier to store, manipulate, visualize, and understand. The aggregator performs another important task, which is offloading parts of the processing done by the runtime in order to minimize performance impact. Once the chunks are ordered per log entry, they can be used by one of the several printers.
We currently have three different printers:
• The CSV printer: Parses binary data to a CSV file. Useful for debugging or local tests.
• The database printer: The most useful of the three, it stores data inside a global database. It parses the binary to JSON and makes it ready for later analysis. This printer also has a local buffer, which is used to reduce network congestion on the database server.
• The real-time printer: Similar to the database printer since its output format is identical (JSON), uses a different protocol, based on web server push notification technology (i.e., “web socket”). This printer provides streaming data, which provides nearly real-time updates on the client web browser. With this printer, we are able to display the player and enemies on a 2D map while playing the game, which is useful for analyzing and tuning the AI.
3.2.3 The Data Format
Although the logging system allows an arbitrarily complex log, we still need to be able to analyze it. Consequently, we defined several standard log headers. A log header is generated with a class wrapper around the data, which will generate the common elements.
One of these shared data formats is the session header. The session identifies a game play experience. Each session is stored in a different database collection. The session header is explained in Table 3.2 and allows filtering for which data collection will be used for further analysis. For example, if a developer was interested in looking at data generated from a specific tester at a specific time that a particular artifact occurred, then they can more easily investigate the parameters logged around that issue.
In addition, all logs share a common header with the game time, a position (used for spatial analysis), and the corresponding agent Id. These common headers offer format consistency for the front-end methods.
Table 3.2 Common Headers Used for Logging Sessions
Machine name | (Computer Machine ID–physical hardware) |
Session Id | Unique ID for this execution of the game |
User | (Windows login of user) |
Start time | Time stamp of session play starting |
Binary name | Vs–Solution name |
Binary version | Change list number from Versioning Software |
Configuration | (Visual studio Build Configuration–Release/Debug/etc.) |
Platform | PS4, Xbox, PC |
3.2.4 Data Analysis
Data analysis is done through the database printer and accessed through a web front end written in JavaScript. A separate front end interacts directly with the log aggregator for real-time updates via the real-time printer. Accessing the database is a two-step process: first determine the sessions that are to be analyzed, then retrieve the data you are interested in and aggregate the session results.
Our visualization toolset supports a variety of visualizations, which can be split into two broad categories: spatial analysis and statistical analysis. Spatial analysis visualizations project the data on a 2D map via Leaflet and provides a Google map-like user experience for exploring spatial data in the world of FINAL FANTASY XV (Leaflet 2016). Statistical analysis uses more traditional visualization techniques, such as bar charts and histograms, to allow us to investigate nonspatial characteristics in our data, for example, temporal distributions of particular events.
Different views were developed for displaying event information, which we were interested in tracking. The web client was implemented in JavaScript and data-driven documents (D3) (D3 2016). The first view we made available is a histogram of data gathered from our point querying system described in later chapters of this book. The team was interested in tracking the amount of use the system had and in which sections of the game. Figure 3.3 shows the different play sessions logged on the left-hand side, with the corresponding histogram on the right. In this example session, we can see that the Ambient Spawn Query, a query responsible for spawning NPCs, is occurring nearly 700 times during this play session. In this example, it is easy to recognize the effects of entering a large town with a high number of agents being spawned into the scene. This type of visualization makes it convenient to recognize potential bugs related to our point querying system.
We developed a separate view for monitoring the distribution of executed character dialogues. When certain events happen in the game, one of many dialogue events can be triggered, and these events are separated into groups. In Figure 3.4, we see six different dialogue groups, each with multiple dialogues. By presenting this information in a bar chart ordered by group and frequency, we can easily monitor potential issues that may exist in our dialogue system. With this grouped histogram view, it is easy to see that one script in our first group occurs more often than intended, and the parameters for that script may need review. Visualization makes identifying these cases easy and convenient for designers and developers.
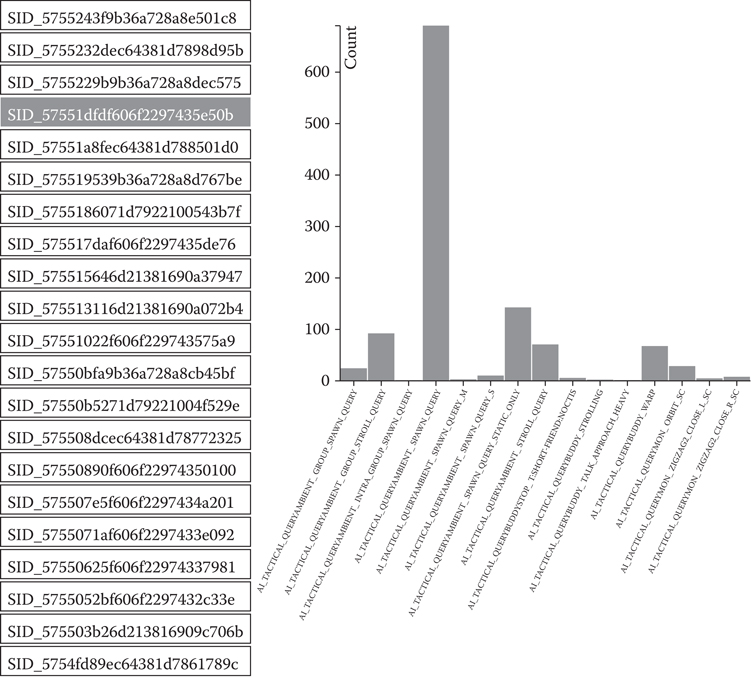
Figure 3.3
A histogram of our point querying system logging all queries and their frequencies.
The statistical analyses are interesting, but the 2D map is arguably the more exciting use of this system. We used Leaflet, an open-source JavaScript map library to create an interactive 2D map of the FINAL FANTASY XV world. The library supports features like drawing points, adding tool tips, displaying heat maps, and zoom levels. The range of possibilities is large, and we continue to find new uses.
The first step is to load the appropriate data into Leaflet in order to create our 2D map. The basic process is to generate a series of top–down orthographic camera screen shots. The camera moves along a grid and captures the necessary images. Next, high-level zoom images are generated by downscaling and merging those screen shots. By performing this process, we enable mouse-wheel zoom on the world through a web browser. Once the data loads, we can begin exploring the world.
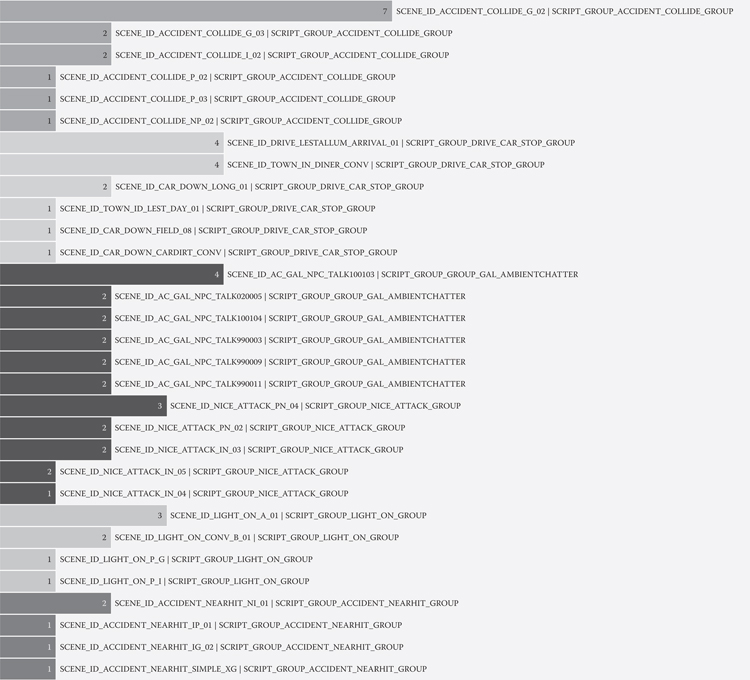
Figure 3.4
A grouped histogram view showing one script executing more often than intended.
3.4.1 Two-Dimensional Navigation Mesh Map
Any type of screenshot could be used in this process, but rather than using game screenshots, we used images of the game’s navigation mesh. This provided us with several benefits. First, for quality assurance purposes when our navigation mesh data are being built, we were also generating the 2D map screenshots. In addition to this, the process is automatic, making it convenient to use. Next, by using the navigation mesh, we can ignore geometry that may obstruct a top–down view, such as trees or buildings. Finally, the navigation mesh covers all the areas in which NPCs and the player can travel allowing us to focus on areas that are contained in the game play portions of the world. We export not one but several maps at the same time, shown in Figure 3.5.
In Figure 3.5, there are six different uses of the leaflet visualization. These are: (a) connectivity mesh, (b) large monster navigation mesh, (c) nonfiltered mesh, (d) filtered navigation mesh, (e) difference image, and (f) zoomed in section of map shown in (d). We will handle them out of order, starting with the nonfiltered map.
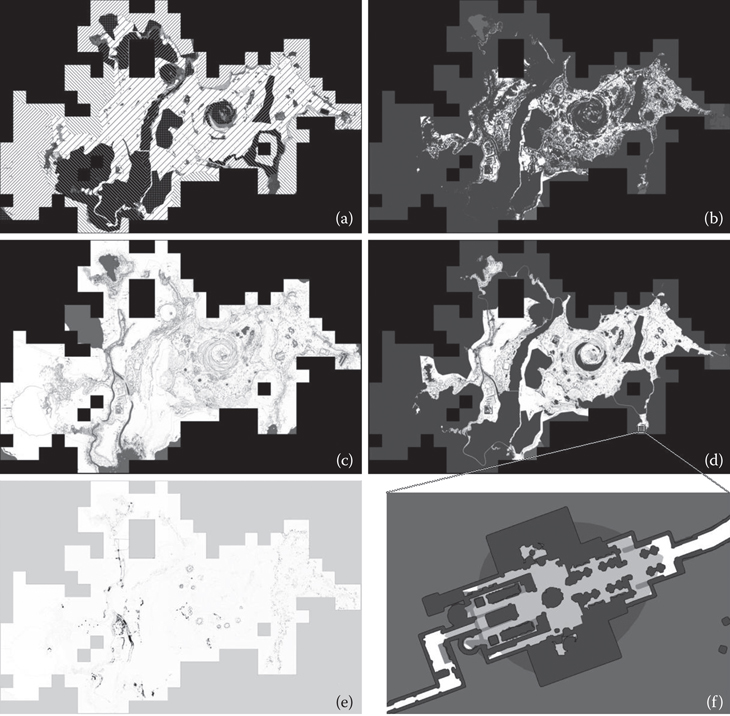
Figure 3.5
Leaflet map visualization of the navigation mesh of the FINAL FANTASY XV world. (a) connectivity mesh, (b) large monster navigation mesh, (c) nonfiltered mesh, (d) filtered navigation mesh, (e) difference image, and (f) zoomed in section of map shown in (d).
3.4.1.1 Nonfiltered Mesh
Figure 3.5c shows the whole set of auto-generated navigation meshes. In the live tool, the map’s colors have meaning, which represent polygon flags such as water for sea monsters or ceiling heights for flying creatures. The other figures show subsets of this set.
3.4.1.2 Connectivity Mesh
Figure 3.5a shows the navigation mesh’s walking connectivity. For adjacent regions with differing patterns in the image, it means agents are incapable of path planning between them because the regions are not connected. In the web tool, these regions are depicted with differing colors. This allows us to quickly check for invisible walls or unintentional holes in the mesh. We can also confirm whether an agent should be able to walk between two points or not. Navigation mesh generation is an automated process, based on a variety of rules (angle of a slope, step-height of a character, etc.). Depending on how the world is edited, otherwise-connected regions can become disconnected and vice versa. This tool lets us confirm mesh accuracy as the world map evolves.
3.4.1.3 Filtered Meshes
The generated mesh has navigation mesh above the sea, over roof tops, and even inside big rocks, anywhere it is possible to for an agent to stand. To avoid this, a common solution is to use a seed point. Only areas connected to the seed point will be kept. By using the walk connectivity shown in Figure 3.5a, we can generate Figure 3.5d, which is the filtered mesh that is used in the game for humanoid characters.
Figure 3.5b is similar to Figure 3.5d but with a different archetype. It is really useful to be able to check the map for the different archetypes. Different characters have different sizes, different step heights, and so on, and so Figure 3.5d is the navigation mesh, which is available for humans. Figure 3.5b on the other hand is for large creatures, namely the Behemoth. The Behemoth is one of FINAL FANTASY XV’s largest creatures, and it requires a lot of space in order to walk about, making its navigable area smaller than a human’s. The white area in these images is where agents, whether human or behemoth, can go.
3.4.1.4 Difference Image
Lastly, Figure 3.5e is a difference map showing the difference between two subsequent versions of the world’s navigation mesh. White regions in this image are the same as previous versions. Dark areas are places where changes occurred. This allows designers and developers to monitor changes over time, which can make it easy to confirm errors when AI behavior suddenly or unexpectedly changes in one area of the map.
Figure 3.5f depicts a zoomed version of a small region shown in the bottom of 3.5d, the interior of a large building.
3.4.2 Heat Map Visualization
Heat maps are an effective and convenient method for displaying density information over a 2D map. One example of heat map use was tracking the player’s position to monitor map coverage by the quality assurance team. Here, however, we describe an interesting feature related to data packaging.
In FINAL FANTASY XV, we have numerous animations and data variations depending on a character’s age, culture, and other characteristics. As we cannot load all possible animations into memory, we must know which ones to preload and where. We used the log data to display a heat map of animation IDs. This allowed designers to check for inconsistencies and rarely used animations, which helped to package animations into the relevant areas. Figure 3.6 shows an example of such a heat map.
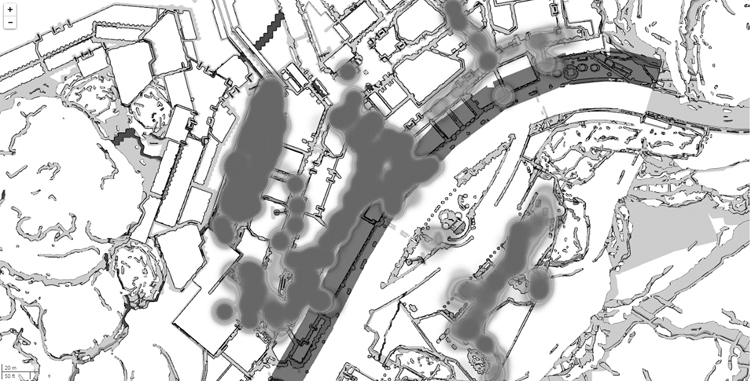
Figure 3.6
Heat map visualization of events being executed by NPCs in a small town.
Interactive visualization techniques like the ones described here have improved the efficiency of developing large-scale video games. A number of characteristics from the game are collected and analyzed during the development process, which has made debugging and investigation of data issues more efficient. Map tools, like Leaflet, also enable us to monitor spatial issues that might arise in the game. These types of tools are particularly exciting because their future potential is just starting to be explored.
Data Driven Documents [Computer Software]. (2016). Retrieved from https://d3js.org/
Leaflet [Computer Software]. (2016). Retrieved from https://leafletjs.com/
MongoDB [Computer Software]. (2016). Retrieved from https://www.mongodb.com
NodeJS [Computer Software]. (2016). Retrieved from https://nodejs.org/en/
Thorzen, M. (2015). Content optimization pipeline for an open world game, GDC 2015.