2
CLARIFYING AND MEASURING
HR’S STRATEGIC INFLUENCE
Introduction to a Seven-Step Process
It was exciting stuff. We could see how employee attitudes drove not just customer service but also turnover and the likelihood that employees would recommend Sears and its merchandise to friends, family, and customers. We discovered that an employee’s ability to see the connection between his or her work and the company’s strategic objectives was a driver of positive behavior. … We were also able to establish fairly precise statistical relationships. We began to see exactly how a change in training or business literacy affected revenues.
ANTHONY J. RUCCI, STEVEN P. KIRN,
AND RICHARD T. QUINN
1
THIS QUOTATION CAPTURES the energy that can be created when an organization aligns its HR architecture with its larger plan for strategy implementation—and devises a way to measure that alignment. If we take a closer look at Sears’ transformational experience, we can see that the company’s effort centered on telling the “story” of how value is created within the organization. Specifically, Sears executives clarified how their employees drive customer satisfaction and how that satisfaction, in turn, fuels overall firm performance. They then reinforced the story by involving a broad cross-section of senior managers, providing developmental opportunities for those supervisors who lacked the leadership skills needed to implement the new strategy, and realigning the HR system to support the strategy.
Equally important, they designed a measurement system that let them test their hypotheses about how employee behaviors, customer satisfaction, and financial performance are all linked. In other words, Sears moved beyond the hypothetical and devised ways to demonstrate objectively HR’s contribution to implementation of the company’s new strategy. Human resource managers could now cite hard evidence that “a 5-point improvement in employee attitudes will drive a 1.3-point improvement in customer satisfaction, which in turn will drive a .5% improvement in revenue growth.”2
BALANCED PERFORMANCE MEASUREMENT
To achieve the kind of strategy alignment that Sears accomplished, a company must engage in a two-step process. First, managers have to understand fully the “story” of how value is created in their firm. Once they achieve this understanding, they can then design a measurement system based on that story. We can think of this process in terms of two general questions:
First, how should strategy be implemented in our firm? This is another way of asking how the firm generates value. Asking this question focuses the organization on two dimensions of the strategy implementation story:
Breadth: The company must attend to more than financials, which are just the outcomes of strategy implementation. To truly grasp the value-creation story, the organization must also focus on performance drivers (such as customer loyalty) that it has identified as “key success factors.”
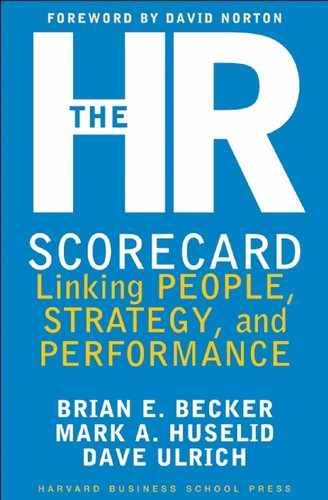
Causal flow: This is the series of linkages among financial and nonfinancial determinants of firm performance. All managers need to have an understanding of this flow (though most lack it). A comprehension of causal flow pushes managers to think beyond the financials and appreciate the importance of other kinds of success indicators. It’s not enough just to have a list of important nonfinancial measures of success. Managers also need to understand and incorporate the “causal logic” that gives these nonfinancials value in the organization. Figure 2-1 shows the kind of basic framework that a firm can conceptualize by asking itself how strategy should be implemented.
Second, what performance measures capture this broadly defined strategy implementation process? This question encourages managers to attach metrics to the conceptual foundation that they envisioned after understanding their firm’s value-creation story.
Once high-level managers have addressed these two questions, they must then communicate it to middle managers and front-line employees. That way, every member of the organization knows how to support the firm’s success. These questions also help the organization decide how to allocate resources so as to breathe life into the value-creation story. Finally, and most important, the insights generated by the questions guide the decisions that every employee makes, every day.
Figure 2-1 A Simple Illustration of Value Creation
Source: Robert S. Kaplan and David P. Norton, (Boston, MA: Harvard Business School Press, 1996), 31.
Balanced performance-measurement models, such as the one we present in this book, pull the answers to these two questions together in a powerful assessment tool. The model recognizes the importance of both intangible and tangible assets, and of financial and nonfinancial measures. It also acknowledges the complex, value-generating connections among the firm’s customers, operations, employees, and technology,3 and integrates HR’s role in an unprecedented way. Finally, the model highlights the important distinction between lagging and leading indicators. Lagging indicators, such as financial metrics, typically reflect only what has happened in the past. Such metrics may accurately measure the impact of prior decisions, but they won’t help you to make today’s decisions, nor do they guarantee future outcomes. The popular analogy compares using them to guide decisions about the future to driving your car by looking in the rearview mirror! Therefore, you also need a set of metrics called leading indicators. This will be different for each firm, but examples might include R&D cycle time, customer satisfaction, or employee strategic focus. These indicators assess the status of the key success factors that drive implementation of the firm’s strategy. And by their very nature, they emphasize the future rather than the past.
INTEGRATING HR INTO BUSINESS PERFORMANCE
MEASUREMENT: UNDERSTANDING HR DELIVERABLES
Grasping the relationships among key success factors is essential for measuring HR’s traditionally elusive role in driving organizational performance. Once a company firmly anchors HR in its strategy implementation system, it can then see the connections between HR and the company’s success drivers. By measuring HR’s effect on these drivers, the firm can quantify HR’s overall strategic impact.
To integrate HR into a business-performance measurement system, managers must identify the points of intersection between HR and the organization’s strategy implementation plan. We can think of these points as strategic HR deliverables, namely, those outcomes of the HR architecture that serve to execute the firm’s strategy. This is in contrast to HR “doables” that focus on HR efficiency and activity counts. These deliverables come in two categories: performance drivers and enablers. HR performance drivers are core people-related capabilities or assets, such as employee productivity or employee satisfaction. Even though these may seem so important as to be generic, there is actually no single correct set of performance drivers. Each firm custom-identifies its own set based on its unique characteristics and the requirements of its strategy implementation process.
Enablers reinforce performance drivers. For example, a particular change in a company’s reward structure might encourage preventive maintenance rather than reactive maintenance. An emphasis on preventive maintenance might in turn “enable” a performance driver called “on-time delivery.” Any performance driver may have several enablers. The enablers themselves, in isolation, may seem mundane, but—as we’ll see—their cumulative effect can have strategic importance.
Let’s look at these two categories of HR deliverables in greater detail.
HR Performance Drivers
Perhaps not surprisingly, human resource managers tend to focus on HR performance drivers in attempting to demonstrate their strategic influence. But all too often, they merely assert the importance of a particular driver, such as employee satisfaction, without being able to make the business case for its primacy. This predicament stems from the difficulties inherent in discerning HR’s actual contribution to overall mission and strategy. Because of this difficulty, companies often experience a disconnect between the metrics they use and the HR policies they institute. For example, one firm we know of incorporates various sophisticated measures into its bonus compensation system, but HR’s measures consist of simple hurdles that any manager can achieve (for instance, “100 percent of direct reports have filed a career development plan”). Such simplistic measures undermine HR’s credibility in the wider organization.
The credibility of HR measures is particularly important when financial and nonfinancial performance measures conflict. Inevitably, there comes a time when people measures are up, but financials are down. Naturally, the CFO objects to paying bonuses when “performance” doesn’t warrant it. However, such reactions miss an essential point: Balanced performance measurement means paying attention to both lagging and leading indicators. And, it’s the leading indicators—such as HR measures—that really drive value creation in the organization. The hesitation to reward managers when people measures are up and financial measures are down reflects a lack of agreement among executives that HR measures in fact drive the entire company’s performance. In this example, the reward system has been “balanced” to address some vague concern about “people issues,” but no one can articulate how these measures reflect value creation in the firm.
Moreover, managers often don’t understand the delays inherent in leading indicators. High HR scores in the face of low financials actually signal improved financials in the future, assuming that other leading indicators are also positive. The reverse is equally true, of course. Strong financials in the face of weak HR drivers and other leading indicators should raise concerns about future financial performance. The lesson? Because truly balanced performance measurement systems reflect both current and future financial performance, managers must interpret them differently from the way they do traditional performance measures.
Identifying key HR performance drivers can be challenging, because they are unique to each firm. The experience at Quantum Corporation offers an apt example. At Quantum, a leading manufacturer of hard disks and computer peripherals, executives emphasize something they call “time-to-volume.” In Quantum’s view, being first to market does not mean being first to announce or demonstrate a new product.4 Rather, it means that customers actually get the new products they want, when they want them, and in the quantities they require. Time-to-volume hinges on rapid product development—without the sacrifice of quality—plus the ability to ramp up production fast enough to meet customers’ needs. Quantum identified a set of value behaviors, such as staying flexible and adaptable, taking initiative for one’s own development, and resolving issues in an objective manner, as one time-to-volume driver. There is nothing ad hoc or symbolic about the importance of these behaviors to the success of the company. Quantum integrates them directly into its performance criteria and gives them equal weight with more traditional performance measures. Indeed, one-half of bonus and merit pay is based on financial results, and one-half on an employee’s adherence to the value behaviors. As one senior executive observed, “You can’t simply ‘get results’ too often while leaving a pile of dead bodies behind you.”
HR Enablers
As we mentioned, HR enablers reinforce core performance drivers. To provide another example, if a firm identifies employee productivity as a core performance driver, then “re-skilling” might be an enabler. We encourage human resource managers to focus as much on HR enablers as they do on HR performance drivers, but to dramatically expand the concept. For instance, rather than thinking just in terms of HR-focused enablers in your organization (those enablers that influence the more central HR performance drivers), try thinking about how specific HR enablers also reinforce performance drivers in the operations, customer, and financial segments of the organization.
Our experience with a major money-center bank illustrates what can happen when managers don’t connect HR enablers with various performance drivers in the broader organization. This particular bank had decided to shift the focus of its retail business from service to sales. The bank identified a set of performance drivers that included increased cross-selling to existing customers, teller product knowledge, and sales skills. However, its HR enablers still emphasized service. For instance, the organization still had the following:
• training programs that focused on service rather than sales;
• performance appraisal and merit pay that rewarded service rather than sales;
• hiring practices based on service competencies rather than sales competencies;
• turnover rates that undermined relationship building between tellers and retail customers; and
• low pay and benefits for tellers, who were considered overhead rather than a source of revenue growth.
Because of the disconnect between its new goals and outdated HR enablers, the bank failed to achieve its sales and profitability targets. Without the properly aligned enablers, it was simply unable to implement its new sales strategy. The lesson here is that the entire HR system influences employee behavior from many points. Thus HR has that many more opportunities to enable—or impede—the firm’s key performance drivers.
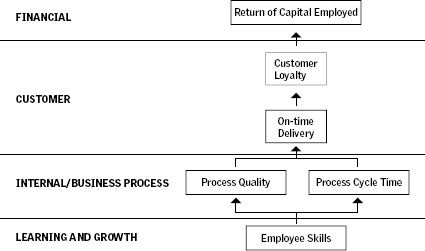
Another example from the banking industry illustrates how easy it is to overlook the power of HR enablers. When the Wells Fargo Online Financial Services (OFS) group implemented a Balanced Scorecard to measure the firm’s overall progress toward its goals of growing revenue and maximizing profits, it identified three key strategic drivers5:
• add and retain high-value and high-potential-value customers;
• increase revenue per customer; and
• reduce cost per customer.
Figure 2-2 articulates the “story” of how OFS expected to achieve those goals. OFS also identified several HR performance drivers that it felt would play an important part in the success of its strategy, shown in the Learning and Growth section of the figure:
• attract and retain key OFS players and staff;
• enhance OFS bench strength and succession planning;
• increase managerial competency and functional competency at all levels;
• continue development of the OFS organization and culture; and
• deploy the Scorecard and embed it in OFS.
According to Mary D’Agostino, VP of strategy at OFS, acknowledging these HR drivers signaled an important step for Wells Fargo, in which the culture “embraces financial measures.” But OFS managers never achieved consensus on how these HR drivers directly affected the three strategic goals. As a result, while the company agreed to monitor these drivers yearly, it neglected to formally build them into its Scorecard.
In short, human resources managers should evaluate the degree to which their firm’s entire system of enablers—from employee selection to development and rewards—supports the non-HR drivers outlined in the firm’s Scorecard. For example, one common performance driver is to “develop superior service quality.” But if line managers are struggling with high staff turnover and insufficient rewards for service quality, how can they achieve their targeted service quality levels? As another example, suppose an organization’s R&D function had identified timeliness of marketable new product innovations as a key performance driver. By understanding how the R&D unit contributes to the firm’s larger strategy implementation process, this organization’s HR manager could readily generate ideas for enabling the R&D unit’s success. Specifically, she might suggest a reward system that encourages marketable innovations, a timely sourcing function that provides technological expertise, and incentives to encourage a low level of employee turnover among key R&D talent. This kind of synergy makes for true business partnering between HR and the rest of the organization.
Figure 2-2 Preliminary Linkage Map
Source: Adapted from Robert S. Kaplan and Nicole Tempest, “Wells Fargo Online Financial Services (A),” Case 9-198-146 (Boston, MA: Har vard Business School, 1998, rev. 1999), exhibit 7.
A SEVEN-STEP MODEL FOR IMPLEMENTING
HR’S STRATEGIC ROLE
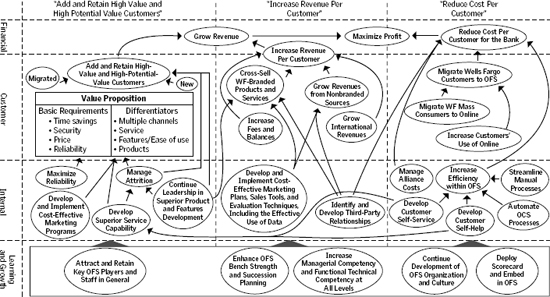
How can HR formalize this kind of strategic role? Figure 2-3 illustrates how HR can link its deliverables to the firm’s strategy implementation process. While we elaborate on various components of this model in subsequent chapters, we summarize it for you in the following seven steps:
Step 1: Clearly Define Business Strategy
At the strategy-development “table,” senior HR leaders provide an essential perspective. By focusing on how to implement the strategy rather than solely on what the strategy consists of, they can facilitate a discussion about how to communicate the firm’s goals throughout the organization. When strategic goals are not developed with an eye toward how they will be implemented and communicated throughout the organization, they tend to become very generic—for example, “maximize operating efficiency,” or “increase presence in international markets,” or “improve productivity.” These goals are so vague that individual employees simply can’t know how to take action to achieve them. Worse, employees can’t recognize them as unique to their firm. To illustrate, we often run a simple experiment in our executive education classes. We ask participants to write down their firm’s mission or vision statement, which we then retype (removing any mention of the firm’s name) and redistribute among the group. Next we ask participants to pick out their own mission and vision statements from this collection. These statements are so vague—and so similar—that most find it very difficult to do so.
Clarifying your organization’s strategy in precise terms can take practice. The key thing is to state the firm’s goals in such a way that employees understand their role and the organization knows how to measure its success in achieving them.
Step 2: Build a Business Case for HR as a Strategic Asset
Once a firm clarifies its strategy, human resource professionals need to build a clear business case for why and how HR can support that strategy. In making this business case, you have the benefit of a decade of systematic research to support your recommendations. While a comprehensive review of this research is beyond the scope of this book, we can highlight the key results. First, evidence gathered from four national surveys and more than 2,800 firms strongly suggests that a high-performance work system has a distinct, positive influence on a firm’s financial performance. Figure 2-4 illustrates those results.
Figure 2-3 Transforming the HR Architecture into a Strategic Asset
The x-axis in figure 2-4 reflects the extent to which a firm’s HR system is consistent with our principles of a High-Performance Work System, ranging from 0 for the lowest-rated firms in our survey to 100 for the highest-rated firms. The y-axis represents the market value per employee associated with different points on our 1996 HR index. Once again, the results demonstrate that better HR management matters—and it does so in terms that matter outside HR.
Figure 2-4 also indicates that the returns from investments in a high-performance HR strategy are not linear. Firms in this sample appear to have three distinct experiences as their HR systems become more focused on performance. First, firms moving from the lowest percentile rankings to the twentieth percentile enjoy a significant improvement in firm performance. At this point, HR functions move from being an impediment to strategy implementation to having a neutral strategic influence. Said differently, by improving to the twentieth percentile, the HRM system creates value simply by getting out of the way.
Figure 2-4 HR as a Source of Value Creation
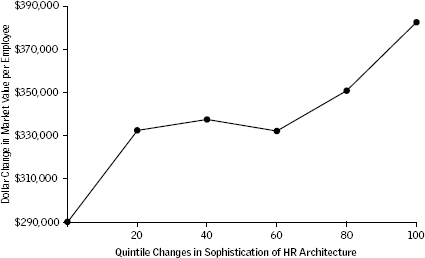
Note: The relationship between the HPWS index and market/book value in this figure is adjusted for company differences in research and development, industry, sales growth, employment level, and unionization. Note also that the market values per employee reflect 1996 levels and will have increased over time.
Source: Mark A. Huselid and Brian E. Becker, “High Performance Work Systems and Organizational Performance,” paper presented at 1995 Academy of Management annual meeting, Vancouver, B.C., August 1995.
Second, for the broad middle range (twentieth to sixtieth percentile firms), improving the quality of a firm’s HRM system has little marginal impact on firm performance. This marks the consolidation of the transformation from a personnel to a professional focus in human resources. This approach does no damage, but HRM is still not really a strategic partner.
Finally, firms above the sixtieth percentile not only have adopted the appropriate HRM practices and implemented them effectively throughout the firm but also have begun to integrate the HRM system into the strategic “fabric” of the firm. As a practical matter, above the sixtieth percentile, the marginal impact of HRM on firm performance is the same as it is for those firms below the twentieth percentile, but for different reasons. The very best firms in our sample enjoy the payoffs from combining the appropriate HRM policies and practices into an internally coherent system that is directly aligned with business priorities and operating initiatives most likely to create economic value. In essence, our findings point to the significant financial returns available to firms that dramatically increase the quality of their HRM systems.
While these effects are financially significant, keep in mind that they do not represent a magic bullet. That is, simple changes in an HR practice will not immediately send a firm’s stock price soaring. Remember that our HR measure describes an entire human resource system. Changing this system by the magnitude required to enjoy these gains takes time, insight, and considerable effort. It’s fair to say that it requires a transformation of the HR function and system. If it could be done overnight, human resource systems would be easily imitated and would quickly lose much of their strategic character.
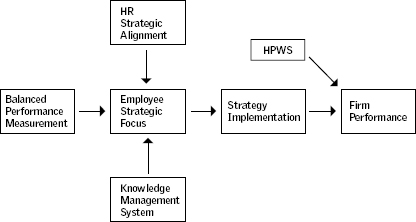
The business case for a strategic HR role must also incorporate HR’s key influence on strategy implementation and the role of strategically focused measurement systems. Figure 2-5 describes the model for such a business case based on our most recent survey of more than 400 firms.6 These results tell a simple but powerful story. Consistent with the premise of this book, our research suggests that strategy implementation, rather than strategy content, differentiates successful from unsuccessful firms. It is simply much easier to choose an appropriate strategy than it is to implement it effectively. Moreover, successful strategy implementation is driven by employee strategic focus, HR strategic alignment, and a balanced performance measurement system. The linchpin of successful strategy implementation is a strategically focused workforce, which we could consider the ultimate HR performance driver. Finally, a balanced performance measurement system, in tandem with an aligned HR system and effective knowledge management, is the foundation for a strategically focused organization.7
Step 3: Create a Strategy Map
Clarifying your firm’s strategy sets the stage for implementing that strategy. But it is just the first step. In most organizations, the customer value embodied in the firm’s products and services is the result of a complex, cumulative process—what Michael Porter refers to as the firm’s value chain.8 All firms have a value chain—even those that haven’t articulated it—and the company’s performance measurement system must account for every link in that chain.
To define the value-creation process in your organization, we recommend that the top- and mid-level managers who will be implementing the firm’s strategy develop what Bob Kaplan and Dave Norton call a strategy map to represent the firm’s value chain.9 These are diagrams of the value chain, such as those shown in figures 2-1 and 2-2. Such graphic representations of the company’s value chain reveal how the firm creates value in terms that managers and employees alike can grasp and act on. The value-chain mapping process should involve managers from all functions across the organization. This broad participation not only improves the quality of the strategy map but also increases buy-in among critical players. To begin the mapping process in your own organization, take a close look at your company’s strategic objectives and ask yourself the following questions:
Figure 2-5 HR and Strategy Implementation
• Which strategic goals/objectives/outcomes are critical rather than nice to have?
• What are the performance drivers for each goal?
• How would we measure progress toward these goals?
• What are the barriers to the achievement of each goal?
• How would employees need to behave to ensure that the company achieves these goals?
• Is the HR function providing the company with the employee competencies and behaviors necessary to achieve these objectives?
• If not, what needs to change?
These simple questions can generate a wealth of information about how well a firm’s HR function has been contributing to the organization’s success. We also suggest supplementing these discussions with a variety of other information-gathering tools, including questionnaires to test employees’ understanding of the firm’s goals, and surveys to generate additional data about the firm’s performance drivers and organizational capabilities. Once you think you have a full picture of your firm’s value chain, translate the information that you have gathered into a conceptual model using language and graphics that make sense in your organization. Then test for understanding and acceptance in small groups of opinion leaders and thought leaders throughout the firm.
A strategy map of the value-creation process contains hypotheses, or predictions, about which organizational processes drive firm performance. Normally, a company validates these hypotheses only after achieving targets on performance drivers and observing the impact of these results on firm performance. However, if the organization can graphically depict the relationships among performance drivers while mapping the firm’s value chain, it can have that much more confidence in its strategy implementation plan.
Sears is a good example of an organization that had a chance to test its hypotheses and further refine its strategy map based on actual experience. Beginning with the work-shop-invest model described in chapter 1, Sears dramatically enhanced its understanding of these constructs as it gained more experience with the model—which it subsequently used to enhance the quality of its measurement system. Figure 2-6 describes the more comprehensive (“total performance indicator”) strategy map that Sears developed at the level of the full-line retail store.
Step 4: Identify HR Deliverables within the Strategy Map
We mentioned earlier that HR creates much of its value at the points of intersection between the HR system and the strategy implementation system. Maximizing that value requires an understanding of both sides of that intersection. Historically, HR managers lacked the requisite knowledge of the business side of the intersection, and general managers did not fully appreciate the HR side. While this gap has narrowed in recent decades, human resource managers should take primary responsibility for depicting both HR performance drivers and HR enablers on the strategy map.
This process can be difficult. On the one hand, human resource performance drivers such as employee competence, motivation, and availability are so fundamental that it may be virtually impossible to know where to locate them on the map. To perform this step, we recommend asking yourself which HR deliverables (again, both performance drivers and enablers) support the firm-level performance drivers depicted in the strategy map. Try to focus on the kinds of strategic behaviors that are broadly a function of competencies, rewards, and work organization. For example, your firm may decide that employee stability (i.e., low turnover) improves R&D cycle time (a firm-level performance driver). Employee stability is thus a key HR enabler. Seeing this connection would prompt you to design policies—such as above-market-rate salaries or bonuses—that would encourage lengthy tenure among experienced R&D staff.
Figure 2-6 Sears “Total Performance Indicator” Model for Full-Line Retail Stores
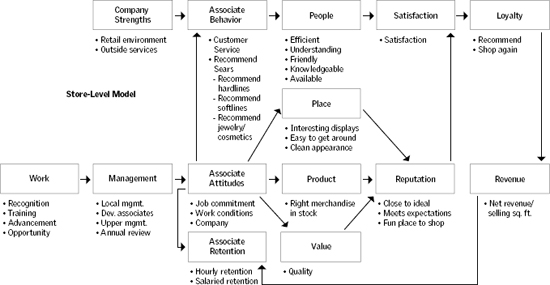
Source: Sears, Roebuck and Co. Reprinted with permission.
LINKING HR TO STRATEGY AT GTE
Steps 1 through 3 in the model described in this chapter are much more straightforward if the company has implemented, or is in the process of implementing, a wider Balanced Scorecard. In some cases, however, HR managers have to approximate Steps 1 through 3 without the benefit of the more systematic analysis that would have been part of a larger Balanced Scorecard effort. The experience at GTE is a good illustration of how, when the larger organization has not participated in the creation of a “strategy map” linking leading and lagging indicators of strategic performance, HR can begin to link its measurement system to the enterprise strategy.
At GTE, HR initially developed the firm’s “people imperatives” as part of a top leadership planning process called “Leadership 2000.” These imperatives focused on the new behaviors and capabilities required to drive business results over the next five to ten years. This in turn was the foundation for a new HR strategy that was organized around five strategic thrusts, as follows:
• talent;
• leadership;
• customer service and support;
• organizational integration; and
• HR capability.
Most important, GTE HR didn’t stop with these very high level strategic thrusts. Instead, they met with GTE business leaders and found out what it was about each of the five strategic thrusts that kept the business leadership “awake at night.” This alignment process resulted in seventeen specific questions that became the organizing focus for the metrics in HR’s own Balanced Scorecard. Some examples of these questions include the following:
• Do we have the talent we need to be successful in the future?
• How is HR helping GTE position itself to meet the needs of external customers?
• Is HR viewed as an enabler to attracting and retaining top talent at GTE?
• Are we managing the cost of turnover/churn?
• Are we managing financial risk?
• What is GTE’s return on investment in people?
Source: Garrett Walker, HR director at GTE, interview with author (Mark Huselid), August 2000; and Measure What Matters: Aligning Performance Measures with Business Strategy (American Productivity and Quality Center, 1999).
Step 5: Align the HR Architecture with HR Deliverables
Up until now, you’ve been thinking “top down,” whereby strategy tells you which HR deliverables you should focus on (Step 4). Now the question is, How can the HR system (rewards, competencies, work organization, etc.) be structured so as to provide those deliverables? Figure 2-7 illustrates how a properly aligned HR system creates the HR deliverable (low turnover among senior R&D employees) that enables a key performance driver (cycle time) in the strategy map. The experience at GTE illustrates these same concepts. As described in the sidebar “Linking HR to Strategy at GTE,” GTE has developed a Scorecard for the HR function (see chapter 3) that focuses on five enterprise-wide HR performance drivers, which it calls strategic “thrusts.” These are human-capital-related areas that are important to successful strategy implementation overall, but are not specifically linked to a particular business problem.
However, GTE has also used these strategic “thrusts” to guide its analysis of unique HR problems facing its respective business units. This is very similar to our notion of the HR enabler, which is a highly focused point of impact for the HR architecture. For example, in one SBU, a strategic performance driver is making service a key market differentiator. Based on an analysis by GTE HR, the HR deliverable, to use our terms, is a “stable and engaged workforce.” We would differentiate this deliverable as an HR enabler because it would not rise to the level of an enterprise-wide HR performance driver. Finally, GTE HR aligns the HR system to provide the necessary talent acquisition, incentive plans, culture initiatives, and “brain drain” initiatives to provide the required HR deliverable.
GTE HR has also worked with individual business units to develop SBU-specific strategy maps that more systematically describe and guide HR’s contribution to the unit’s strategy. For example, GTE’s Wireless group decided to focus on a key market to increase sales and revenue. HR worked with business leaders in Wireless to develop the unique competencies needed to implement that strategy. Figure 2-8 describes the relationship between HR’s initiatives and financial performance. Here the HR deliverable is a set of sales skill competencies.
Figure 2-7 Intersection of HR with Strategy Map
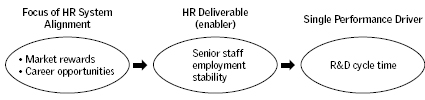
Figure 2-8 represents results one might expect from following Steps 1 through 4 at the SBU level. Implementing Step 5 means developing a competency model and development program to provide the HR deliverable specifically required by this strategy.
Step 5 brings your firm’s value-creation story to life by aligning the HR system with the firm’s larger strategy-implementation system. But to do this, you need to think about how the components within your HR system fit together (internal alignment) as well as how the HR system aligns with (that is, supports) the other elements in the firm’s value chain (external alignment). These concepts of internal and external alignment are closely interrelated. Specifically, internal alignment is necessary but not sufficient in itself for external alignment to occur. For example, in the 1980s, IBM was characterized by high levels of internal HR alignment. Led by one of the largest and most competent cadre of human resource professionals in business history, the company designed a remarkably cohesive HR management system and then linked it tightly with its competitive strategy. This HR system was so cohesive that when IBM changed its strategy, many established human resource structures became irrelevant and even inappropriate. A highly cohesive HR strategy will fail if it is not periodically reshaped so as to align with the firm’s larger (and often changing) business strategy. Yet all firms need an internally aligned HR strategy in order to achieve their overall goals.
Figure 2-8 Strategy Map: Competency Skill Attainment Focus

Source: Reprinted with permission of GTE Corporation.
Misalignment between the HR system and the strategy implementation system can actually destroy value, as our experience with a large money center demonstrated. Like many other banks in this industry, the firm in question switched from full-time to part-time front-line tellers to save payroll costs. In many of its locations, the company outsourced entire cadres of tellers and then leased the employees back from a contractor. In the short run, this strategy did lower labor costs. However, about a year later, the bank faced a shortage of candidates for the head teller and junior loan officer positions. Not only had the organization dismantled the training and development opportunities that had historically prepared tellers for promotion, but in its shift to part-time employment, it had attracted workers who weren’t particularly interested in full-time positions, as well as some individuals who were not necessarily “promotable.” As an unintended consequence of the shift toward part-time employment, recruiting and compensation costs shot up for positions two to three levels above the entry-level teller positions. The bank was now forced to hire from the outside, but it no longer had the selection and training systems in place to do so. In the long run, total compensation costs thus increased significantly, including considerable time lost and discontent among other employees. The lesson is that the measurement system adopted by the firm (short-term payroll costs) eventually harmed the business’s overall performance and had exactly the opposite effect of what the problem fixers intended.
UNINTENDED CONSEQUENCES AT GTE
The systemic thinking encouraged by a “balanced” performance measurement model is illustrated by the experience of GTE. Prior to the development of their Scorecard, GTE HR had been under strong pressure by line managers to focus largely on efficiency and cost control. In response, HR in one region reduced cycle time to fill jobs by 50 percent below the company average and generally achieved very low staffing costs. However, the GTE call centers in this region were not seeing the benefits of this HR efficiency in their business results. Instead they had a turnover rate twice the company average and falling customer service levels.
What happened? Both line managers and GTE HR had been thinking too narrowly about HR’s influence on the business and didn’t anticipate the indirect influence of those decisions. As it turned out, GTE HR had started recruiting from a different talent pool to reduce their cycle time. They shifted from a pool of graduating students and experienced professionals to temporary agencies and job bank applicants. Cycle time and staffing costs fell, but with the result that the sourcing process was less selective and new hires did not have the same “fit” as past hires. The result was higher turnover rates and higher training costs, as these hires lacked many of the foundational skills of the earlier pool. Customer service levels fell as turnover increased the percentage of inexperienced employees and further diverted more experienced staff from customers to support these new employees.
The new partnership with business leaders encouraged by the HR Scorecard resulted in a more complete understanding of these systemic relationships. The result was an acceptance that longer cycle times and higher staffing costs are actually investments with substantial positive business results.
Step 6: Design the Strategic HR Measurement System
Steps 1 through 5 guide the development of the HR architecture and lay the groundwork necessary to measure the HR-firm performance relationship. In Step 6, you actually design that HR measurement system. This requires not only a new perspective on measuring HR performance, but also the resolution of some technical issues that many HR professionals may not be familiar with.
To measure the HR-firm performance relationship with precision, you need to develop valid measures of HR deliverables. This task has two dimensions. First, you have to be confident that you have chosen the correct HR performance drivers and enablers. This requires that you clearly comprehend the causal chain for effective strategy implementation in your organization. Second, you have to choose the correct measures for those deliverables. For example, in figure 2-7 the HR deliverable is senior staff employment stability, but there are several ways this concept could be measured. Developing the actual measure would require that you precisely define who constitutes the senior staff (for example, those with five to fifteen years of professional experience) and what you mean by employment stability. Does the latter include all turnover or just voluntary? Does it include individuals who have been promoted to management responsibilities? Finally, you need to measure those variables accurately.
In our experience, most firms go through several stages of increasing sophistication when they develop an HR Scorecard. Figure 2-9 illustrates the measurement choices facing HR professionals. Most HR measurement systems fall in the Traditional category, or Stage 1. These include operational metrics such as cost per hire and activity counts. The gap between Stages 1 and 2 in the diagram symbolizes the substantial divide between a strategically and operationally focused HR measurement system.
Figure 2-9 The Creation of Employee Strategic Focus Through
Increasing Measurement Sophistication
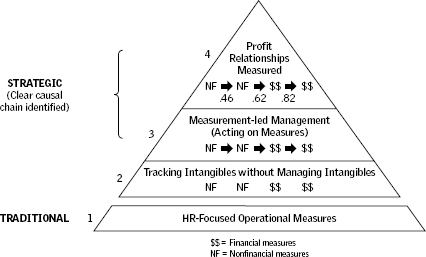
In the second stage, HR measures have the aura of strategic import, but they do little to validate HR’s role as a strategic asset. Firms may declare several “people” measures, such as employee satisfaction, as having strategic value, and these metrics might even make their way into the reward system in some fashion. In such cases, there is a “balance” between financial ($$) and nonfinancial (NF) measures, but there is no consensus about how these variables serve to implement strategy. There is therefore no strategic logic linking these measures together. Such firms have skipped Steps 2 through 5 in our model.
Stage 3 in figure 2-9 is a key transition point. The firm includes nonfinancial measures (among them HR measures) in its strategic performance measurement system. In addition, it locates each measure within a strategy map. For the first time, human resource measures are legitimately tracking HR’s contribution to firm performance.
In Stage 4, HR measurement systems let the firm estimate the impact of HR policies on firm performance. If the firm’s value chain is short, as it is at Sears, the company can gauge the full impact of HR on overall performance. In organizations with more complex value chains, estimates of HR’s influence may be limited to segments within the chain. Just because you can’t capture the full impact of HR on firm performance, that doesn’t mean that you shouldn’t measure part of the impact. For example, consider the example of an imaginary company called Petro Pipeline in figure 2-10. This describes a very small portion of a larger strategy map depicting Petro’s strategy implementation system. It would be reasonably straightforward to measure the influence of the HR deliverables (improved employee focus on preventive maintenance) on “repair down time” and subsequent effects on customer perceptions of Petro as a reliable provider.
Clearly, measuring the HR-firm performance relationship is not an all-or-nothing proposition. Any progress beyond traditional measurement approaches is likely to yield substantial improvement later in the value chain. The more sophisticated the measurement system, the greater the eventual benefits.
Step 7: Implement Management by Measurement
Once the HR Scorecard is developed along the principles described in our model, the result is a powerful new management tool. Actually implementing this tool is much more than just “keeping score” of HR’s impact on firm performance. If the Scorecard is aligned with the imperatives of the firm’s strategy, HR professionals will have new insight into what it takes to actually manage HR as a strategic asset.
For example, GTE HR had always measured the turnover rates in its businesses, but prior to the development of its HR Scorecard, there had been little effort to understand the underlying dimensions of the turnover rates and their consequences for organizational profitability. In other words, although GTE HR measured turnover in the past, it really didn’t manage it as a business problem in its respective business units. As the HR Scorecard was implemented, these turnover rates were more closely analyzed indicating substantial increases among new hires and the most experienced employees. The result was new HR interventions for both groups that addressed these problems with associated benefits for the performance of the business units involved.10
Figure 2-10 Influence of HR Enablers at Petro Pipeline
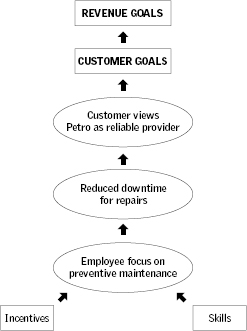
Note: This figure is a subsection of a larger causal map.
Implementing a new management process based on the work done in Steps 1 through 6 requires considerable change and flexibility. Moreover, the process is not just a one-time event. Human resource leaders must regularly review the HR deliverables they’ve defined in order to be sure that these drivers and enablers remain strategically significant. This is particularly true for HR enablers that have direct links to specific business objectives. Skilled HR managers understand when an enabler is no longer playing a strategic role and needs to be replaced.
SUMMARY: DEVELOPING WORLD-CLASS
PERFORMANCE MEASUREMENT
Developing a world-class performance measurement system hinges on a clear understanding of the firm’s competitive strategy and operational goals—and a definitive statement of the employee competencies and behaviors required to achieve the firm’s objectives. Moreover, a systems perspective is a prerequisite for cultivating internal and external alignment of the HR system and thus for generating true competitive advantage. Measurement systems—for the firm as a whole or for the HR function—can create value only when they are carefully matched with the firm’s unique competitive strategy and operational goals. Thus, firms should benchmark other organizations’ measurement systems with caution. In the case of measurement systems, “best practices” may not be portable across firms. Therein lies their competitive value!