
![]()
Data Discovery and Analysis Patterns
Big data analysis is different from traditional analysis as it involves a lot of unstructured, non RDBMS types of data. This type of analysis is usually related to text analytics, natural language processing. Areas like video and image analytics are still evolving. Big data analysis attempts to interpret and find insightful patterns in the customer behavior that perhaps the sales force already had some idea about, but did not have the data to support it. Big data analysis methods are used to analyze social media interactions, bank transactions for fraud patterns, customer sentiments for online product purchases, etc. Let’s look at some patterns that may help discover and analyze this unstructured data.
Problem
What are the different types of unstructured data sources that are analyzed in a big data environment?
Solution
There are different types of unstructured data hidden in multiple data sources that are available as large datasets:-
- Documents contain textual patterns, repetitions of certain words, etc. that can be analyzed and interpreted.
- Application logs contain a wealth of information about upcoming down time, applications that are coming up for maintenance and upgrade, etc.
- E-mail has become the defacto means of communication both in corporate as well as informal channels.
- Social media forums like Yammer, Twitter, and Facebook generate a lot of text and symbols may that determine customer behavior.
- Machine generated data like RFID feeds, weather data, etc. also provide a large data set for automated analysis.
Problem
What are different statistical and numerical methods available for analyzing the different unstructured data sources?
Solution
Various methods that have their origins in computer science computational methods exist for analyzing big data sources:-
- Natural language processing
- Text mining
- Linguistic computation
- Machine learning
- Search and sort algorithms
- Syntax and lexical analysis
Using these methods, the output of the analysis of the results is combined with the structured data to arrive at meaningful insights.
Problem
What are the typical analysis patterns used for analyzing big unstructured data?
Solution
We will cover the following analysis patterns (shown in Figure 6-1) in this chapter:-
- Data Queuing Pattern: This pattern is used to handle spikes in the data being analyzed. A lightweight process or workflow is required to queue the additional chunks of data and then route them to available nodes.
- Index-based Insight Pattern: This is a data discovery pattern in which a series of indexes are defined based on inputs from users who interact with customers. These indexes are tuned iteratively as more and more data determines the range of the indices.
- Constellation Search Pattern: This pattern utilizes master data management (MDM) concepts where a constellation of metadata is used to confirm the repetitive occurrence of a set of variables. This constellation is refined and the added back to the MDM system.
- Machine Learning Pattern: Statistical and numerical analysis algorithms are applied using programming tools to identify patterns in machine generated data from energy meters, weather related devices, RFID feeds, etc.
- Converger Pattern: Analyzing unstructured data and then merging it with structured data is required to get the enterprise wide perspective to make decisions.
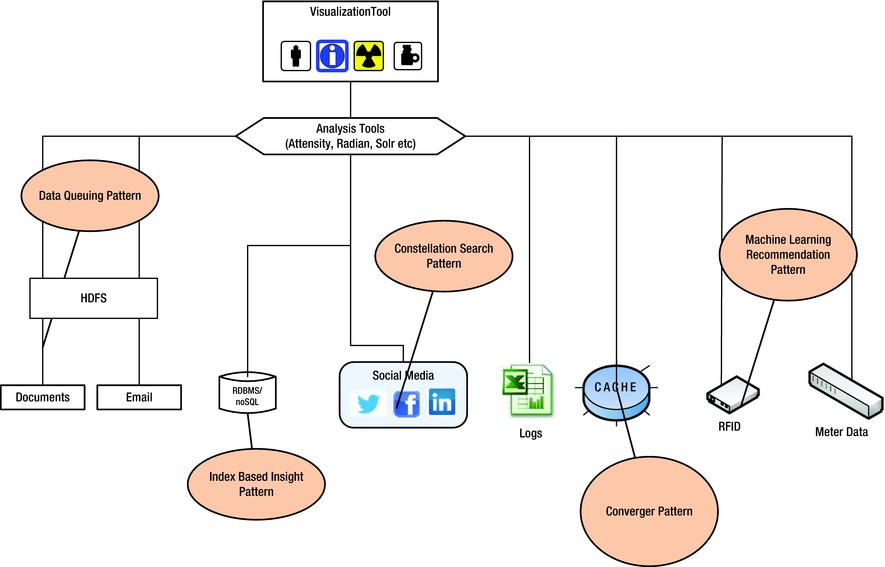
Figure 6-1. Analysis Patterns
Data Queuing Pattern
Problem
Unlike traditional structured data where the volume of data is known and predefined, unstructured data comes in spurts. The big data analysis tools may be analyzing different volumes of data. How do I manage the changing volume spikes?
Solution
Events like professional football or rock concerts trigger a lot of activity in different forums and email groups. It is also the right time to roll out offers and promotions.
To handle such spikes in data we can use cloud infrastructure as a service (IaaS) solutions.
A simple lightweight workflow to queue the additional data chunks and orchestrate the assignment of analysis to the nodes that are free is required in the architecture. There is also a need for spining new virtual machines, on demand, to address the new capacity requirements dynamically.
The data queuer (shown in Figure 6-2) that sits above the HDFS layer allows us to provision and orchestrate the analysis payload so that it does not interrupt the analysis tools and provides a seamless interface.
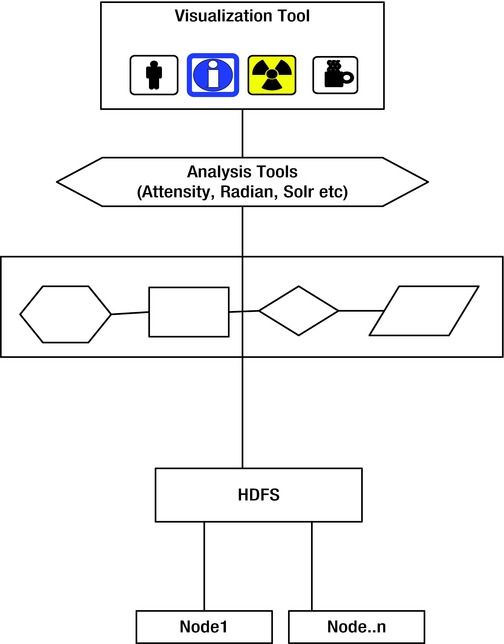
Figure 6-2. Data Queuing Pattern
Index based Insight Pattern
Problem
I need to estimate the number of different types of parameters that I am monitoring, e.g., all parents who buy toys, all children above 13 in a neighborhood, etc. This is a count that needs to be averaged out to reach a stable count. How do I setup an analysis pattern that helps me to index such variables and provide insight?
Solution
The above problem requires an efficient key / index lookup that provides rapid scanning and also helps to keep related column families together. This is a pattern used by many analysis tools to build indexes and enable rapid search. Indexes can be used along with zones and/or partitions to improve performance of ‘read’ requests.
As data grows and read requests vary, more indexes need to be incorporated based on the most frequently ‘read’ data attributes.
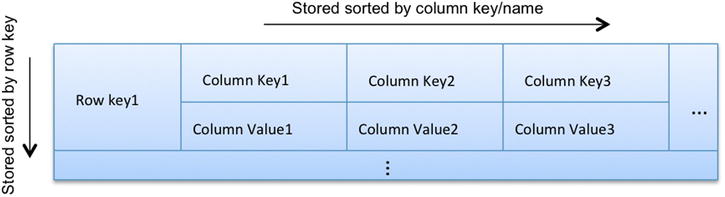
Figure 6-3. Columnar index based Insight Pattern
In fact, this pattern has been extended further by graph databases where the attributes and relationships among ‘Nodes’ is dynamically added as queries grow more complex.
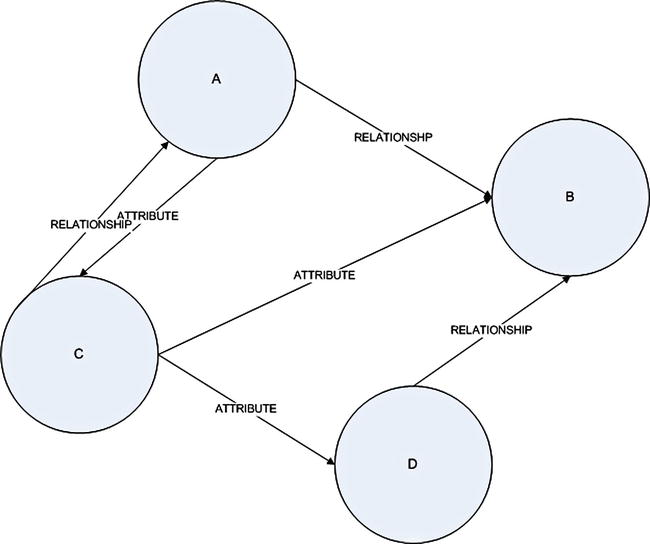
Figure 6-4. Attributes based Insight Pattern
Constellation Search Pattern
Problem
How do I spot groups of related data and define metadata when the database is not designed for this type of analysis upfront before the data is loaded as in a traditional RDBMS?
Solution
Some of the common big data social media analytics use cases help in identifying groups of people with the proper attributes who can then be targeted in a focussed manner.
The criteria for grouping together data is the new method of identifying master data. Master data is data that is generally from a single source or a group of sources that is persistent, typically non-transactional and that is important in analyzing aspects of the business. Big data is driving a new approach to distributed master data management (D-MDM). Master data is used by analysts to create constellations of data around a variable. There can be constellations at various levels of abstraction to give different views from different “levels”.
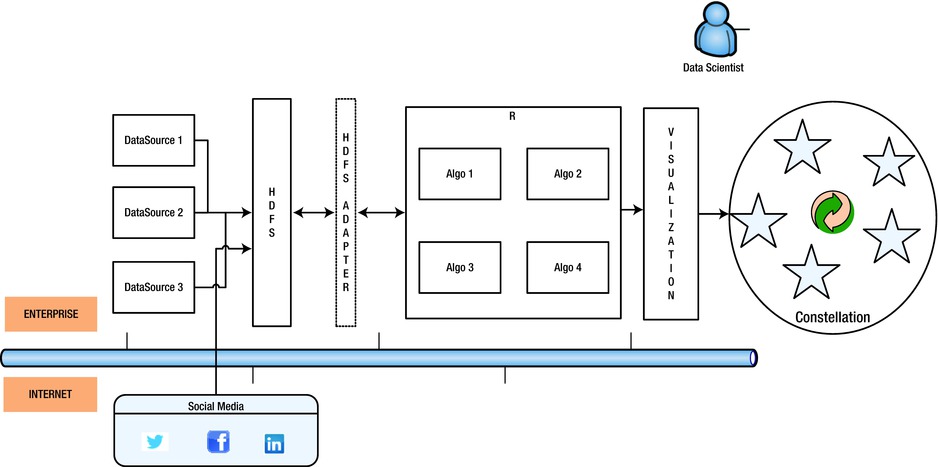
Figure 6-5. Constellation Search pattern
As seen in Figure 6-6, the data, typically stored in a Hadoop cluster is a combination of data from social media as well as the data in the enterprise. The information from the social media data can be analyzed to extend the metadata stored in D-MDM. This extended meta-data, along with the social-media analytics, can be used to create a constellation of information that can be used to arrive at newer insights.
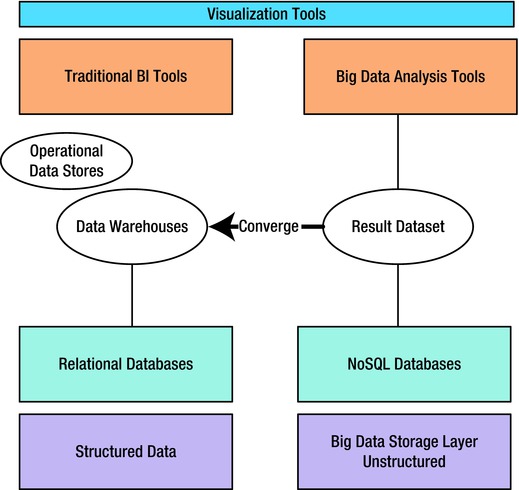
Figure 6-6. Coverger Pattern
For example, Facebook’s ‘Needle in a haystack’ architecture uses a combination of in-memory indexes and metadata to search photos and ‘photos related to a photo’. The index stores the minimal metadata required to locate a particular needle in the haystack. This efficient usage of index and metadata combinations not only helps reduce search latency but also provides a constellation of relationship meta-data around an image. This constellation can then be used for performing further anlaysis and arriving at meaningful and hitherto unknown insights.
Machine Learning Recommendation Pattern
Problem
What analysis pattern should be used for meter data, RFID feeds, etc?
Solution
Machine learning is about turning data into information using automated statistical methods without direct human intervention. With the deluge of data spewed out by various devices it is not humanly possible to define analysis patterns. We have to rely on statistical methods and algorithms to do this task for us.
The various machine learning algorithms usually used to analyze big data are:-
- kNN Classification algorithm to identify your neighbors
- Time decision trees
- Bayesian decision theory
- Regression coefficients
- Apriori algorithms for finding frequently occurring data items
Converger Pattern
Problem
How do I analyze both traditional and external data together?
Solution
Social media (Facebook, LinkedIn, Twitter, Google+ and others) carries views and opinions which can be merged with the analysis done using organizational data to bring more insight into ‘sentiment’ regarding an organization or a product. This combined analysis can help with insights that the data present within the enterprise system cannot. To achieve this, the architecture should support combining the external analysis with the in-house analysis results.
As seen earlier in the question on the ‘Constellation Search’ pattern, the data from social media and the data within the enterprise needs to be co-related using D-MDM to arrive at meaningful insights. For this to happen, the format of the data from external sources needs to be converted and married with the enterprise data. This convergence can be arrived at by using data from providers like InfoChimps, Kaggle and other vendors. The convergence involves typical ETL steps like, transformation, cleansing, enrichment et al.
The convergence has to happen before the enterprise data is analyzed. This pattern can be used in consonance with the ‘Facade Data storage’ pattern discussed in an earlier chapter.
The constellation arrived at using machine learning patterns on social-media data can be used to look at impact on revenues, brand image, churn rates, etc.
Challenges in Big Data Analysis
Problem
What are the most prevalent challenges in big data analysis?
Solution
Big data analysis has new challenges due to its huge volume, velocity, and variety. The main among them are:-
- Disparate and insufficient data: Plain text in any language is different from person to person communications. In the case of big data, traditional analytics algorithms fail due to the heterogeneity of the data. A very effective data cleansing process is required to tackle this challenge before it is fit for analysis.
- Changing volumes: Technologies like Hadoop allow us to manage the large volumes at relatively low cost, however the frequency of these change in volumes can impact the performance of analysis. Use of the cloud infrastructure combined with the data queuing pattern can help manage this challenge.
- Confidentiality: The confidentiality of the data being analyzed which belongs most often to individual users and customers make the handling of big data a very debatable issue. Laws are being framed to protect the privacy rights of while their data is being analyzed. The analysis methods have to ensure that there is no human intervention and inspection of the data. Machine learning becomes very important in this context.
- Performance: With options like data analysis as a service (DaaS) available for outsourcing your big data analysis, performance and latency become a big challenge. Ingenious ways of streaming data have to be available for fast transfer of data to overcome this challenge.
Frameworks like AppFabric and Open Chorus help solve some of the above challenges.
Problem
Log files are the most unstructured type of data. They are defined differently by each product as well as by individual. Is there a high level approach to tackle this problem?
Solution
Log files are generated by all applications and servers and are defined by users, developers, and system administrators.
Operating systems and application servers generate huge amounts of data into log files. Big data analysis tools have to cleanse, decipher, analyze, and mine relevant information from these strings of raw data. Analyzing this information will give information pertaining to the health of these systems. Organizations can create a service catalogue of private cloud offerings based on the usage statistics of servers and infrastructure.
Most application and web servers allow developers and administrators to define some sort of loose format for the logs, generally using a separator symbol between attributes. The first step to start analyzing these files is to understand these formats and create a data model for example, map each block of a string to attributes like Http 404 codes or events that have a purchase action, etc.
Tools like Splunk provide a methodical approach to analyzing log information. The typical steps in analyzing log information are:-
- Identify attributes being logged in the log
- Make note of exceptions
- Create a data mapping of attributes
- Scan the raw data repeatedly to detect frequency of events and exceptions
- Select the time period that you want to select the data asset for
- Find categories for repetitive events and correlate
- Fine tune the categories with every search
- Run analytics on the set of attributes and categories that have been stabilized after a few iterations.
Problem
Organizations are making instant decisions based on the sentiments, opinions and views of their customers. These opinions are present in tweets, blogs and forums. How do I analyze this information?
Solution
Sentiment analysis involves analyzing social media text for people’s opinions. As you can imagine it involves understanding language idiosyncrasies as well. Lexical analysis can be applied to formal and structured documents as they are usually grammatically correct. However blogs and tweets use slang, that is difficult to analyze and ambiguous. The outcome of a sentimental analysis is usually a percentage or strength range that is determined based on the frequency of occurrence of words, parts of speech used, use of negation syntax and position of the words in a sentence. Techniques like Bayes’ theorem, entropy and vector analysis are used to infer from textual data. Tools like Splunk are used to facilitate sentiment analysis.
Data Analysis as a Service (DaaS)
Problem
Can I outsource my big data analysis to a third party vendor?
Solution
Yes. APIs provided by many vendors like the Google Prediction API provide the ability to analyze your data without having to invest in a large capital expense to build your big data analysis platform. The APIs are usually Restful and involve just invocation of the service over HTTP. The data interchange is also lightweight and loosely structured using JSON objects or some other data format.
Summary
Analysis tools have been upgraded to analyze big data residing on Hadoop clusters, in-memory or in social media networks. Patterns are required to obtain the same performance, confidentiality and context from the traditional analytics tools using statistical analysis, cloud services and sentiment analysis to map to the traditional reporting means like dashboards and reports.
With these patterns you have seen how the data scientist can be augmented by the architect’s solutions, to supplement his data mining repertoire of algorithms and methods.