Optimizing a wind turbine’s power output involves the consideration of many elements: blade pitch, blade length, number of blades, direction of rotation, gearbox ratio, and number of blades. This chapter presents a method and setup for quantifying power output, giving a measurement by which the efficacy of a design can be assessed. Incremental design changes can be quickly tested in a trial-and-error approach that converges to form the best solution.
Test Setup
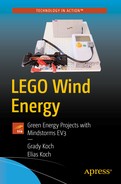
A wind turbine under development can be tested with a fan, as shown in Figure 6-1. Box fans work well for this setup—a 24-inch-diameter fan is a good choice. We put the turbine about 1.5 meters away from the fan so as to allow the airflow to smooth out a bit. With the fan providing a wind source, the task becomes how to measure electrical output from the turbine. The generators described in this book produce direct current (DC) electricity, which is easy to measure with a multimeter. Multimeters are commonly available at hardware stores or online. For example, amazon.com has a suitable multimeter available for as low as $12. Our multimeter, shown in Figure 6-1, has been an old friend for over 25 years and does many types of measurements. But a simpler multimeter will suffice, needing only measurements of DC voltage and resistance.
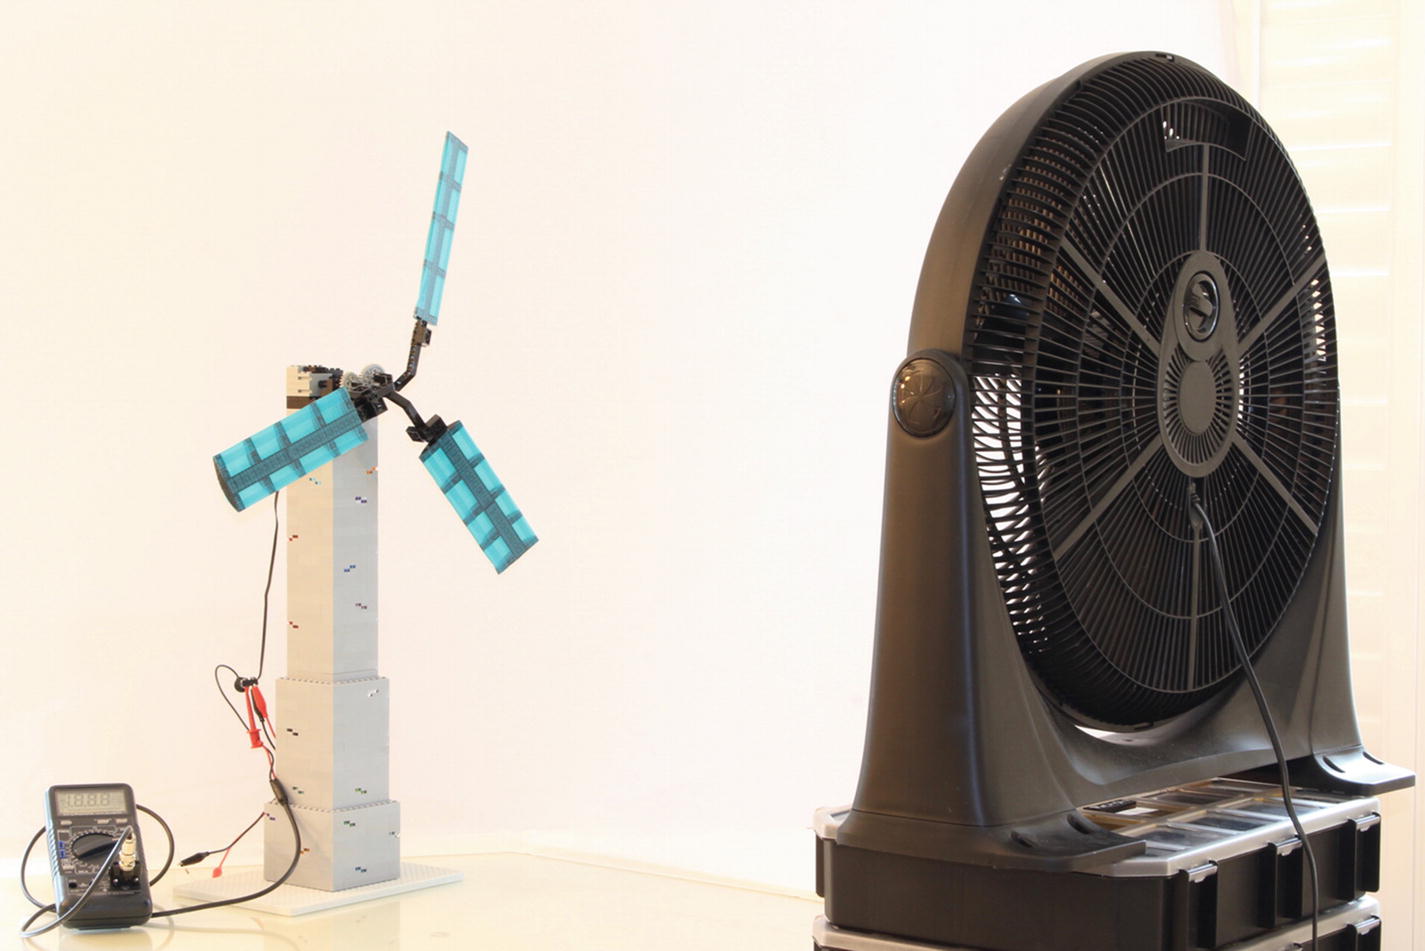
A multimeter is connected by clip leads to a #5306 LEGO connector
Placing an electrical load on the turbine, while also measuring voltage, involves two sets of wires
The choice of resistor involves two factors: resistance value and power-handling capability. Resistance, measured in ohms, is indicated on a resistor by a color code of four bands. The key to the color code can be found on the internet or is usually supplied when a kit of resistors is purchased, and we recommend buying such a kit so that various resistances can be tried. Such trial and error of resistance values is inevitable, so having a variety of resistors is convenient. In choosing the resistance it should be noted that if the resistance is too low the turbine output might be tasked with too much of a load, inhibiting the turbine rotor from even beginning to spin. On the other hand, if the resistance is too high then the turbine rotor might be allowed to spin so fast that the rotation may stall or the blades will fling off the rotor. A reasonable resistance to start with is 500 ohms, and resistance can be decreased if the rotor spins too fast.
A more complex issue arises in resistor selection in a phenomena called impedance matching. Impedance matching is a concept for transferring the maximum amount of electrical energy from a source to a load, which occurs when the resistance of the generator matches the resistance of the load. We found the matching condition to occur at between 400 to 500 ohms for the #71427c01 generator. For the KidWind generator the best choice of load resistance is 100 ohms. However, in the official KidWind competition the load resistance is preselected by the testing setup at 30 ohms, so there is no design choice to make regarding load resistance.
The second choice to make in specifying a resistor is its power-handling capability, measured in watts. Common power-handling specifications for resistors are 1/8, 1/4, and 1/2 watt. If the power generated by the turbine exceeds the resistor’s capability, then the resistor could burn out and be destroyed. This burnout is not really spectacular nor a safety hazard, but should nonetheless be avoided. We’ve seen in excess of 1/4 watt from a #71427c01 LEGO generator, so a 1/2-watt resistor should be selected. In summary, for the #71427c01 LEGO generator the resistor to use is 470 ohms, 1/2 watt. Other generators will require some trial and error to find the best resistor. If a non-optimum impedance-matching resistor is used, everything will still work, but the power from the turbine won’t be as high as it could be.
That is, the voltage is squared, then divided by resistance, giving turbine power output in units of watts.
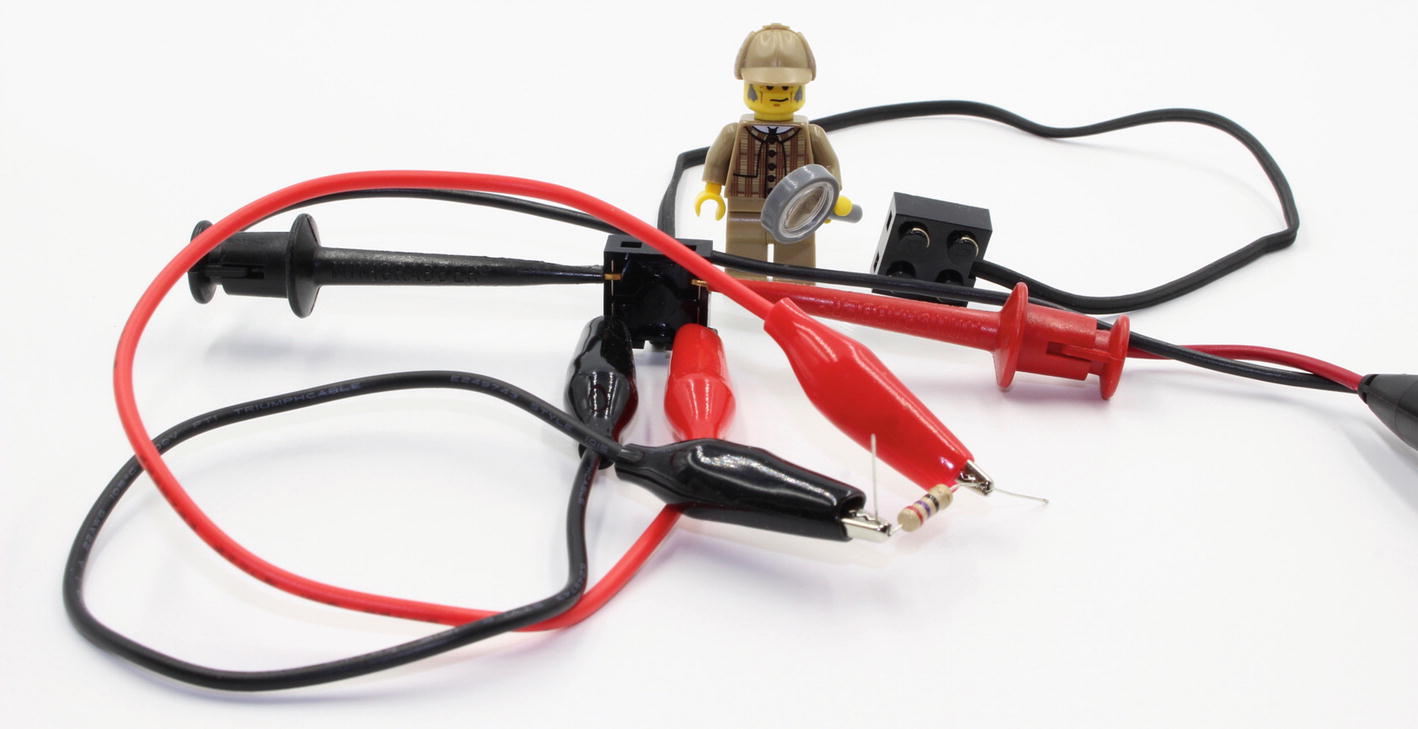
LEGO-based Meter
The #bb491 Energy Display gives readings of voltage, current, and power coming into the meter
Assessing Turbine Performance
Turbine Design Parameters Are Entered into a Table And Resulting Output Measured Values of Voltage and Power Are Recorded
Generator type | LEGO #71427c01 |
|---|---|
Blade type | 26 studs long. Airfoil ribs of #50950 3x1 Curve on leading edge and #61678 4x1 Curve on trailing edge. |
Blade pitch | 67.5 degrees |
Number of blades | 3 |
Direction of blade rotation | Counterclockwise |
Gearbox design | 40:24 Technic gear ratio |
Test fan orientation | Highest speed setting, 1.5 m from turbine, center of fan in line with center of turbine rotor |
Load resistance | 470 ohms |
Measured output voltage | 10.2 volts |
Measured output power | 221 milliwatts |
Relationship Between Power and Energy
Power , measured in tests such as that in Table 6-1, is the rate at which energy is created with time. Sometimes the quantity of energy, rather than power, is of interest. For example, a homeowner’s electric utility power bill is for energy used over the course of a month. Also, in some turbine-design competitions the amount of energy produced over a certain amount of time is the basis for judging. The KidWind competition judges the amount of energy delivered into a 30-ohm load over a 60-second period after test fans are turned on. Measuring energy is easy with the #bb491 Energy Display—it’s the main number displayed on the device, shown in the unit of joules.
Calculating Energy Generated Within 60 Seconds of the Start of a Test; Includes Entering Power Measurements at Intervals Indicated in Column 1
TIME AFTER FAN STARTS (s) | MEASURED POWER (mW) | ENERGY (mJ) |
|---|---|---|
5 | 5 x column 2 = | |
10 | 5 x column 2 = | |
15 | 5 x column 2 = | |
20 | 5 x column 2 = | |
30 | 10 x column 2 = | |
40 | 10 x column 2 = | |
50 | 10 x column 2 = | |
60 | 10 x column 2 = | |
TOTAL ENERGY = SUM OF ABOVE = |
Automated Energy Measurement
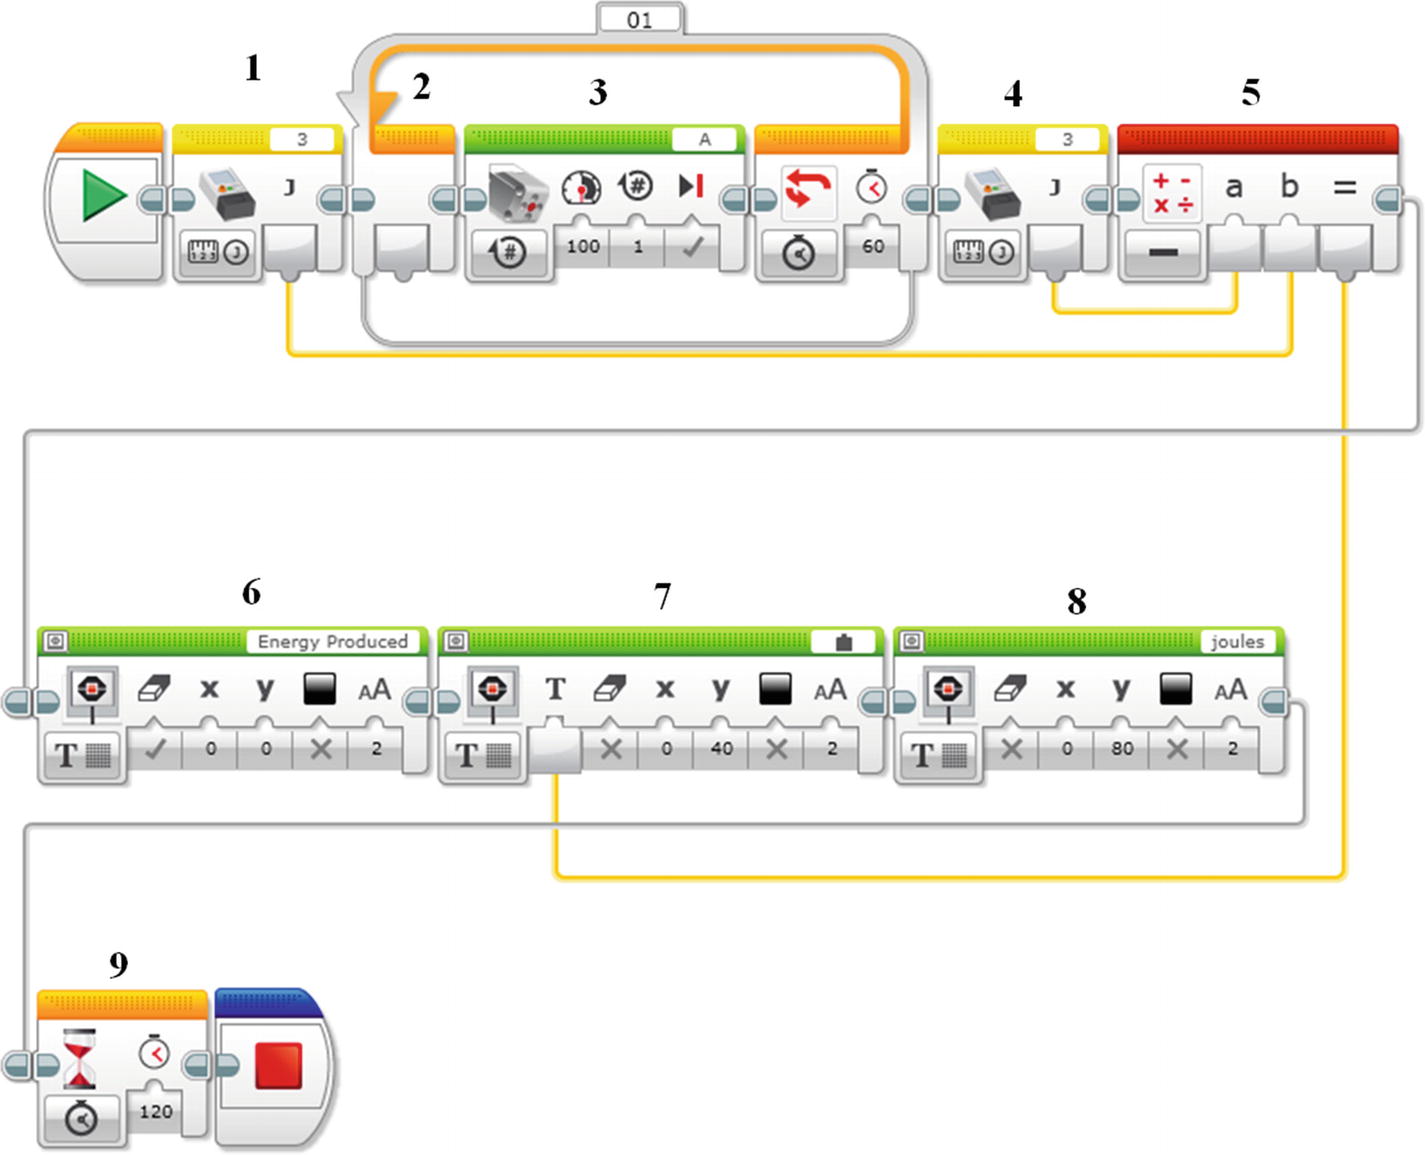
Programming block
1. Energy Meter Block: Reads the #bb491 Energy Display for energy stored in the #89668 Rechargeable Battery before the test begins. For the Energy Meter to function properly the stored energy before the test should be at least 1 joule. In other words, the test won’t work well if the rechargeable battery is discharged. Similarly, a fully charged battery of 100 joules won’t function properly in the test.
2. & 3. Loop Block: Activates the test fan via the dSwitch device for 60 seconds. The length of the test can be altered as desired. A Medium Motor block is being repurposed here to control the dSwitch.
4. Energy Meter Block: Reads the #bb491 Energy Display for energy stored in the #89668 Rechargeable Battery after the test fan has been shut down.
5. Math Block: Subtracts the initial battery charge value from the final battery charge value.
6. Display Block: Prints “Energy Produced” on the display.
7. Display Block: Indicates the value calculated in Block 5.
8. Display Block: Shows the units of energy.
- 9. Wait Block: Pauses the program for 120 seconds to allow the user to view the result before the program shuts down.
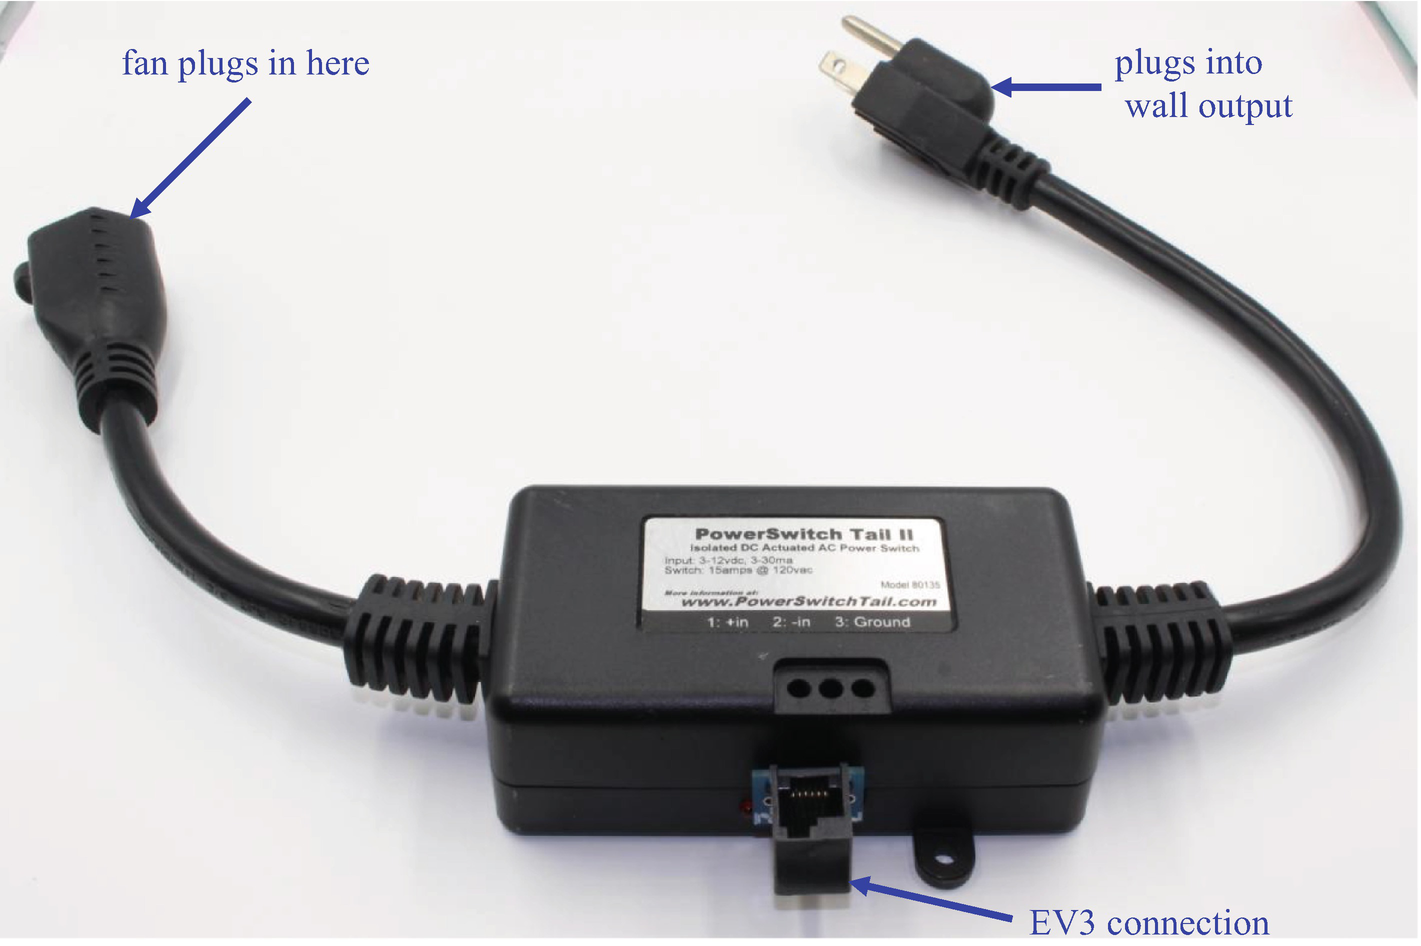 Figure 6-5
The dSwitch can activate the test fan under Mindstorms EV3 control
Summary
This chapter showed how to measure the power output from a turbine by connecting an electrical load in the form of a resistor. Guidelines were given for selecting the specifications of the resistor. A means to measure voltage produced by the turbine across the load resistor was described, along with the equation for converting voltage to power. Energy, rather than power, is sometimes the desired measurement from a turbine, so the conversion from power to energy was shown. As an alternate to a manual calculation of power and energy, use of the LEGO #bb491 Energy Display was described to make automated measurements. In the next chapter, the horizontal-axis wind turbine will be made ready for use outdoors with the addition of a steering vane.