The Query Store captures the history of queries, their plans, and statistics. It allows DBAs to easily view the plans that were used by queries and troubleshoot performance issues. In this chapter, we will discuss how Query Store can be enabled and configured. We will also examine how the Query Store can be used to diagnose and resolve performance issues.
Enabling and Configuring Query Store
Create the Chapter22 Database
Enable Query Store
Query Store SET Options
SET Option | Description |
|---|---|
ON | Enables the Query Store for the specified database. |
OFF | Disables the Query Store for the specified database. |
CLEAR | Clears the contents of the Query Store. |
OPERATION_MODE | Can be configured as READ_ONLY, or the default of READ_WRITE. When configured as READ_WRITE, data is written to the Query Store and can be read from the Query Store. When set to READ_ONLY, data can still be read from the Query Store, but no further data will be written to it. The Query Store will automatically switch to READ_ONLY, if it runs out of space for storing new data. |
CLEANUP_POLICY | Accepts STALE_QUERY_THRESHOLD_DAYS and a number of days. This determines how many days data for each query should be retained. |
DATA_FLUSH_INTERVAL_SECONDS | Query Store data is flushed to disk asynchronously. DATA_FLUSH_INTERVAL_SECONDS specifies how frequently data should be flushed. |
MAX_STORAGE_SIZE_MB | Specifies the maximum amount of space that can be used by Query Store data. If this value overflows, the Query Store will switch to READ_ONLY operational mode. |
INTERVAL_LENGTH_MINUTES | Specifies the time interval at which runtime execution statistics data is aggregated. |
SIZE_BASED_CLEANUP_MODE | Specifies if an automatic cleanup is triggered, when the Query Store reaches 90% of its maximum size threshold. Can be set to AUTO or OFF. When set to AUTO, the oldest, least expensive queries will be removed, until the size drops to around 80% of the Query Store’s maximum size threshold. |
QUERY_CAPTURE_MODE | Specifies which queries data should be captured for. Can be configured as ALL, NONE, AUTO, or CUSTOM. When set to ALL, statistics will be captured for all queries. When set to NONE, statistics will only be captured for queries which already exist in the Query Store. When configured as AUTO, SQL Server will capture statistics for the most expensive queries, based on execution count and resource utilization. When configured as CUSTOM, then you will have more granular control over which queries have statistics captured. When CUSTOM is specified, QUERY_CAPTURE_POLICY should also be specified. |
MAX_PLANS_PER_QUERY | Specifies the maximum number of plans that will be captured for each query, defaulting to 200. |
WAIT_STATS_CAPTURE_MODE | Specifies if wait statistics should be captured for queries. This is, of course, very useful, but comes at the expense of extra disk space consumed. |
QUERY_CAPTURE_POLICY | Can be used when QUERY_CAPTURE_MODE is set to CUSTOM. Please see Table 22-2 for details of the available options that can be passed. |
QUERY_CAPTURE_POLICY Options
Option | Description |
|---|---|
STALE_CAPTURE_POLICY_THRESHOLD | Specifies an evaluation period, which is used by the other parameters, to determine if a query should have its statistics captured. Can be specified in hours, or days |
EXECUTION_COUNT | Specifies the minimum number of executions within the evaluation period that should occur, for a query to be captured |
TOTAL_COMPILE_CPU_TIME_MS | Specifies the total amount of CPU Compilation Time within the evaluation period that should occur, for a query to be captured |
TOTAL_EXECUTION_CPU_TIME_MS | Specifies the total amount of CPU Execution Time within the evaluation period that should occur, for a query to be captured |
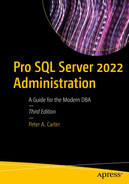
Configure the Query Store
Query Store Properties tab
Working with Query Store Data
Query the Chapter22 Database
Query Store Reports
View Regressed Queries
View Overall Resource Consumption
View Queries with Forced Plans
View Queries with High Variation
Query Wait Statistics
View Tracked Queries
These reports can be accessed by drilling through Databases ➤ [Database Name] and then selecting the appropriate report from the context menu of the Query Store node. In this chapter, we will examine some of the reports that I find most useful, but I encourage you to experiment with all of them.
Because of the nature of the reports, when you first set up Query Store, there will be very little data. The data points will grow as time moves forward after Query Store is enabled.
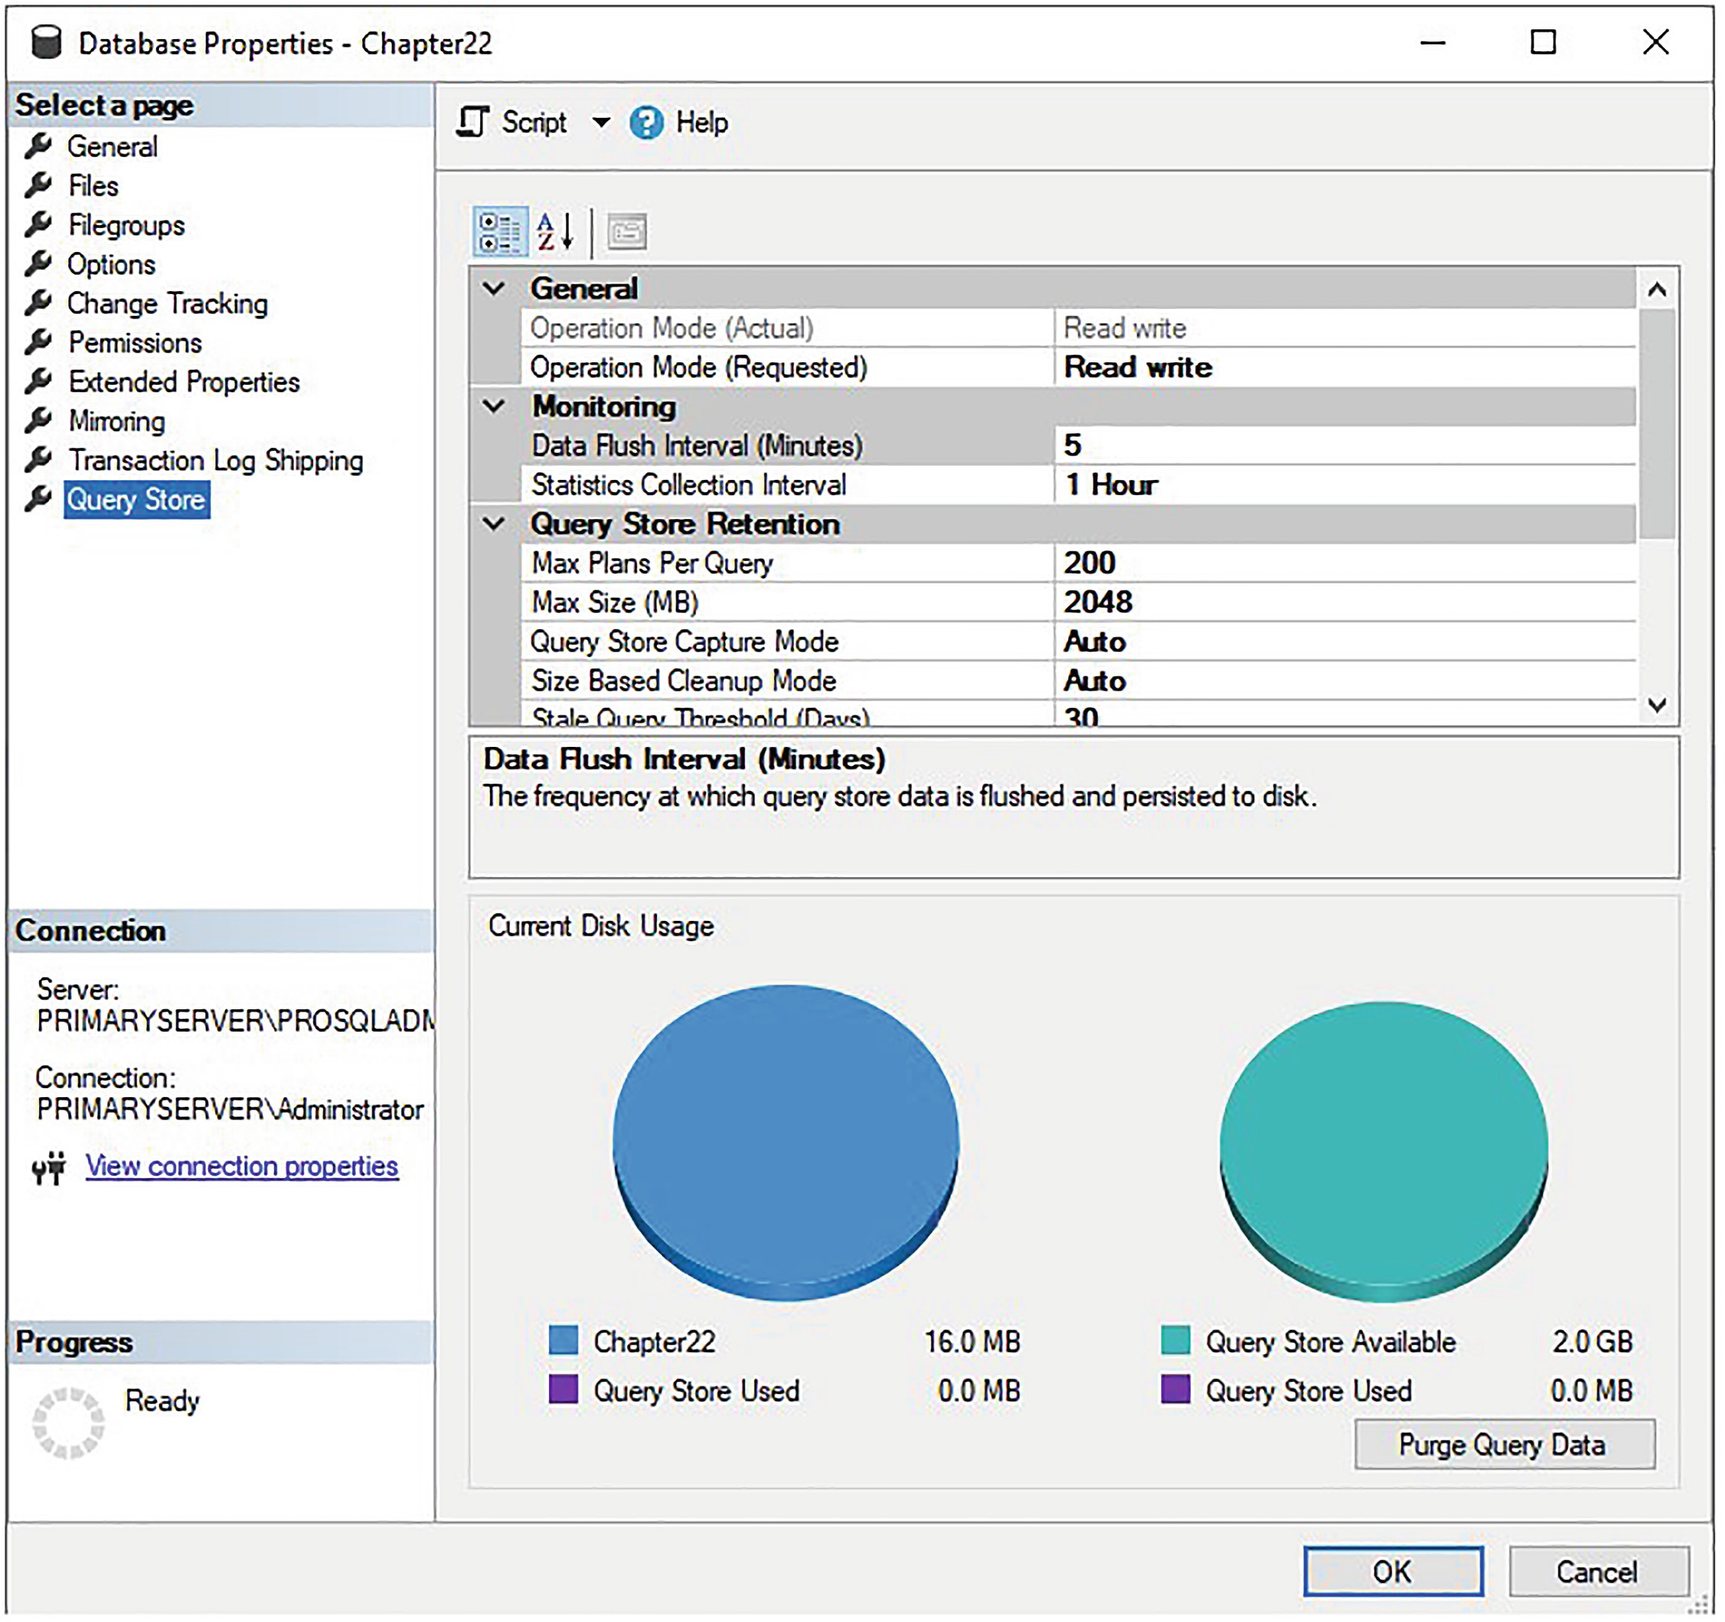
Overall Resource Consumption
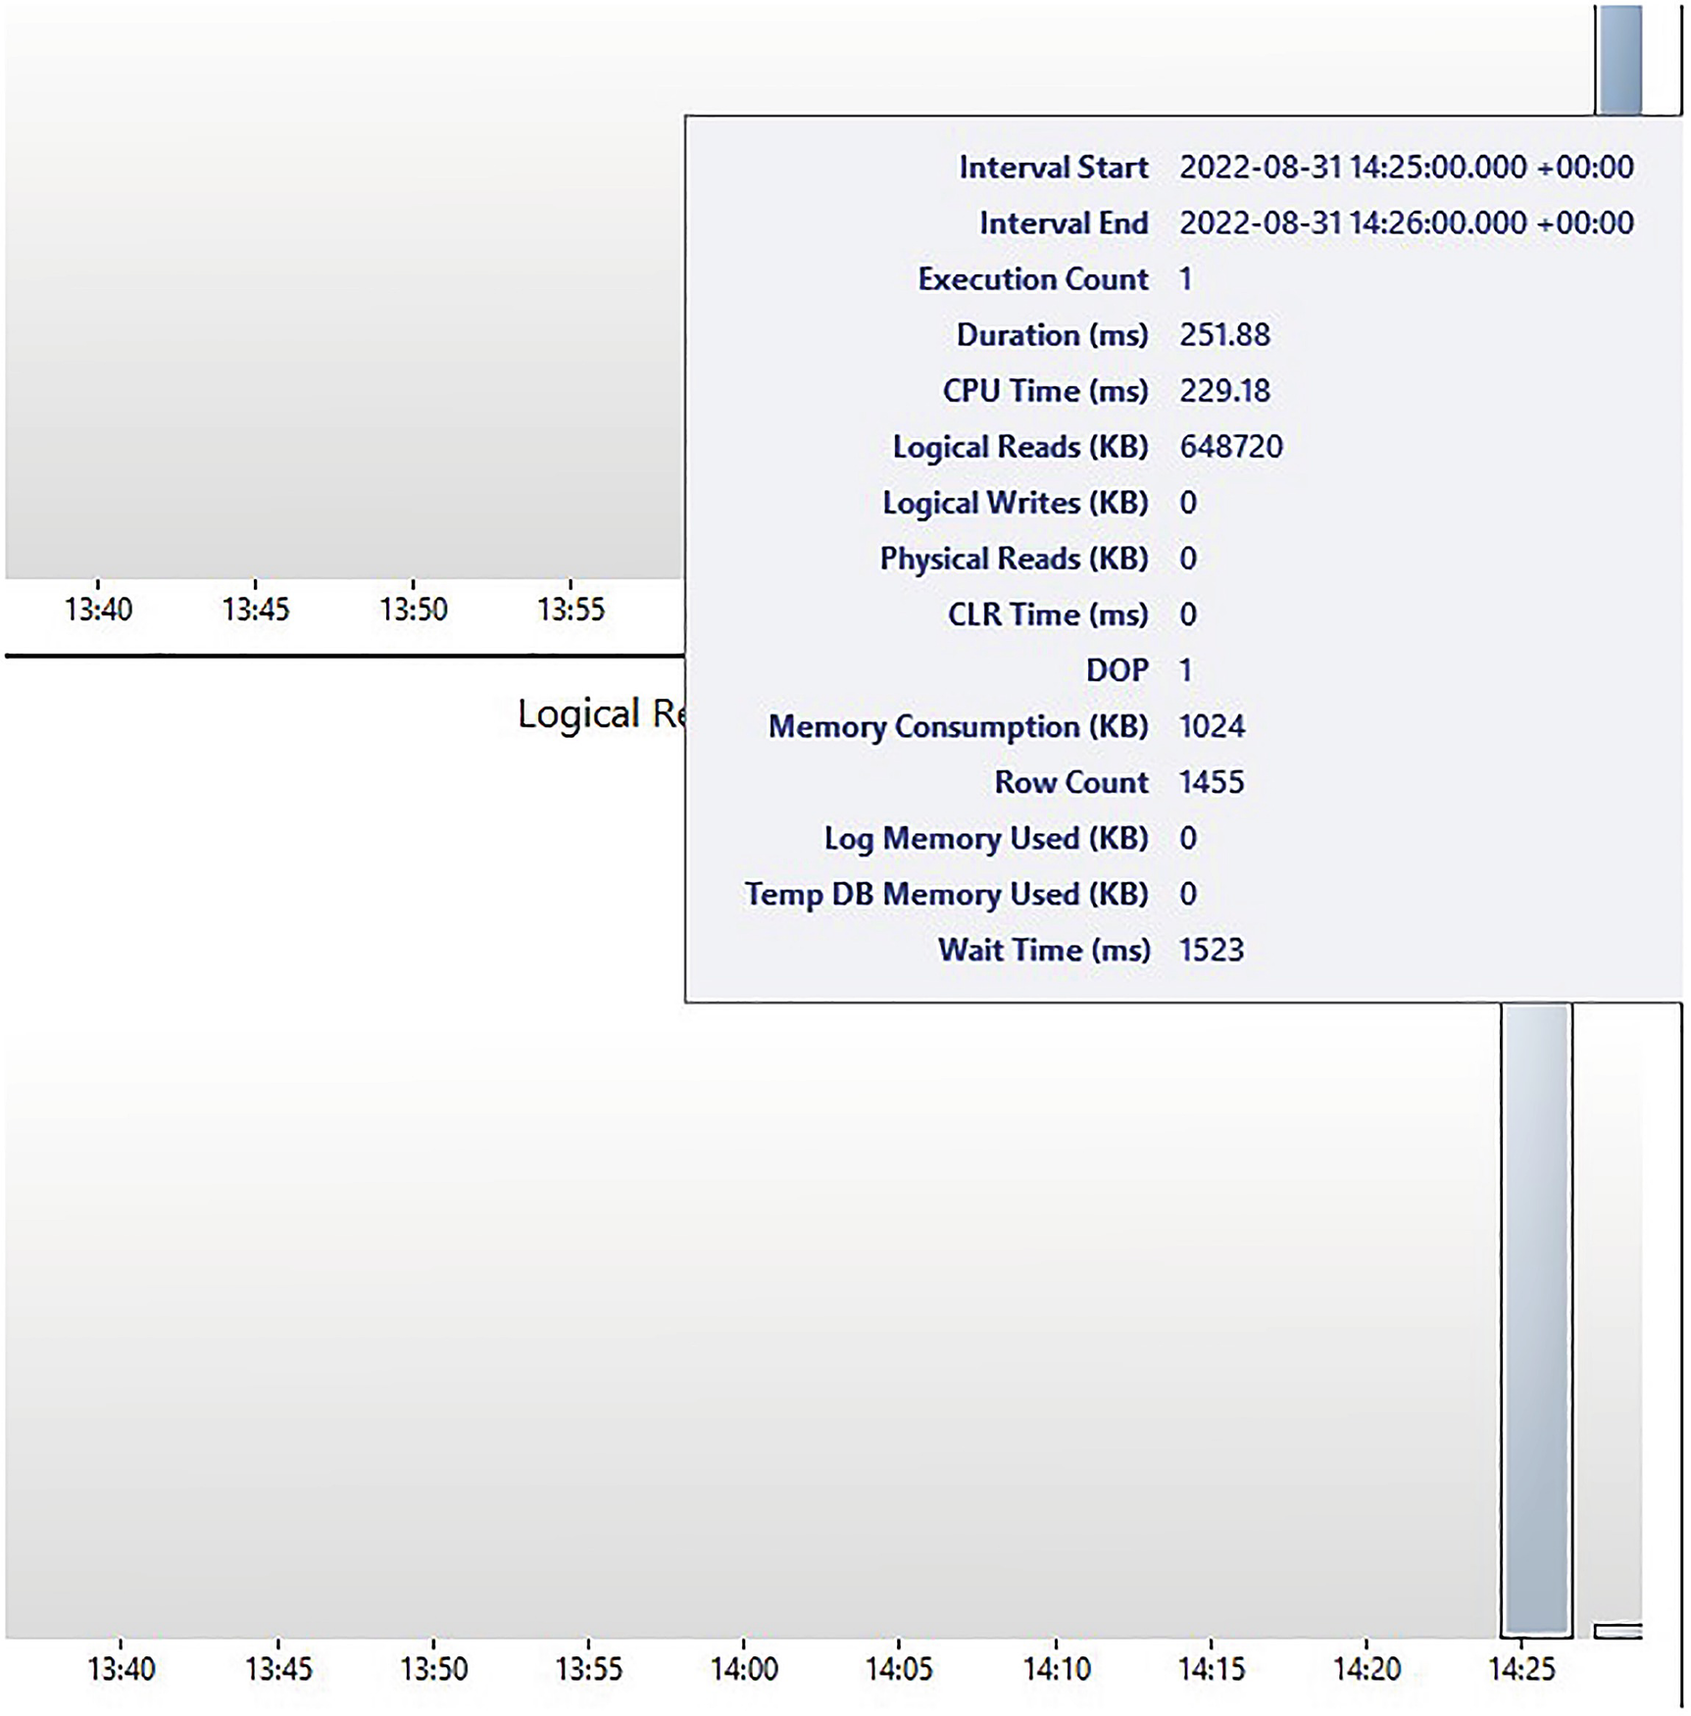
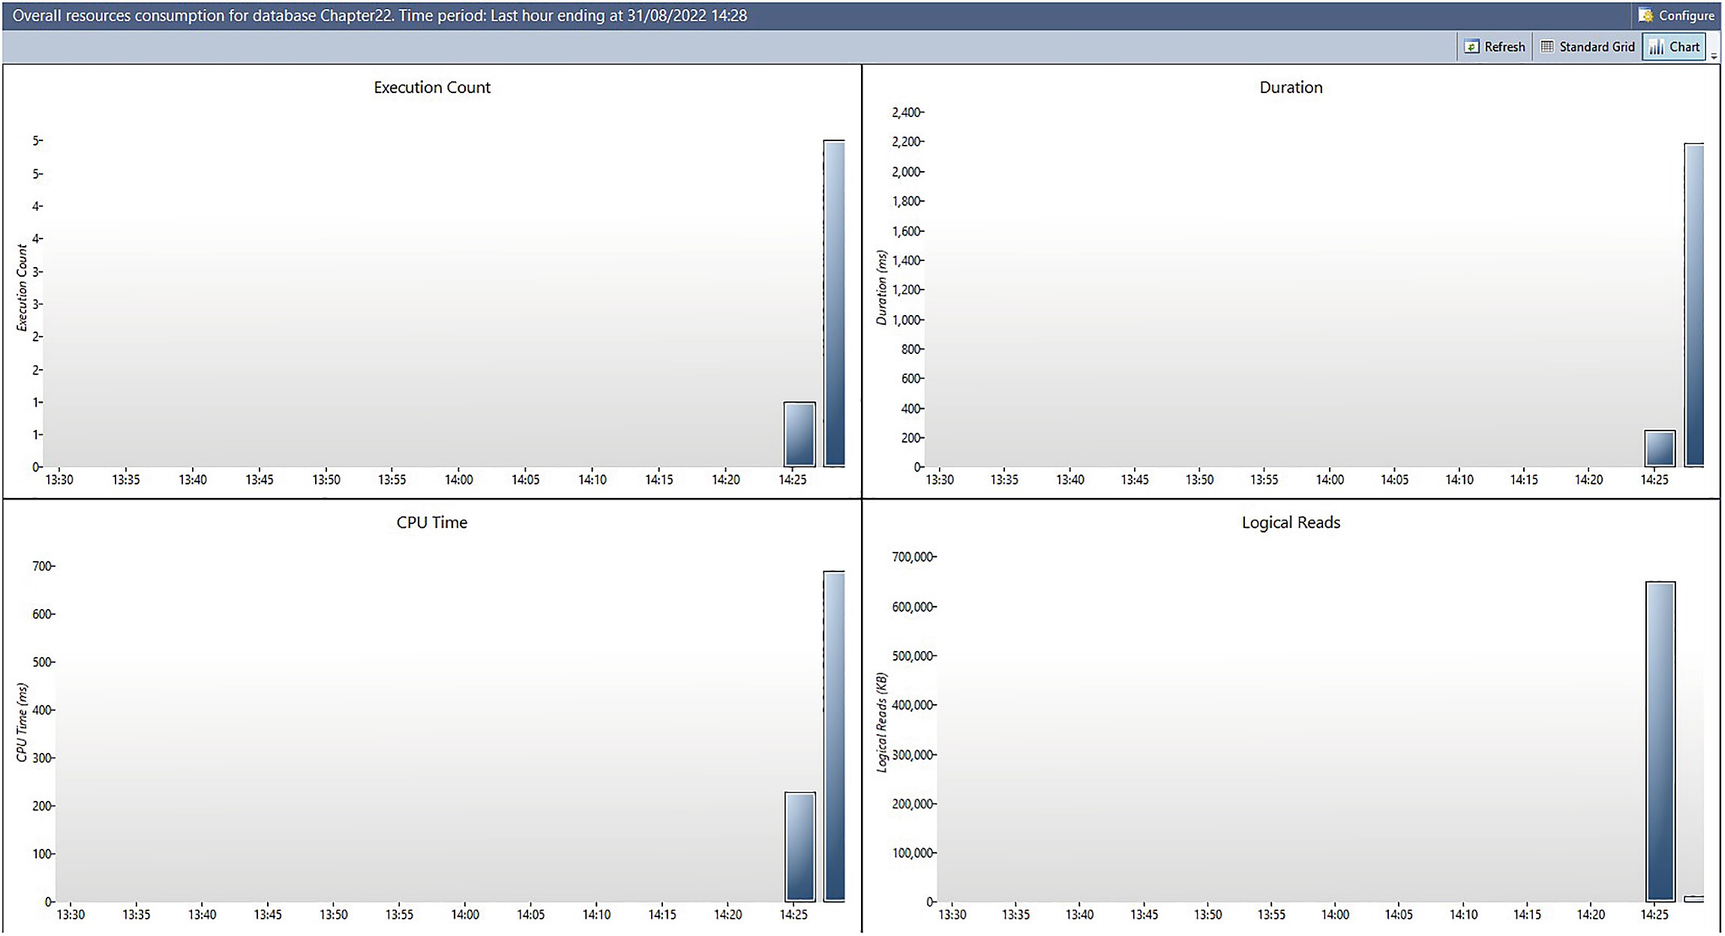
Viewing additional details
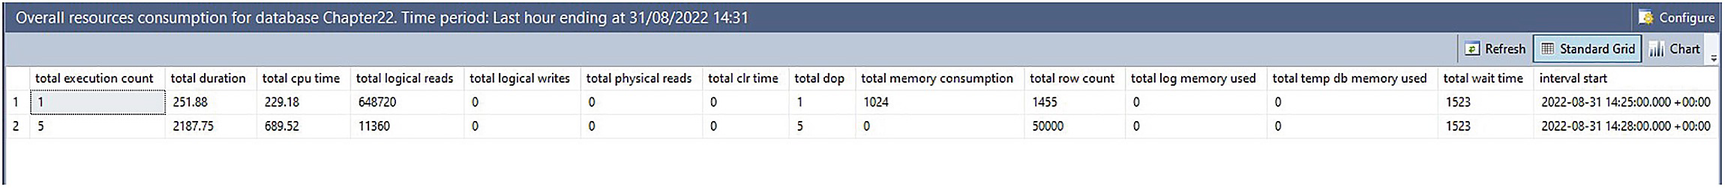
Standard grid view
You will notice that the execution count is far higher than the number of queries we have run. This is because SQL Server runs queries in the background, as part of many different processes, including queries that are run when you navigate SSMS.
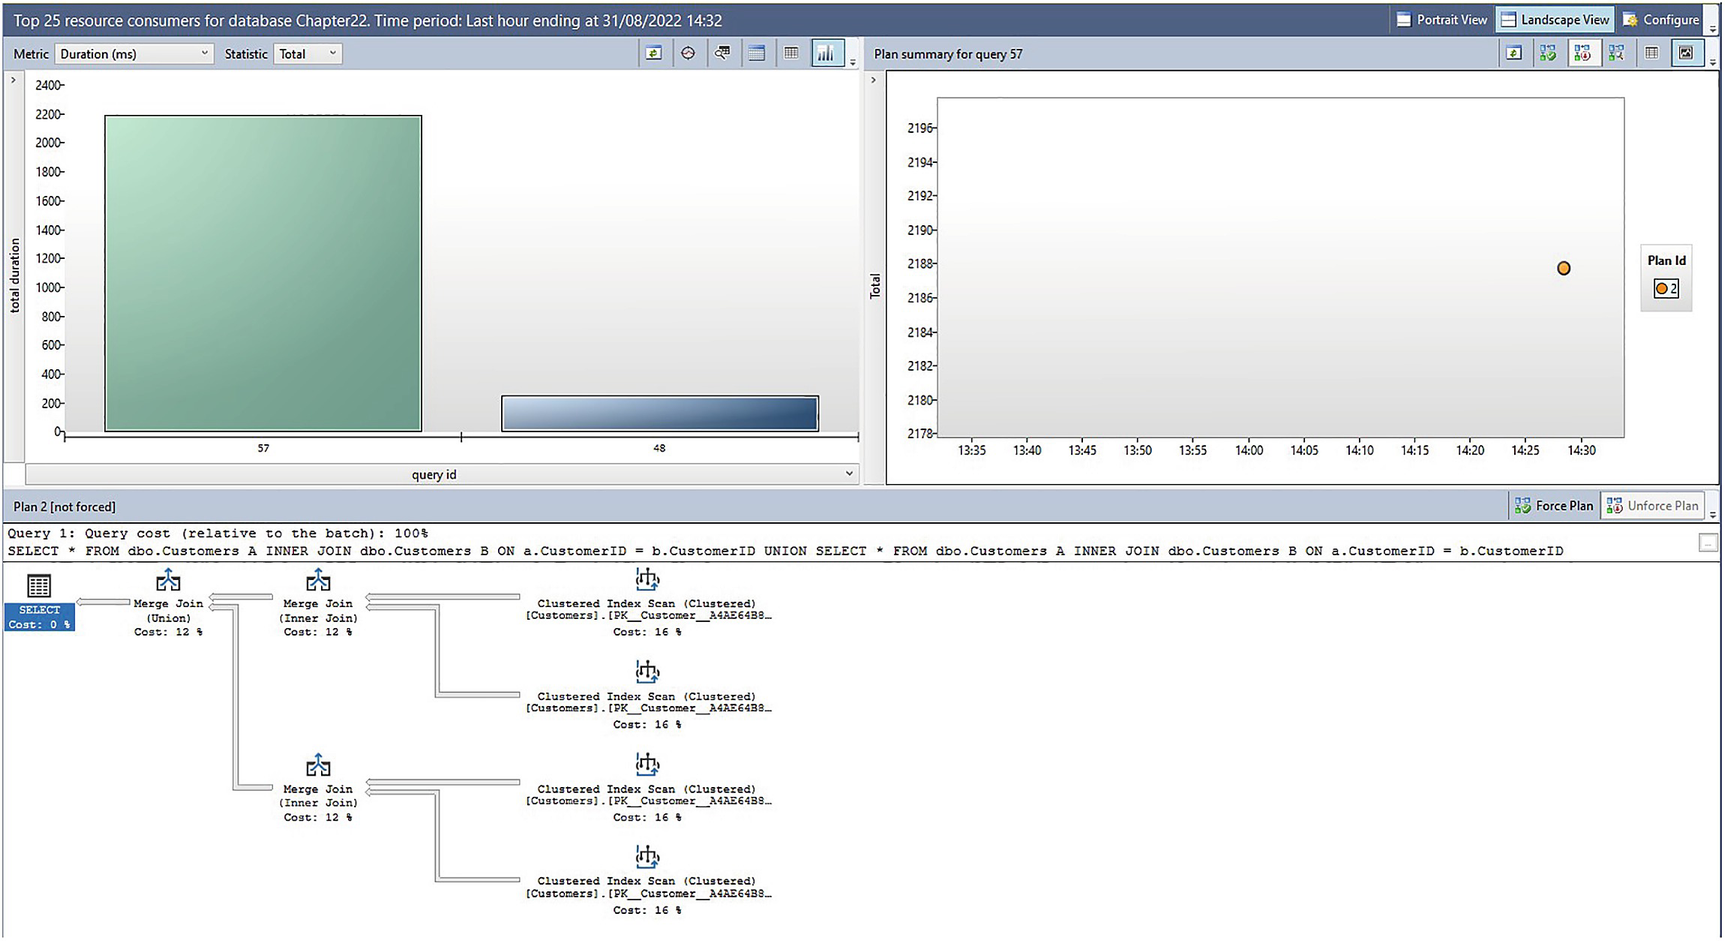
Top Resource Consumers
The top-right corner of the report shows a scatter chart, detailing resource utilization and execution time of each plan. This is helpful when a query has been executed using multiple plans, as you can easily assess the most efficient plans for a query.
The bottom half of the plan shows the accrual execution plan that was used. As with any other graphical query plan representation in SSMS, hovering over a physical operator will show cost information for that operator.
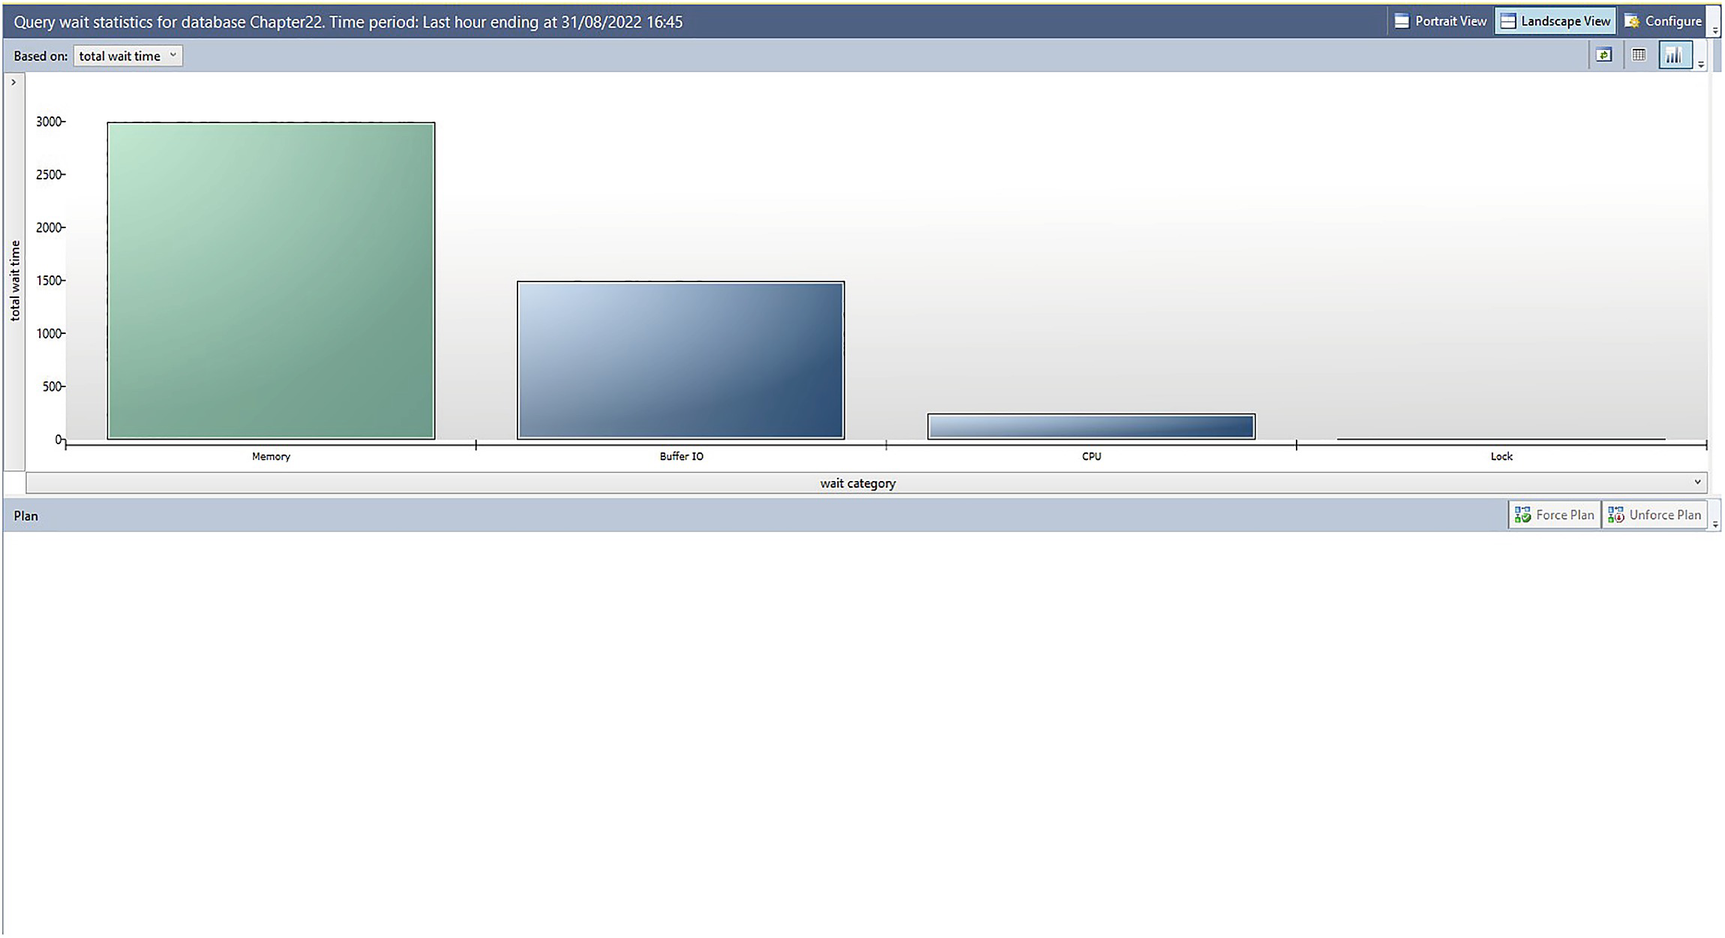
Query Wait Statistics report
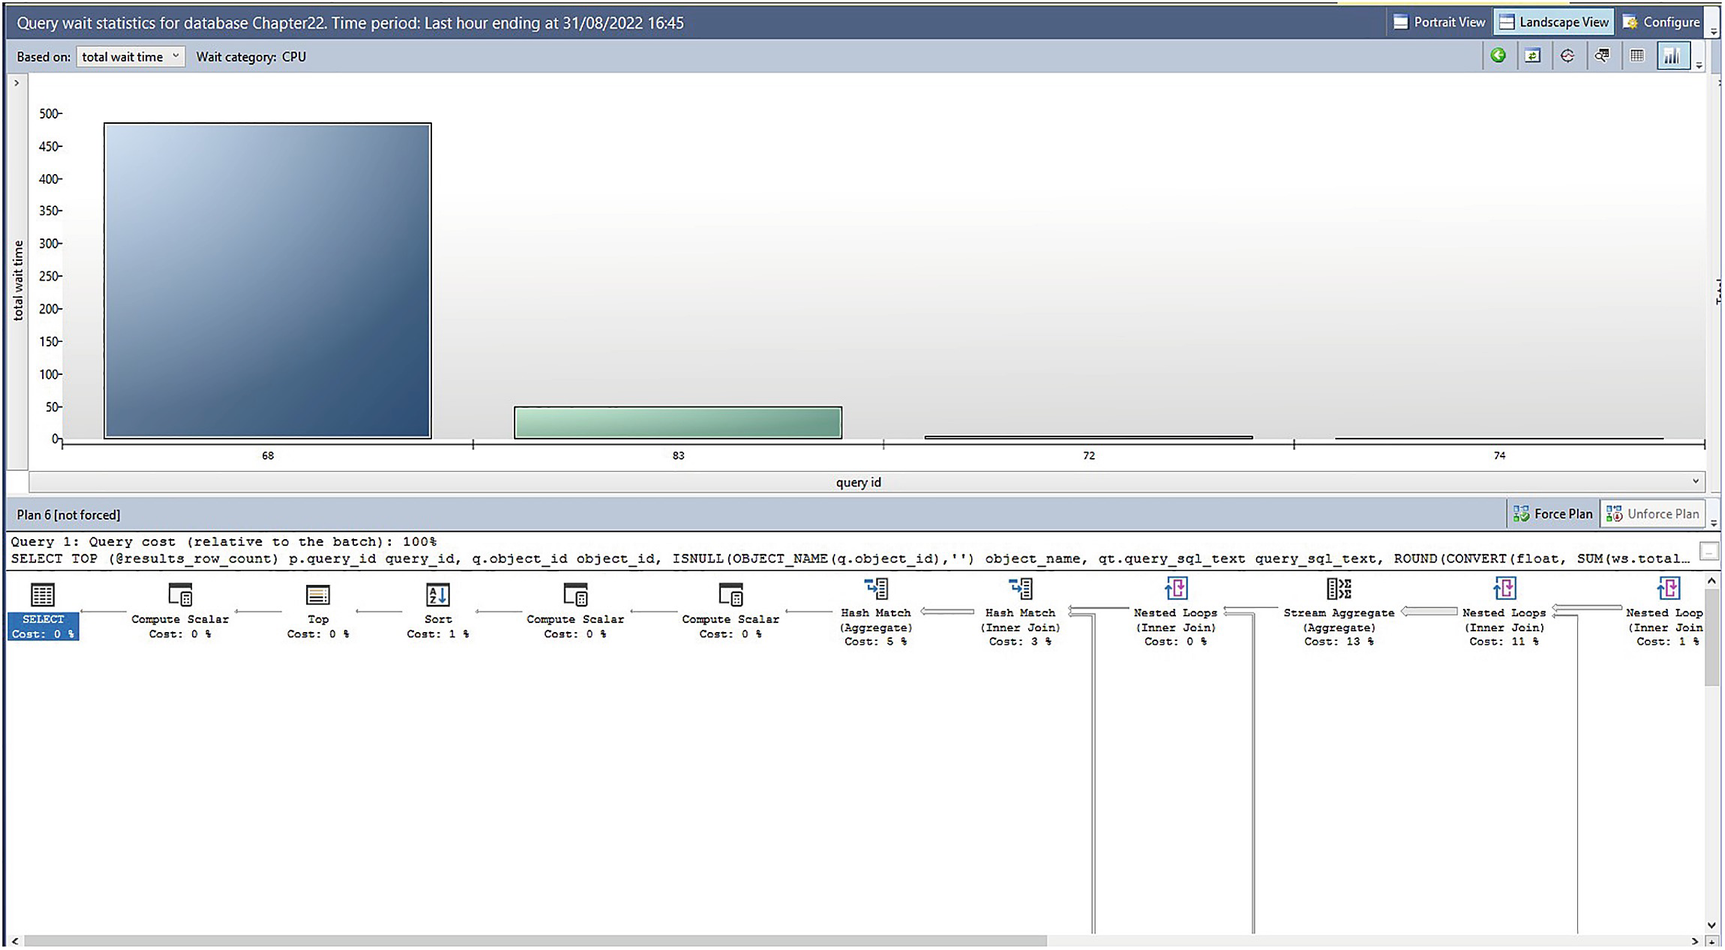
CPU drill-through report
By default, the top half of the grid will show the most expensive queries (labelled by Plan ID), based on Total Wait Time, but as you can see, the Based on drop-down list can be changed to base the results on average, min, max wait time, or the standard deviation.
The lower half of the report shows the graphical representation of the Query Plan that has been selected in the top half of the report.
Query Store T-SQL Objects
Query Store Catalog Views
Catalog View | Description |
|---|---|
Query_store_plan | Stores information about every query plan that is associated with a query. |
Query_store_query | Stores query information and aggregated runtime statistics. |
Query_store_wait_stats | Stores wait statistic details. Please see Table 22-4 for mappings of each wait type. |
Query_store_query_text | Stores the SQL handle and SQL text of each query. |
Query_store_runtime_stats | Stores the runtime statistics for each query. |
Wait Statistics Mappings
Wait Category | Wait Types |
|---|---|
CPU | SOS_SCHEDULER_YIELD |
Worker Thread | THREADPOOL |
Lock | LCK_M_* |
Latch | LATCH_* |
Buffer Latch | PAGELATCH_* |
Buffer IO | PAGEIOLATCH_* |
SQL CLR | CLR* SQLCLR* |
Mirroring | DBMIRROR* |
Transaction | ACT* DTC* TRAN_MARKLATCH_* MSQL_XACT_* TRANSACTION_MUTEX |
Idle | SLEEP_* LAZYWRITER_SLEEP SQLTRACE_BUFFER_FLUSH SQLTRACE_INCREMENTAL_FLUSH_SLEEP SQLTRACE_WAIT_ENTRIES FT_IFTS_SCHEDULER_IDLE_WAIT XE_DISPATCHER_WAIT REQUEST_FOR_DEADLOCK_SEARCH LOGMGR_QUEUE ONDEMAND_TASK_QUEUE CHECKPOINT_QUEUE XE_TIMER_EVENT |
Preemptive (Preemptive IO) | PREEMPTIVE_* |
Service Broker | BROKER_* |
Transaction Log IO | LOGMGR LOGBUFFER LOGMGR_RESERVE_APPEND LOGMGR_FLUSH LOGMGR_PMM_LOG CHKPT WRITELOG |
Network IO | ASYNC_NETWORK_IO NET_WAITFOR_PACKET PROXY_NETWORK_IO EXTERNAL_SCRIPT_NETWORK_IOF |
Parallelism | CXPACKET EXCHANGE |
Memory | RESOURCE_SEMAPHORE, CMEMTHREAD CMEMPARTITIONED, EE_PMOLOCK MEMORY_ALLOCATION_EXT RESERVED_MEMORY_ALLOCATION_EXT MEMORY_GRANT_UPDATE |
User Wait | WAITFOR WAIT_FOR_RESULTS BROKER_RECEIVE_WAITFOR |
Tracing | TRACEWRITE SQLTRACE_LOCK SQLTRACE_FILE_BUFFER SQLTRACE_FILE_WRITE_IO_COMPLETION SQLTRACE_FILE_READ_IO_COMPLETION SQLTRACE_PENDING_BUFFER_WRITERS, SQLTRACE_SHUTDOWN, QUERY_TRACEOUT TRACE_EVTNOTIFF |
Full Text Search | FT_RESTART_CRAWL FULLTEXT GATHERER MSSEARCH FT_METADATA_MUTEX FT_IFTSHC_MUTEX FT_IFTSISM_MUTEX FT_IFTS_RWLOCK FT_COMPROWSET_RWLOCK FT_MASTER_MERGE FT_PROPERTYLIST_CACHE FT_MASTER_MERGE_COORDINATOR PWAIT_RESOURCE_SEMAPHORE_FT_PARALLEL_QUERY_SYNC |
Other IO | ASYNC_IO_COMPLETION, IO_COMPLETION BACKUPIO, WRITE_COMPLETION IO_QUEUE_LIMIT IO_RETRY |
Replication | SE_REPL_* REPL_*, HADR_* PWAIT_HADR_*, REPLICA_WRITES FCB_REPLICA_WRITE, FCB_REPLICA_READ PWAIT_HADRSIM |
Log Rate Governor | LOG_RATE_GOVERNOR POOL_LOG_RATE_GOVERNOR HADR_THROTTLE_LOG_RATE_GOVERNOR INSTANCE_LOG_RATE_GOVERNOR |
Idle and User Wait are unlike other Wait Type Categories, in the respect that they are not waiting for a resource, they are waiting for work to do.
Return Top 3 Wait Types
Resolving Issues with Query Store
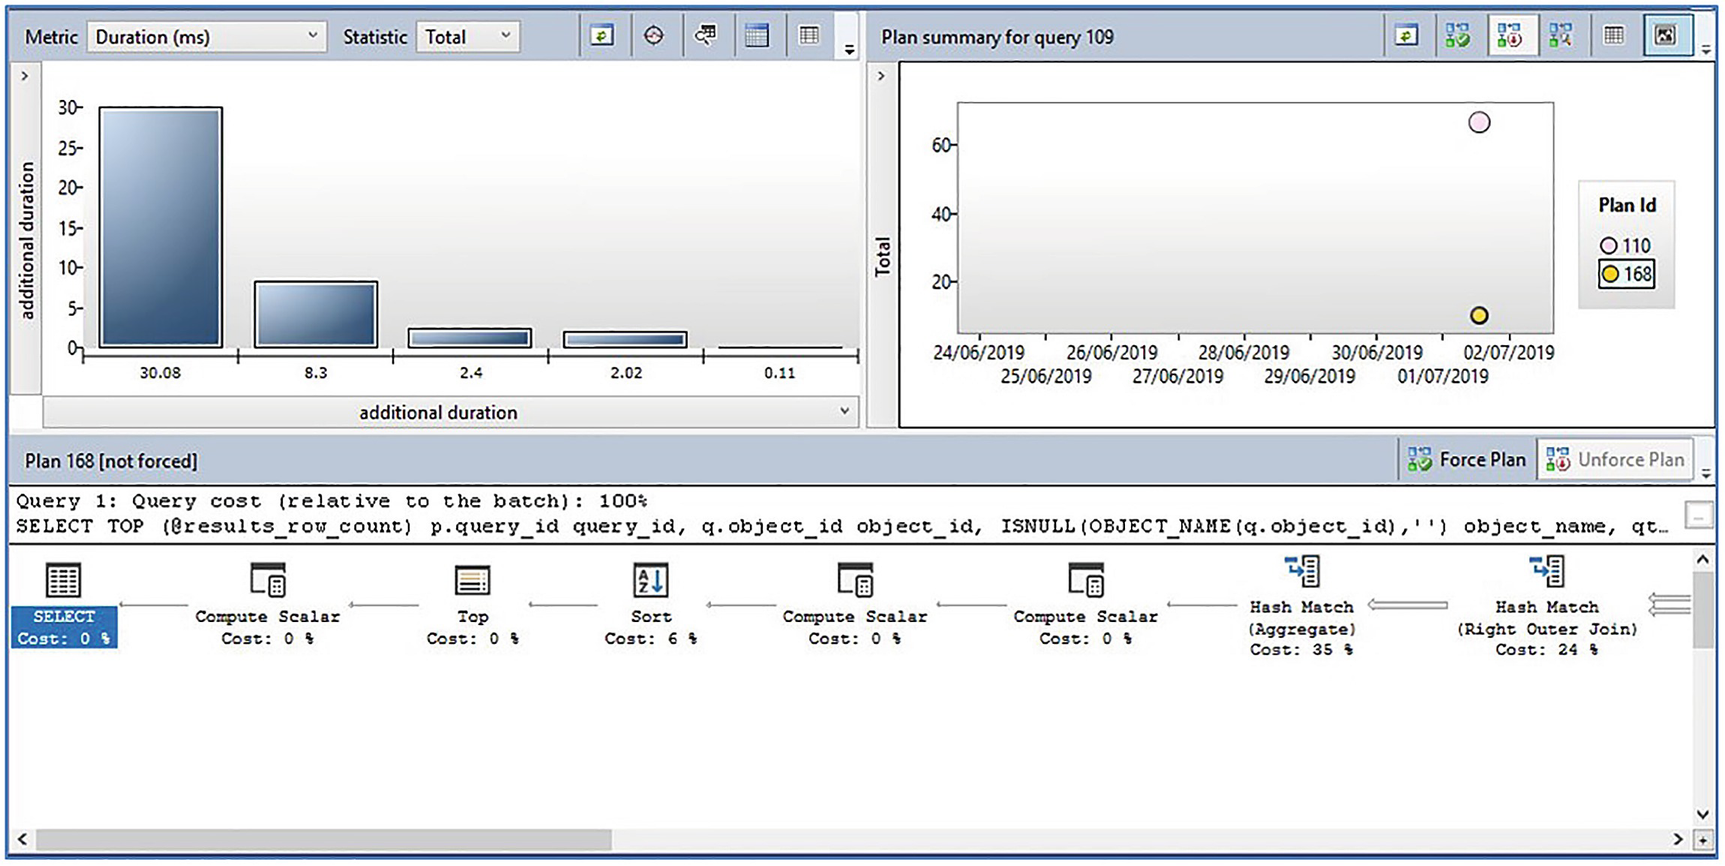
Regressed Query report
In this particular example, we can see that the query has run using two distinct plans and that the plan with an ID of 168 took significantly less time to execute than the plan with an ID of 110. Therefore, with the more efficient plan selected, we can use the Force Plan button, in the middle of the report, to ensure that the more efficient plan is always used to execute this query. Once we have used this feature, the Unforce Plan button will become active, allowing us to undo our action, if required.
The Force and Unforce buttons are available on all Query Store reports, where a specific plan is selectable.
Query Store Stored Procedures
Procedure | Description |
|---|---|
Sp_quey_store_flush_db | Flushes Query Store data to disk |
Sp_query_store_force_plan | Forces a query to use a specific plan |
Sp_query_store_unforce_plan | Removes a forced plan from a query |
Sp_query_store_reset_exec_stats | Clears the runtime statistics from the Query Store, for a specific query |
Sp_query_store_remove_plan | Removes a specific plan from the Query Store |
Sp_query_store_remove_query | Removes a query and all associated information from the Query Store |
Unforce a Query Plan
Query Store Hints
Unlike many other languages, T-SQL is a descriptive and declarative language. This means, when writing a query, that instead of telling the database engine exactly what to do, you describe the results that you want to receive and the query optimizer figures out the best way to deliver those results. The query optimizer is incredibly good at deciding the best way to do something, but if it does make a mistake, it can have a negative impact on query performance.
This is where query hints come in. A query hint allows you to force the optimizer down a specific route. For example, you might tell it that it should recompile the query every time it runs. Alternatively, you may tell it to always use a certain type of physical join operation, or to always use a specific MAXDOP.
The challenge with query hints is that you are not always able to modify the code, which means that you cannot add a query hint to the query. This may be because the code belongs to a third party and support agreements do not allow for code changes, or it could be because there is an urgent performance issue and code release procedures are simply too cumbersome to resolve the issue in a timely manner.
To address this, SQL Server introduced plan guides, where you could specify a statement and one or more query hints that should always be applied, whenever that query runs. You could even use plan freezing, where you specified the USE PLAN hint, and then pass a specific query plan that you wanted to be used. The problem with plan guides is that they are far from user friendly and generally required a highly experienced DBA to create them. SQL Server 2022 resolves this issue with query store hints, which give DBAs the opportunity to specify query hints in a much more friendly way.
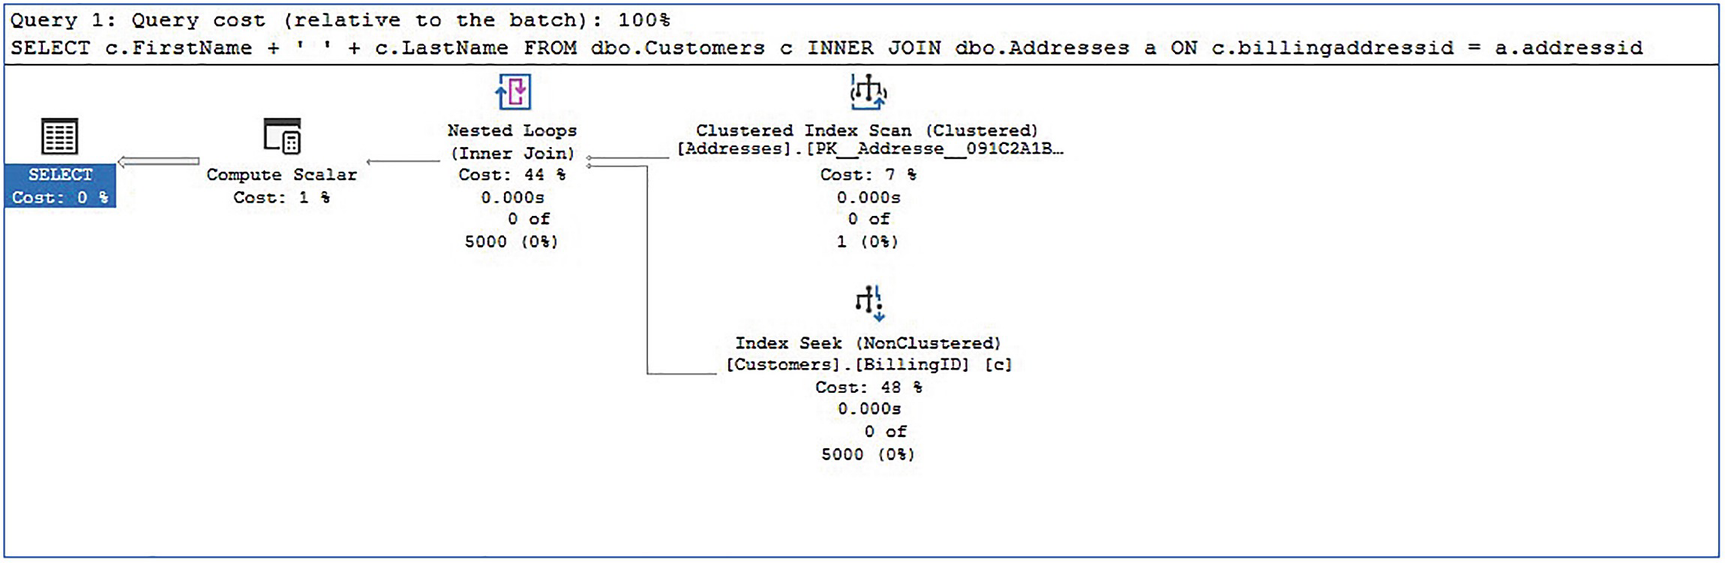
Suboptimal hash match
I have used a simple example to illustrate the concept. In reality, this specific plan would be highly unlikely to need a query hint, as Intelligent Query Processing would alter the physical join operator dynamically, based on the inputs.
Because the optimizer is so good, I always advise working with the optimizer, rather than against it. Therefore, in this case, instead of using a query hint to force the optimizer to use a Merge Join, which is the natural inclination of many DBAs, I would advise using query hints to tell the optimizer to use either a Merge Join operation or a Hash Match operation. This translates to “Nested Loops is wrong. Use anything except this.” The optimizer can then select the best option from its remaining choices.
Retrieve Query IDs
Apply a Query Store Hint
A nice safety feature of query store hints is that it will ignore any hint that stops it from running, as opposed to blocking the query. Therefore, you cannot inadvertently break a query. The query store hints will also override any query hints or plan guides that conflict with it.
Retrieve a List of Query Store Hints
Remove Query Store Hints
Summary
The Query Store is a very powerful feature of SQL Server, which allows DBAs to monitor the performance of specific queries and their plans. Because the data is flushed to disk, this means that the data persists, even after an instance is restarted.
Six standard reports are available, which allow DBAs to view information such as regressed queries, the most resource-intensive queries, or even wait statistics, by query.
As well as viewing problematic queries, DBAs can also force the most performant plan to be used. This can be achieved through the interactive reports, or via automation, using T-SQL. The automated approach would examine the Query Store data through the catalog views and then pass the relevant data to the parameters of system stored procedures.
SQL Server gives DBAs granular control over which queries are captured by Query Store. This is implemented with custom capture policies, where details such as execution count and execution time can be used to capture only the queries with the highest performance impact. This not only saves disk space but also avoids “noise” when working with the captured data.
In SQL Server 2022, query store has been enhanced to include query store hints, which make it easy and safe for a DBA to use query hints to resolve performance issues, without the need to edit the code. SQL Server 2022 also introduces the ability to use query store on Secondary Availability Replicas, but at the time of writing, this feature was in preview, and not supported for production workloads. Further discussion of Availability Groups can be found in Chapter 15.
SQL Server 2022 introduces query store enhancements, which allow for feedback mechanisms which can automatically optimize query performance. These feedback mechanisms are discussed in various chapters throughout this book.