Here at last we reach the point where things actually happen in the real world and – to the delight of business-folk – the real value is delivered. And here, often, one of the main tasks of architecture is to keep out of the way…
In the implementation stage of a conventional large project, the architecture is already supposed to be complete: all that’s left is to ensure compliance to the plan. The usual way to do this is via “gateway reviews”: at each stage the project-lead presents a formal statement of compliance, the architects review it and make various suggestions, the project-leads change their designs to take note of this masterful advice, and everyone is happy. That’s the theory, anyway, even if it doesn’t quite work out that way in practice.
One of my first jobs in enterprise-architecture consisted of reviewing project-plans to ensure compliance against “the architecture.” To say that we were hated by the developers was perhaps an overstatement, but none of us exactly relished our role as “architecture police”…
We did prove our value, many times over – such as when we found that three projects each wanted to place their own separate and incompatible RFID infrastructures into the same physical space, or when we showed that a tiny “glue-project” would add literally billions of value to the projects that it could link together. But it took us quite a while to realize that we needed to catch these architectural issues before they entered the implementation-phase. And for that to work, we needed all the players involved to recognize that architecture is everyone’s responsibility – not solely that of the architects.
We then realized that, to make this happen, we needed to change our role, from that of The Architect (with grandiose capital-letters in the job-title) to proponents and educators of a single qualitative idea – the idea of architecture.
Things work better when they work together, with clarity, with elegance, on purpose.
There are a fair few frills beyond that bald statement, of course, but that really is the point of everything that we do. It’s all about effectiveness: an overall melding of all of the various factors to arrive at an answer, a solution, a practice, or whatever, that is efficient, reliable, elegant, appropriate, and integrated. That’s what we do; that’s the “one idea” that we have and can share with everyone else in the enterprise.
Implementation-governance is one of the ways in which we share that “one idea” with others, but it’s essential to ensure that it’s not the only way that we’re seen to do so. Architecture is dynamic, not static; implementation takes time, which means that whatever we build our compliance against is going to change over time too. And since many of the best architectural ideas will arise from what happens right down at the point of action, we need to avoid the trap of deluding ourselves into a belief that because we have a better overview than most, we therefore have a better knowledge of everything than most: the plain fact is that we don’t. Architecture, and even design, may be a job for generalists, but implementation is a job for specialists – and we forget that fact at our peril.
So while we help other specialists with their implementations, it’s useful to ask about our specialism, our implementation. We may well have specialized in other areas in the past, which means that we should be able to do some of that detail-level design and implementation ourselves. But as architects, we would typically describe ourselves as generalists – hence we specialize in how to be a generalist. Our specialism is about thinking about how things work together and can work together in better ways, thinking about thinking, thinking about feelings too – anything that will help to make anything in the enterprise more effective. That’s our practice; that’s what we implement. And it’s useful to keep that in mind during this phase of the architecture cycle, where the focus is on implementation for real results in the real-time world.
Main Project: Implementing Architecture
One of the hardest parts of enterprise-architecture is explaining what we do, and how and why it is of value to the organization. Much of it is as much art or craft as it is science, which often will make it even harder to explain, precisely because it’s so personal in nature. And even in those parts of the discipline that look more like science, it’s easy to get lost in all the abstractions. Somehow we need to bring it back to that one key point: what do we do, and how do we do it?
Introduce a new conceptual tool for architecture: “Context-space mapping,” linking the OODA decision-cycle and SCAN-like sensemaking into the standard architecture-cycle
Introduce it in the form of text and visuals, using a “soft lines” approach and style for both
Illustrate systems-principles concepts such as recursion by using the tool itself, and its usage, as its own example
This won’t cover all of architecture, of course – only one small part of it, in fact. But it should be enough to help others understand what it is that we do, how we do it, and so on – which is the main point of this exercise.
As we saw earlier, it’s really about what building-architects call “meta-thinking,” to which we could also add meta-methodology, or even meta-architecture: thinking about thinking, observing the observing, architecting the architecture. Which is abstract. Again. So let’s take it out of the abstract and bring it down into the real world of practice.
Pick a context: any context. Something that’s of interest to you and your clients. It doesn’t even need to be a “problem.” Anything will do, though preferably something that you’re already working on at present.
The text reads the context.
The context

An illustration displays the following text. The problem space is on the left and the solution space is on the right. Both are interconnected to the context in the middle.
Problem-space and solution-space
We create an artificial separation between “problem” and “solution” to help us make sense: but it’s important to remember that it doesn’t actually exist. Neither is there any actual separation between ourselves and the context – that too is something that we invent for our convenience, or sanity, or suchlike. And it’s important, too, to remember that we also bring everything of ourselves into that “conversation,” including all of our background, our culture, our training, our assumptions, our history: we too are part of that context, interwoven with both “problem” and “solution.” In effect, we place ourselves as an intermediary between “problem” and “solution,” so as to bring them back into convergence again when we’ve made some kind of sense of what’s going on.
“Problem, meet solution; solution, meet problem; let’s all go have a chat over a coffee somewhere.” May not sound entirely rational, perhaps, but that’s actually an important point in itself: this part of the architecture process isn’t “rational,” in fact, by definition cannot be “rational,” because it creates the logic of the space within which the “rationality” of the chosen solution will operate. From chaos we create apparent order: it’s important to remember that that “order” is merely that which we choose to see, often something that we invent, and may not actually exist in the real world at all…
So everything within that context starts off as “the unknown,” a near-random collection of facts, figures, and fragments that we acquire by any means available to us. As the sensemaking process begins, it’s an unordered, disordered mess: somehow we have to make sense of it, to come to decisions about what to do with it, and then take action. We observe; orient; decide; and act.
One of our options may be to take no action, of course. But ideally that “non-action” needs to be something that we choose to not-do, rather than a non-choice made for us by default.
But how does that actually work? We go back to the context again: Observe: what can we see? Orient: what’s going on? Decide: what do we do about it? Act: do it.
Observe. Orient. Decide. Act. Observe. Orient. Decide. Act. Again. And again. And again. Fast. Faster. And faster. Until we’re aware of how it all happens, right here, right now, in real-time.
Enterprise-architecture, in real-time. Agile enterprise-architecture.
For architects, the Observe part is usually quite easy: we have to be generalists, hence more eclectic than most, and hence more likely to allow more into our awareness. We’re also less likely than other disciplines to be rattled by randomness, the apparently “chaotic,” with less need for a nominal “reason” before we’ll allow something to seem interesting in any given context. In short, we’re better than most at dealing with unorder – which definitely helps here.
Given what we’ve observed, we now have to make sense of what we’ve observed. We Orient our perceptions into some conceptual form, allow meaning to emerge from out of that complexity, as patterns, heuristics, suggestions, implications, guidelines.
As the sensemaking settles down, we need to Decide what to do with what we’ve seen, with what we now understand. No doubt it will seem complicated at first, but with careful thought, careful analysis, we should be able to whittle it all down into some kind of algorithm, a more predictable and certain world.
Which at last brings us something with which we can Act. Define the rules for action. Keep it simple. Keep it fast.
Again.
Observe: Watch the “chaos.”
Orient: Allow meaning to emerge from the complexity.
Decide: Winnow through all the choices and complications.
Act: bring it down to something simple, right here, right now.
Another iteration; and another: Observe, orient, decide, act. Again. And again. Fast. Faster.
Observe: explore the Not-known. Orient: align within the Ambiguous. Decide: resolve the Complicated. Act: accept the Simple. New information arises from the Not-known; Observe it, move to the Ambiguous. New ways of seeing arise in the Ambiguous; Orient to it, move to the Complicated. Complete the sensemaking through analysis in the Complicated, then Decide on Simple rules to Act. Which brings up new information. So there’s a double-pattern in there, as that SCAN-style pattern also comes into the picture.
And then another pattern, because there’s an oscillation from real-time observation to grabbing a moment or two away from the action to make sense and to decide, then back to real-time again to act and then observe again.
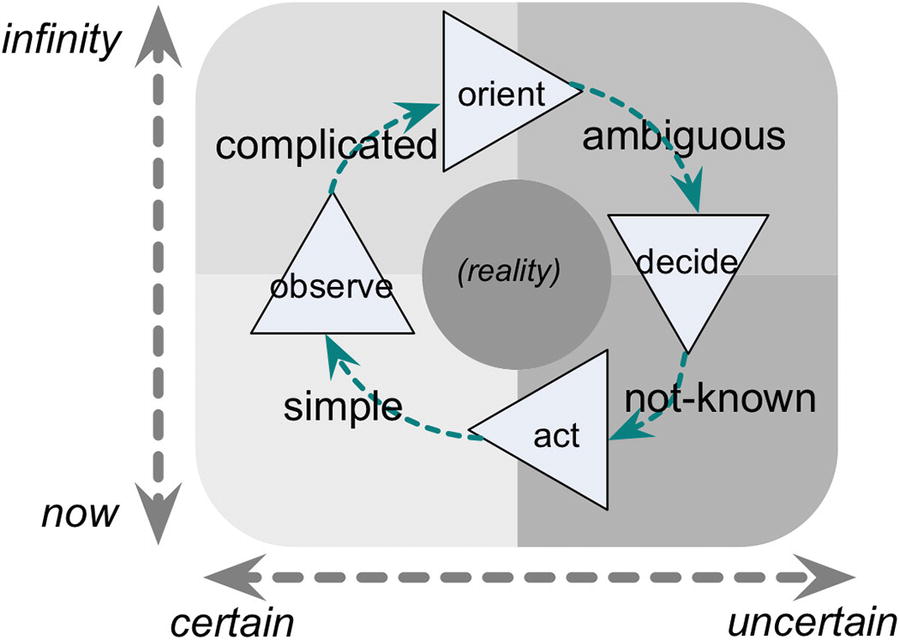
A cyclic diagram of sense-making and decision-making. The inner loop displays ambiguous, not known, simple, and complicated encircled into reality from now to infinity vertically and certain and uncertain horizontally.
Inner-loop cycle: sensemaking and decision-making
And another overlay, and another, layers and layers of ways to make sense and take action, all within the same problem-space and solution-space and, at the end, just the context, itself. Being what it is, while we interact with it.
Except that decisions made in the moment can have effects that last for decades. Or forever.

A cyclic diagram of time compression in the O O D A real-time has two columns for complicated and ambiguous. Orient, decide, and act are in the not known column, and observe is in the simple column.
Time-compression in the OODA real-time cycle
So we need to find some way to create “time to think,” even when there’s almost no time available to think – certainly none for the usual “analysis paralysis” of conventional enterprise-architecture.
Which is where and why these context-space maps come into the story, because they provide a way to skim through many different views onto a context fast enough to help make sense in architectural terms in near-real-time.
Base-Maps and Cross-Maps
Universality: It covers the entire scope of a given context – in principle, anyway
Sensemaking: Its purpose is to guide sensemaking and decision-support, rather than design and implementation of a specific “solution”
Simple partitioning: It divides the context into a small number of regions or “domains” (typically four or five), and often including a “none-of-the-above” region (such as the central region of “Reality” in the framework we’ve used here)
Fluid boundaries: The boundaries between regions may be allowed to move, blur, and/or be somewhat porous
Usage-independent layout: Its layout may not be semantically significant, and may take any appropriate form, such as a horizontal or vertical single-dimension, or multi-dimensional form such as the four-axis/three-dimension tetradian
In systems-theory terms, each base-map is a rotation that provides multiple views into the same overall space. Ideally we also want it to illustrate the balance in the context (reciprocation and resonance), and preferably the layering (recursion and reflexion) in that context too.
Simple: Presumed absolute repeatability – perceived cause-effect linkage is linear and direct
Complicated: Presumed repeatable – perceived relationship between cause and effect is linear but “complicated,” often with delays and feedback-loops
Ambiguous: Repeatability is uncertain – “cause” and “effect” are intertwined and interdependent (an “effect” becomes part of input to its own “cause” in the next iteration)
Not-known: Not repeatable – no discernible cause-effect relationships
“Reality”: “None-of-the-above” region, before cause-effect categorization has taken place
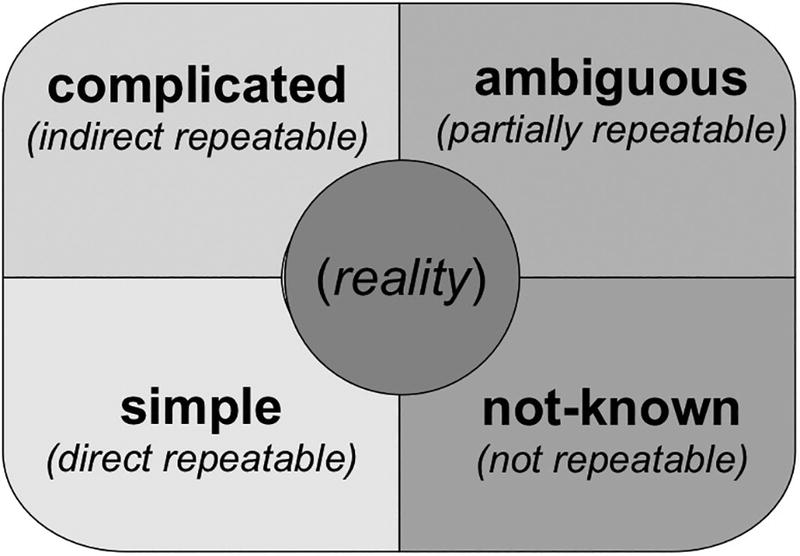
A framework displays ambiguous, not known, simple and complicated, and reality is encircled in the middle.
Suggested base-frame for context-space maps
Simple boundaries: The boundaries between the domains are fixed, explicit, and absolute (“either/or”)
Complicated boundaries: The boundaries between the domains are explicit and absolute, but can move somewhat along each axis (as in a finite and discrete spectrum, or in the way that IT can make analytic decision-making faster, and hence “closer” to real-time)
Ambiguous boundaries: The boundaries between the domains may blur (such as where one or both of the axes are a “both/and” spectrum rather than a strict “either/or” distinction)
Not-known boundaries: The boundaries are quantum-like – they both exist and do not exist, all in the same moment

An illustration of timescale versus interpretation. The level of abstraction is marked from high to low above the 4 dimensions of complicated, ambiguous, not known, and simple. Value versus truth is marked in the horizontal axis. Now versus infinity is marked in the vertical axis.
Timescales versus interpretations
The base-map tells us our range of views when dealing with the real world (Simple, Complicated, Ambiguous, and Not-known).
The “layers of abstraction” scale is actually an analogue of perceived repeatability, but it also warns us how much we may risk over-simplifying our view of the context.
The “horizontal” axis (“value” versus “truth”) is a spectrum of interpretation, ranging from a binary true/false in terms of predefined “objective truth” at one end (extreme of Complicated/Simple) to almost completely subjective and therefore necessarily principle-based at the other end (extreme of Ambiguous/Not-known).
The “vertical” axis (“infinity” versus “now”) is a spectrum of time available for decision-making, ranging from apparently infinite (such as we see in the Complicated-domain “analysis-paralysis” and its Ambiguous-domain equivalents) to a real-time “Now!” (where there may literally only be split-seconds in which to make an appropriate decision).
What this really tells us is that Ambiguous-domain experiments and Complicated-domain analysis are a kind of luxury that depend on having time available for prolonged decision-making. The closer we get to real-time action, the more we’re forced into a narrow band where we have to keep things very simple: either follow the rules, or follow the principles, with no time for anything elaborate.
In that sense, the Simple and Not-known domains have some strong similarities. In decision-making terms, the only real choice along that line is in the extent to which a decision is objective (“truth”-based) or subjective (“value”-based). In the Simple case, we assume that context and actions alike are predictable, controllable; in the Not-known case, neither context nor actions can be predicted, while “control” exists only as a myth, a distant delusion. And somewhere in the middle, between these two extremes, is this context, right here, right now.
Lower apparent repeatability places us in the Ambiguous or Not-known domain for decision-making (via “value”-based decisions)
High apparent repeatability places us in the Complicated/Simple pairing (via “truth”-based decisions)
Low repeatability and limited time (the Not-known domain) means that we must have appropriate principles in place to guide real-time decision-making – which we would typically derive from experiments in the Ambiguous-domain
Limited time but high-repeatability (the Simple domain) depends on the availability of appropriate rules – as in ISO9000-style “work-instructions” – that would typically be derived from Complicated-domain analysis
The context-map shows us that the combination of repeatability (in the problem-space) and the compression of time available for decision-making (in “solution-space”) will force us into this fairly straightforward split in decision-making choices.

A cyclic pentagonal diagram of five elements includes people, preparation, process, performance, and purpose. It shows effectiveness and time.
Five-elements, effectiveness and time
What parts of this context deal with Purpose, or Process, or Performance?
Where does this context focus on the far-future, near-future, immediate-present, or past?
Where does this context deal with the fluidity of “people-time,” swinging almost at random along a spectrum from far-past to far-future?
What aspects of the context emphasize efficiency, or human-factors, or overall integration?
How would we make our strategy (Purpose) in this context more “green” (efficient – “optimizes overall use of resources”)?
How should human-factors (“elegance”) support our operational (Process) tactics (Preparation, recursively)?
Metaphorically speaking, we “walk around” within the base-map, pulling in various cross-maps as overlays in whatever way seems to make sense, to build up a conceptual picture of what’s going in the context. Recursion occurs when we use the base-map as a cross-map on itself – such as when looking at Preparation within a Process, in that preceding example.

A framework displays information, knowledge, wisdom, and data in 4 blocks complicated, ambiguous, not known, and simple with reality encircled in the center.
Data, information, knowledge, wisdom
From this, we can see that the vertical-stack notion is misleading: it’s more accurate to say that they each represent distinct regions or dimensions of the conceptual space. So, for example, it’s entirely correct that we have discrete data-management, knowledge-management, and information-management; and it’s no joke to say that we’ll also need something resembling wisdom-management, because we may well have “wisdom-like” items, such as purported “best practices.” These need to be managed in their own right, yet actually make no practical sense until anchored into the real world via concrete data and contextual metadata, and then connected into the personalized knowledge that can be gained only through personal experience.
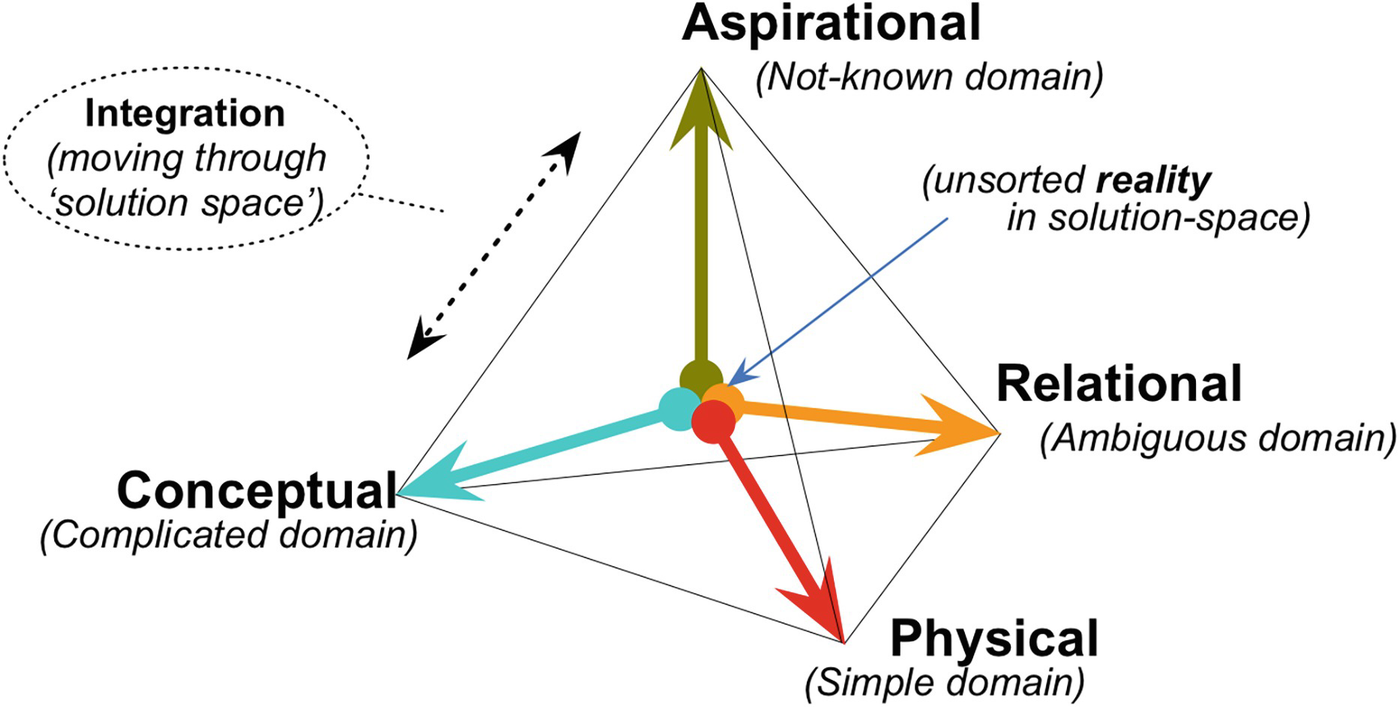
A 3 D pyramidal diagram represents conceptual, aspirational, relational, and physical as complicated, not known, ambiguous and simple domains as 4 arrows pointed outwards as tetradic dimensions.
Asset-types as tetradian dimensions

Three different views of a 3 D tetradic cardboard model.
Cardboard-model tetradian, rotated

An illustration represents the decision types with their domains. Guidelines in ambiguous, principles in not-known, rules in simple, and algorithms in complicated.
Decision-types and base-diagram domains
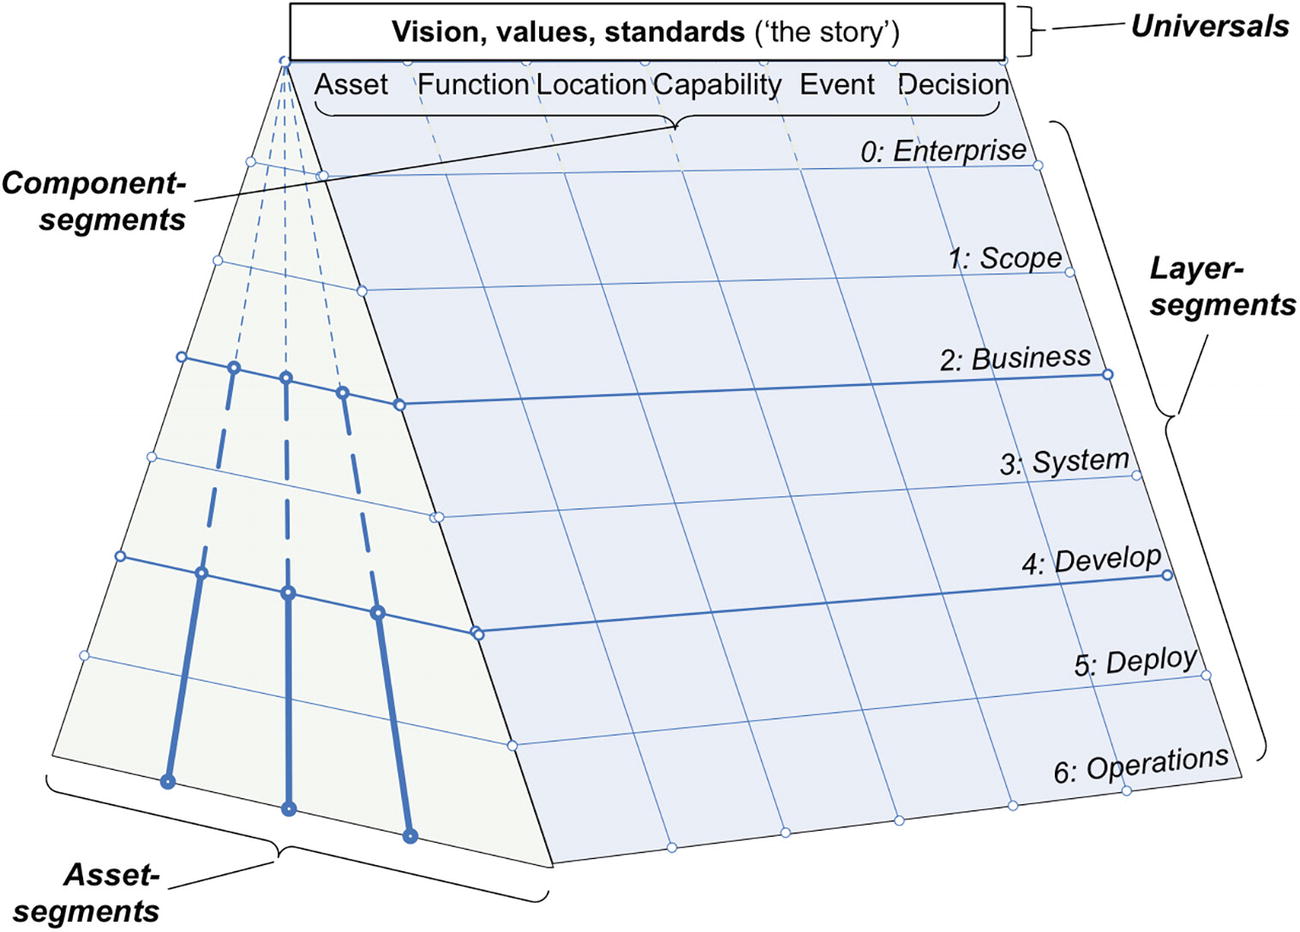
A framework of segment model. The asset segment is at the base. Vision, values, and standards are universal on the top, below which component segments are marked. Layer segments are on the side edge.
Segment-model framework as base-map
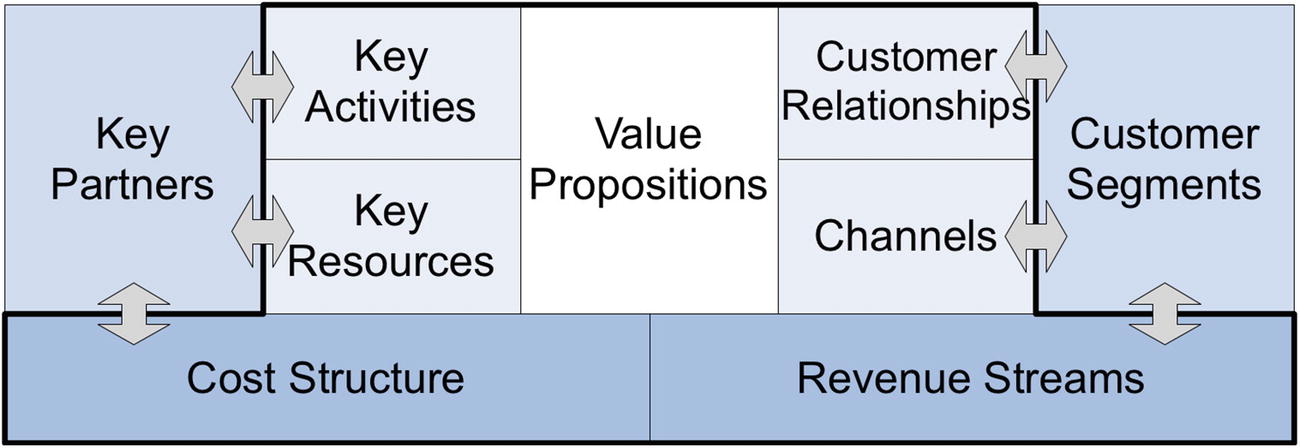
An illustration of a business model canvas. The key partners and customer segments are linked to key activities, resources, customer relationships, and channels to value the propositions of cost structure and revenue streams.
Business Model Canvas
Has customers for whom it needs to present value-propositions, with whom it needs to maintain relationships and communicate through channels, and who contribute either directly or indirectly to its revenue-streams.
Has suppliers, service-providers, and other partners who share in its key activities and provide or interact with its key resources, and who interact with its cost-structures.
The meanings of “customer,” “partner,” “value,” “revenue,” and “cost” will all vary with the context, but the principle remains the same in every part of the enterprise – hence a very useful set of tests to assess the context.
Given a set of base-maps such as these, we then need to collect a stack of cross-maps in our conceptual toolkit, to act as “flip-cards” to scan through many different views onto a context. We’ve seen quite a few so far, and you’ll also find some others – most of them overlaid on the main base-map – in Appendix B, later in the book.
I guess we might be in some danger of getting lost in theory at this point, so it’d be wise to throw in a reminder that the key driver here, always, is about finding ways to make sense of the context, and apply it in practice, fast. The theory may be fascinating, but sometimes so in an all-too-literal sense: we need to remember that our clients in the business and elsewhere are no doubt waiting impatiently for real results – and we’d better deliver.
Yet engaging others in this type of exploration is a key part of our work as architects, promoting, expressing and enacting that “one idea”: “things work better when they work together, with clarity, with elegance, on purpose.” We do need the right level of theory in order to provide the proper foundations to explain those ideas in practice: the trick here is in finding the right balance.
Problem-Space and Solution-Space
To make it practical, we need to link theory to practice in a way that also links “problem” to “solution.” One way to do this is to create maps of “solution-space” that position various pre-packaged options for action – “solutions” – onto the same base-maps and cross-maps that we’ve used to assess the “problem-space.” When the two types of maps align, the process of scanning through problem-space will automatically indicate options for action – and usually with the same characteristics of recursion and the like, such that the same “solution” can be used in many different ways and in many different layers and aspects of the organization.
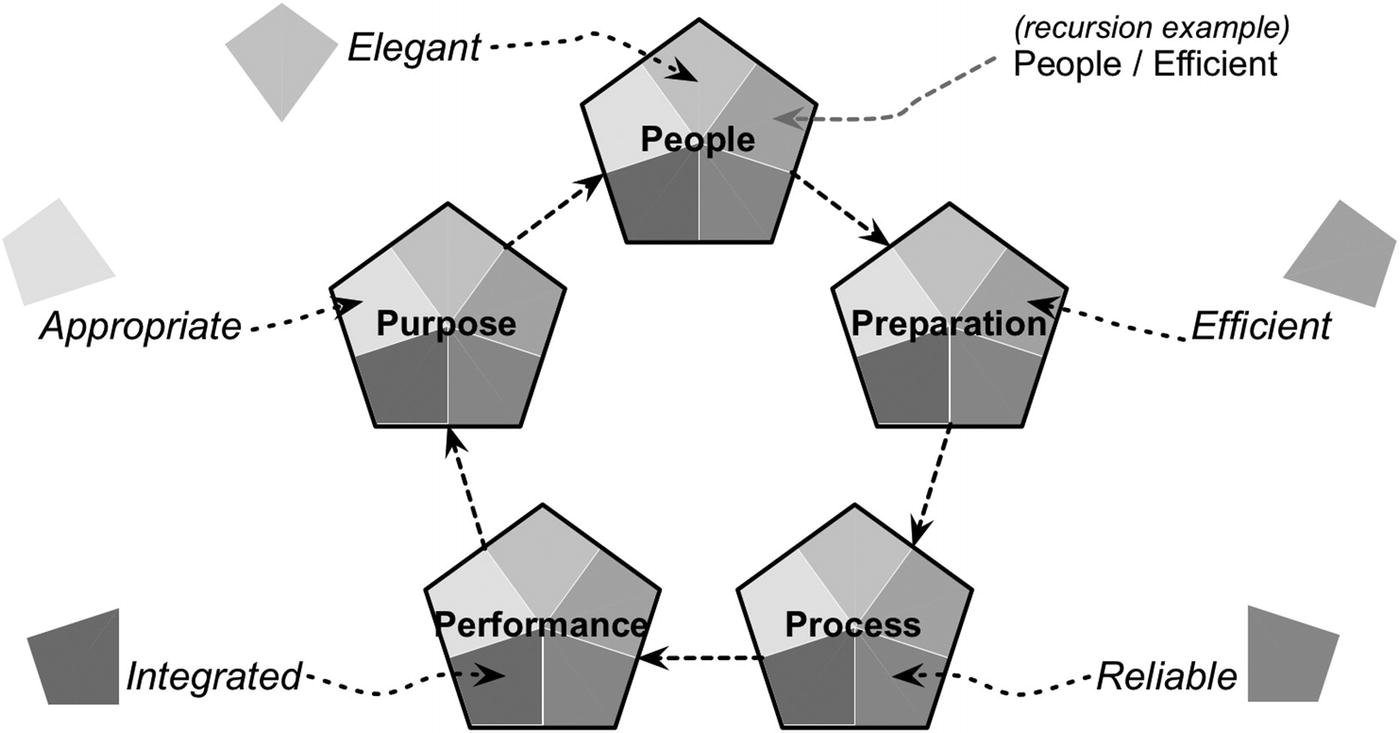
A pentagon cyclic diagram of the effectiveness of 5 elements. The 5 elements of people, preparation, process, performance and purpose are described in 5 dimensions such as elegant, efficient, reliable, integrated, and appropriate respectively.
Effectiveness and the five-element lifecycle
With this map, we would typically aim to identify where problem-areas might be: such as the people-side of planning, perhaps, and a general lack of awareness of direction of the organization, which we might describe in those terms as Purpose/Elegant. A matching solution-map will list various options for action against the same categories, such that the process of “walking around” in problem-space also automatically becomes a means to identify appropriate options to address the respective issues. For example, we could take that preceding cross-map of the effectiveness-dimensions and five-element lifecycle, and then cross-map again to a set of example “solutions” for each region within the context-space map:
Purpose/Efficient: Vision/values as “credo” for decision-making
Purpose/Reliable: Emphasis on principles with rules as default
Purpose/Elegant: Use of emotive language to enhance engagement
Purpose/Appropriate: Explicit reference to “outside” contexts (vision/role/mission/goals layering); whole-of-context standards – ISO-14000, ISO-17000, etc.
Purpose/Integrated: Whole-of-organization strategy development
People/Efficient: Privacy; reputation-management; “Cluetrain” tactics; leadership development
People/Reliable: Integrity/ethics training; shift to win/win perspective
People/Elegant: CRM and social-CRM systems; customer-relationship training; work/life balance; accessibility, ergonomics, and personalization
People/Appropriate: Customer-value analysis; principle-based employment/stakeholder-relationships
People/Integrated: Customer-centric operating-models; “wholeness responsibility”
Preparation/Efficient: Capability development, innovation training, systems thinking; explicit “development time”
Preparation/Reliable: Knowledge-management (KM); knowledge audit/review; integrated performance-support systems (IPSS)
Preparation/Elegant: Tacit KM – communities of practice, “Yellow Pages” skills/expertise directories, weblogs
Preparation/Appropriate: Knowledge audit; gap-analysis
Preparation/Integrated: Intranet/extranet, social-media, and other shared KM; security policy/review
Process/Efficient: Active learning (e.g., After Action Review); kaizen continuous improvement; supply-chain analysis
Process/Reliable: Workflow analysis; capability analysis; scenario development; risk/opportunity analysis
Process/Elegant: Post-compliance TQM (e.g., quality circles); occupational health and safety (OH&S); ergonomics, personalization, IPSS
Process/Appropriate: Strategic review – SWOT, SCORE, etc.; large-group interventions (e.g., Open Space, Future Search)
Process/Integrated: ISO-9000:2000; post-compliance TQM
Performance/Efficient: Benchmarking; real-time dashboards; integration frameworks
Performance/Reliable: Enterprise-wide dashboards; interactive intranet/extranet (e.g., wiki, chat, conferencing, social-media); narrative and dialogue; large-group interventions (e.g., Open Space)
Performance/Elegant: Equity/diversity policy and practice; complexity-system techniques
Performance/Appropriate: Real-time dashboards; performance in relation to maturity-models; values/performance review
Performance/Integrated: SEMPER; Extended Balanced Scorecard; Triple Bottom Line; GRI; AA1000
Simple: The “solution” is proven best-practice and should work well in this context without any change – for example, a work-instruction for cleaning kitchen floors in a fast-food franchise.
Complicated: The “solution” is proven good-practice and should work well when certain known factors are calibrated to the context – for example, setup configurations to install a server on a wide variety of system-types and operating-systems.
Ambiguous: The “solution” is a pattern that has been observed to appear to work in contexts of this type, and could be a good starting-point for experimentation – for example, creating a community-of-practice to enhance skills-sharing.
Not-known: The “solution” probably makes sense in this context as a trigger for appropriate action, if used as a means to focus on overall guiding principles – for example, creating ideas for business-innovation.
There are always variations: for example, in the Chaotic case, we might deliberately choose the exact inverse of the options that are suggested in the solution-map, to see if we could trigger off an “immune-system” type of response. That’s where the skill of the architect really comes into play – and also why it takes a lot of careful practice over a long time to develop those skills without causing a lot of damage along the way…
So, in a sense, it’s good that most enterprise-architects start out in IT-architecture, because most of what happens there is in “ordered” contexts – from very-Simple to very-Complicated – that provide a good base for skills-development before tackling any of the genuinely Ambiguous or Not-known “uncertainty” contexts.
The true complexities of business-politics and the like can cause real difficulties for many of the would-be architects coming up from IT, but in practice it can actually be much harder to come the other way, from business to IT. Simple-domain contexts follow strict invariant rules, often with no room for negotiation – a fact that many business-folk will find immensely frustrating – and the sheer volume of simple detail needed to make something work well can be utterly overwhelming if we’re not used to it.
In short, there are very good reasons why successful enterprise-architects tend to be going somewhat grey in places by the time they really hit their stride!
Both “problem” and “solution” are ways of looking at the context: they aren’t separate from the context, nor are they really separate from each other. In a very real sense, as architects, we are “the problem,” just as much as we are “the solution,” the initial means by which the desired change will come about. But how do we describe that, in a way that makes sense to anyone else? We’re going to need a good metaphor.
One metaphor we might use is the answer to the old physics question of “is light waves or particles?” It turns out that the closest to a correct answer to that question is “yes, therefore no”: “wave” and “particle” represent different ways to interpret the phenomena of light, but ultimately neither can describe what light really is. If we describe light in terms of particles, we can understand certain ways that light behaves, such as photoelectric effects and so on. If we describe light as waves, we can explain other ways that light behaves, but which particles can’t do – such as light’s ability to move through solid glass. Both views are “true” in their own way, but each of them contradicts the other, so we can only make sense of what’s going on by using only one of those views at a time.
The important point, though, is that we can do different things with each view that the other view won’t let us do. If we choose a useful set of views, and then switch between them as we need, we can cover a much broader overall scope, and still make sense of what’s going on. Consider a light-bulb, for example. We’d typically say that the light comes out of the light-source as photons, or particles of light. But particles can’t get through the glass, so we’d switch to saying that light is made up of waves. Switching metaphors like this is a bit of a crazy trick, but it works.
Switching between metaphors is also the core to how we use context-space mapping: it’s not that there is a single view that is “the truth,” but that we switch between metaphors to give us different view on that context, and to allow us to make sense of what we see. We then use that sensemaking to guide subsequent decision-making, about what we should do within that context to achieve the results we want. And in the same way, we collapse the supposed separation between “problem” and “solution” to arrive at our choice of action. Making sense, making decisions; observe, orient, decide, act.

An illustration of walk through the context. The 4 contexts are ambiguous, not known, simple and complicated with reality in the middle.
Walk through the context
Relevant aspects may be scattered all over the map, or occupy multiple regions within the map – there’s no set rule that says that there will only be one region of interest or concern within the context. And in the same way, different segments of a problem may need different matching solutions: some parts may be Simple, if we’re lucky, but others may well be Ambiguous in the extreme, and we’ll need to address all of those aspects in some way or other in order to achieve real lasting success.
This, incidentally, is one more reason why describing IT-architecture as “enterprise-architecture” is so dangerous: it views the entire context from an IT-specific viewpoint, and hence ignores anything that cannot be made to fit an IT-centric “solution.” Which, yes, can work quite well – sometimes – when the scope is restricted solely to the “worlds” inside of IT-boxes; but it does not and cannot work with any true real-world context that reaches beyond those artificially Simple constraints.
The blunt reality is that IT systems in general can only handle Simple problems well, and Complicated problems only at ever-increasing expense and fragility, but are often worse than useless in the inherently uncertain domains of deep-Ambiguous and Not-known. Yet most real-world contexts will include aspects in all domains: for example, every real business-system will include Ambiguous human processes alongside any automated Simple or Complicated ones. A “solution” that only handles the Simple parts of any context and dumps everything else into the “too-hard basket” is no usable solution at all.
But that’s exactly what’s happened with every new IT-driven fad. Whenever a new idea comes along – such as business process re-engineering (BPR), service-oriented architecture (SOA), or “cloud”-based systems – IT vendors rush to build some pre-packaged “solution” around that idea, but ignoring all those aspects of the context that cannot be “solved” by IT. Instead of tackling the context as a whole, the vendors push the delusion that everything can be reduced to Simple rules, enabling automation to solve everything, without requiring any change to management models or management thinking. The result has usually been an expensive failure: very expensive. As one of the originators of BPR, Michael Hammer, put it, “I was reflecting my engineering background and was insufficiently appreciative of the human dimension. I’ve learned that that’s critical.”
Ignoring the human dimensions of a context does not work. Most of “the human dimension” sits firmly within the Ambiguous domain – and we cannot “solve” that with a Simple IT-system. Which is why our enterprise-architecture must be a true “architecture of the enterprise” – and not solely “the architecture of the enterprise-IT.”
We keep walking, keep walking, round and round within the context-space map, building up a kind of holographic impression of the overall context, exploring some parts in fine detail, others only skimmed-over, and using recursion and reflexion to fill in the conceptual gaps, switching back and forth between “observe” and “orient,” between “problem” and “solution.” Then at some point – often without apparent warning, though sometimes because we simply run out of time to do any more exploring – we know it’s time to stop exploring, and decide.
That moment of decision is what triggers and enables action.
And that’s the point our clients have been waiting for all along: that’s where they gain concrete value from our work. That’s often also the point where the responsibility passes out of our hands, and into the hands of others – the designers, the engineers, the specialist solution-architects, and others, who will put those understandings that we’ve gained about the context to practical use. Yet for us, as enterprise-architects, the story continues on: every new piece of architecture-work will add another layer, another view, into our “holograph” of the enterprise as a whole. Observe, orient, decide, act, is a continuous cycle: act must always lead to observe once more.
So while others may be more interested at first in the outward results of our work, to us, it’s always that continuing journey of architectural discovery that matters most. Over time, “problem” and “solution” slowly cease to be separate; it may be true that “the map is not the territory,” yet more and more we reach toward a sense in which the context-space map is the territory, the means through which we interact with the context of the enterprise itself.
And as Matthew Frederick put it in 101 Things, “our experience of architectural space is influenced by how we arrive”: the journey is the architecture, the experience is the process. We set out on that journey each time we “take a walk” through context-space; the act of “taking a walk” with others, in an Agile-style architecture, may often be the only intervention that’s actually needed. And it’s a journey that we aim to share with others, each time we uphold that notion that “things work better when they work together, with clarity, with elegance, on purpose.”
So that’s context-space mapping: an architectural version of the OODA cycle, where “problem” and “solution” are both embedded within an architectural context. Try it: see what happens. Observe; orient; decide; and act.
In the meantime, though, we still need to see how some of this works in real-world practice, out there with the bank, and what to do about their lost respect.
Example Project: Vision and Function for the Bank
Straight in to the bank’s offsite, early in the morning. It’s at a large country-club, open, airy, spacy and, of course, expensive: money may be tight these days, but still plenty to be found for the usual executive perks. The room we’ve been assigned is part of a large banqueting-suite, and the facilities-staff are still tidying up from last night’s wedding when we get there. All’s fine, though; plenty enough space. Several whiteboards, chairs arranged in clusters around circular tables. A quick refresh on our project-plan:
Start by working with them to develop a two-tier functional business model.
Use the “organization and enterprise” diagram to introduce the notion of “enterprise” as an entity to which the organization must relate.
Introduce the concept of vision as an active bridge between organization and enterprise, and explain how it relates to respect.
Work with them to develop a preliminary vision.
We drag the tables off to the side, rearranging the chairs into one big circle, with all the whiteboards round the outside. The CEO may not like this layout – he likes to be certain of his position as head of a hierarchy – but we will need everyone to be viewed as equals here if this kind of process is going to work. While the facilities staff are out of the room, we quickly transfer all the tea-things onto the circular tables, and pull the big rectangular tables as a block into an open space at one end of the room, two tables wide, three long. It’s big enough for everyone to get round, yet still small enough for anyone to reach across to the middle. We cover it with flipchart paper, taped together as a single sheet, and finish the setup just as the first participants start to wander in through the door.
Functional Business Model
This time, for once, they do all seem to arrive reasonably close to time, and have actually taken the no-phones critique to heart – even the CEO is more willing to play by that rule. Some of that previous message about the nature of respect seems to be sinking in: a very good sign, if so.
We start by explaining the role and value of a function-model, as an overview that will get everyone literally “on the same page.” So what does each person do? What function does their team serve within the organization? And how does that function relate with all the other functions in the organization?

An illustration of the business model for banking. Manage the business is on the top under which 3 types of transactions accept, process, and verify are displayed. Support the business is at the bottom. Contact customer is on the left and customer relations is on the right.
Generic tier-1 functional business model for banking
And we explain that what we’re after here is just the tier-2 model – the basic sub-categories in each of the tier-1 regions, for the bank. We’ll do this at first with sticky-notes, placed on the large sheet on that big table off to one side.
We’ve already provided a base-layout for them, derived in part from the eTOM telecoms-industry standard – deliberately “wrong” for banking, so as to encourage the participants to think more carefully about what they do. As we’d hoped, the model comes together very quickly, almost without argument, showing distinct regions such as strategy, call-centers, risk-management, compliance, trading, back-office, clearing, branch-operations, and IT.
To make it more personal, we say, we’ll ask each person to place their own photograph in the respective place on the model. This creates much laughter, as there’d been some confusion about the instructions, hence some people have brought photographs of themselves as children. Others, of course, have forgotten to bring any photograph at all: one woman sketches out a surprisingly good cartoon of herself and uses that instead. We also come across a more interesting problem, because many of the participants have roles that are scattered across many functions in the organization, we have to find a photocopier to churn out various duplicates as required.
After about an hour, the model looks remarkably complete: a very clear picture of what actually happens in the organization, and who is responsible for what. We all lift it carefully up off the table, hang it from the high cross-beam rafters of the room, and stand back to see what else it can show us.
Two points come instantly to mind. One is that people’s roles are structured according to their geographic location, their position in the hierarchy, or which of the two banks they used to belong to, or almost anything, it seems, than their actual responsibilities in terms of business function. Which may be why there’s so much miscommunication and so many clashes of authority, because almost every function has three or four or even five people with “exclusive” responsibility. Except for one crucial business-function: information-technology.
That’s the other key point: the CIO is conspicuously alone, the sole photograph in a large blank area of the canvas, with no-one else to share any of those responsibilities. So even the function-model shows that she has no real support at all: no wonder that she seems so overloaded... The laughter quietly fades all round: there are some thoughtful faces, even shocked faces, standing in front of that model as we move into the morning break. But there are also conversations starting to happen that have never happened before – creating new links across the whole organization, and creating new respect for each other too.
Enterprise-architecture, in action, in real-time, delivering real business-value, right here, right now.
Once the Functional Business Model is in place – and preferably developed to a more-detailed tier-3 level – there’s a whole lot more you can do with it. At Australia Post, we used it for mapping projects, to identify gaps and overlaps; the financial team used it for Activity Based Costing; and just about every manager had printed out their own copy and used it for onboarding of new staff and all manner of other things, including as a visual telephone-directory. Others have used it for mapping pain-points and compliance responsibilities. It’s one of the most useful architectural models there is, and every new architecture-team should develop their own as one of their very first tasks.
Visioning
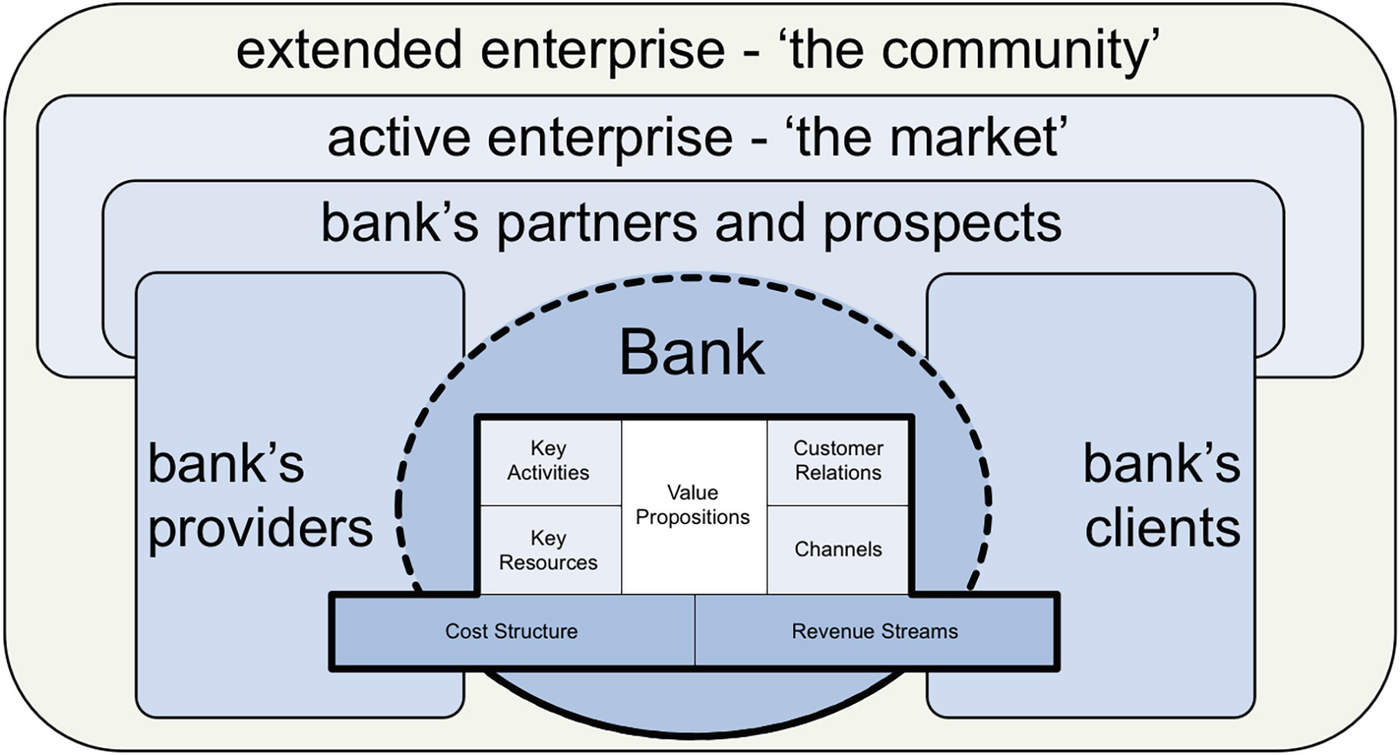
An illustration of the bank in the context of the enterprise in 3 layers. Bank providers and clients are linked to the bank as cost structure and revenue streams. The market is the active enterprise and the community is the extended enterprise.
Bank in context of the enterprise
That, we explain, is the enterprise that they’re actually working with – not solely the “enterprise” of the bank itself. Which leads to the notion of a “vision” that bridges right across the whole of that context, linking the bank with every aspect of its enclosing enterprise. A Vision is a single, simple phrase that provides the people who comprise “the bank” with a reason to get up in the morning, and that also gives others a clear reason as to why they should relate with the bank. It’s about the whole enterprise – not just the bank itself.

A model has 2 divisions of means and ends. It starts with vision, role, mission, goal, and activity.
Vision, role, mission, goal
The vision itself is a short, simple statement describing a “world” desired by all participants in the enterprise. The statement is chosen by the organization itself, but as a means to describe the ecosystem in which it operates, and the reason why the various business-relationships and other relationships would exist within that enterprise. For example, Australian brewers Lion Nathan hold to a vision of “a more sociable world,” while the IT-industry standards-body Open Group maintain the vision of “boundaryless information-sharing,” linked to their tag-line of “making standards work.”
Where most attempts at defining a vision go wrong is that they’re literally self-centered, describing the enterprise only from the perspective of the organization itself: the classic marketing-style “vision” of “to be the best this-that-or-the-other.” To work properly as an anchor for everything the organization is and does, the vision needs to be much broader, describing a “world” with space enough for all the other players too. The organization then chooses one or more roles within that “world,” as providers of some of the services of that “world,” and consumers of others; and the other participants choose their own differing roles, perhaps as “clients” or other service-consumers, perhaps as competitors delivering the same kinds of services, perhaps as regulators, and so on. Yet, in effect, all of the active participants and other stakeholders will share at least some aspect of the vision – which is why they are stakeholders in that vision. The vision provides the common reference-point that links all those services together.
And a vision itself is not something that can be measured, or “achieved”: it just is.
It’s stable – it never changes.
It’s singular and universal – there is only one vision, applying to everything the enterprise is and does.
It’s emotive – it describes “the passion,” it implies desirable or undesirable characteristics for hiring policies, and provides direct motivation, in the sense of “it’s what gets me out of bed in the morning.”
And it’s strategic – it provides a focus-point to identify “weak signals” that forewarn of strategic changes in technology, society, and the like.
The vision for the enterprise cannot change, because doing so would fundamentally change the enterprise. (In fact, if the vision does change, the enterprise could literally cease to exist – and may take out the organization in the process.) And the vision is not abstract: it needs to appeal in a very personal way – and if we can’t connect with it in that literally emotive sense of “getting us out of bed in the morning,” we’re possibly in the wrong enterprise.
For the other nodes in that “audit-trail,” the Role describes what the organization aims to do and not do within the vision’s “world,” as the ways in which it contributes toward the vision. Although a role-statement may often include some kind of boundary, such as processes, overall activities, or geographical constraints, there’s no explicit qualifier, no “best of,” “premier provider of,” or suchlike – it’s just a simple statement about what the organization does in this role. And by placing this boundary around what the organization does, this automatically implies other roles that would be needed to realize the vision: for example, if Lion Nathan sees itself in the role of “brewer and distributor” for “a more sociable world,” the other roles it might need to connect with would include not just the obvious ones such as “customer,” “supplier,” and “competitor,” but others such as “educator in safe and healthy sociability” and even “provider of police services.” Taking a whole-of-enterprise view makes it clear that these odder intersections with other roles would be an expected part of business – which can “surface” hidden opportunities, and reduce the potential for unpleasant surprises from unexpected stakeholders.
A Mission is a description of a capability or service that we will create and then maintain indefinitely thereafter. (Think “trade-mission,” rather than one-off military-style mission – in fact the latter is really a type of goal.) So a “mission-statement” should be a straightforward description of the overall means – the how – by which a role will be delivered, and of what determines “success” in that role. Each mission must identifiably support a role and vision, and must be measurable in some way, because while the mission is never actually “achieved,” we need some means to identify the extent of its success. And in many cases, missions are as much about partners, other roles in the Vision-world, because these are the points of contact with these “outside” roles: the metrics for the mission must also monitor and manage that association. Each mission is also a locus for continuous-improvement processes, its metrics that are key inputs for quality-management; and missions also need regular review, not only in relation to their own metrics, but also to the respective role, because each may change the other.
Finally, a Goal describes a “project” with a specific set of activities, deliverables, and target date for completion. (Every transit through a value-chain is a kind of “project” with a finite goal.) Each goal contributes toward a mission – it never exists in isolation – and each will be immediate, explicit, concrete, and practical, providing clear boundaries of time, space, and context to make it easier to concentrate on the task to hand. Goals also differ from missions in that, at the end of the project-lifecycle, a goal completes, but a mission continues; and we measure or review after a goal, but during a mission. Well-constructed goals can also provide a useful sense of urgency, of need to complete.
That brief wander through theory brings us back to the urgent goal here, which is to find some kind of anchor that will re-link the bank with its market, and start to reclaim the lost respect.
We remind the participants here of the role and aims of a vision, in terms of relationships between the organization and enterprise, and emphasize some key themes, of which the most important is Visioning Rule #1: this is not a marketing exercise! A pitch is a short-term appeal to the market, while the Vision is the unchanging anchor for the organization itself: it’s essential never to confuse these two functions, because mistaking a market-pitch for a vision can kill a company – and often has.
The key point is that the vision never changes. Strategies and tactics implement the paths toward the vision, and positioning relative to others who connect to the same vision: we use strategy to review the continuous subtle changes needed in the role, and create and maintain missions to match; and we use tactics to define the goals and activities that are needed to support each mission. Successful strategies depend on clear goals and the like; and goals in turn depend on clear missions, roles, and vision. But a misframed vision will render strategy unreliable, unstable, and error-prone. Hence getting the vision right is important in the extreme.
Because it’s not so much a choice as a feeling, identifying a valid vision does take time. Unfortunately we don’t have much time here in this workshop, but we should have enough to get a sense of what a workable vision would feel like.
Role as “vision”: “providers of financial services” – This confuses ends and means, and invites a “so what?” response
Mission as “vision”: “achieve and maintain 30% market share” – This leaves no room for connection with customers, partners, or other stakeholders, and invites a “What’s in it for me?” response
Goal as “vision”: “supplant Citi!” – “Killing the competition” or similar goals may produce good short-term urgency, but will kill motivation stone-dead once the goal is reached
Marketing-slogan as “vision”: “to be the best bankers of the century!” – This “to be the…” form combines every error: role-based, self-referential, goal-driven, spurious measure
It’s unfortunate – to say the least – that that last error-example is the style actually recommended in many texts and standards, including the Business Motivation Model… Be warned, it does not work – it simply cannot do the job that a valid enterprise-vision needs to do.
Another visioning booby-trap that especially affects architects is desired future-state as “vision”: “our vision for the ‘to-be’ structure of the company.” A future-state is effectively mission-as-vision, and it doesn’t work as an enterprise vision. It’s a bit unfair, because it’s actually a subtle semantic problem – it’s valid in its own way, but is a different meaning of “vision,” and not vision in the sense we’re using here. If in doubt, there’s a simple test: if the “vision” describes something that is temporary, or narrow in scope – such as a typical “future-state architecture” – then it’s not a vision that’s usable for this purpose.
The participants divide up into small teams of four or five, and we split the remaining time into brief development-and-review cycles of ten to fifteen minutes each, to work toward something that resembles a usable vision.
To no one’s great surprise, the first few passes provide several all-too-obvious examples of falling for every one of those pitfalls: a hyped-up “to be the best we can be!”, for instance, or the dreary marketing-slogan “the best bank for you.” Back we go, and back again, as the same mistakes get repeated time after time: and we begin to get worried, because it’s looking all too possible that this group simply won’t be able to get the point of the exercise – a way to reach beyond the usual self-centric marketing spiel, to something that will allow people to connect with the bank, and to re-create that respect.
Then out of the blue – or out of the welter of excitable slogans now scattered all over the walls – something usable at last appears: “better financial futures.” It doesn’t look much at first glance – it might not attract a marketer’s eye, for example – but it does have the right feel, the right characteristics. What is it that interests every player in this shared-enterprise? Better financial futures. What is it that interests the government? Better financial futures. The bank? It wants better financial futures too. And likewise the customers, prospects, partners, suppliers, competitors, probably even the bank’s enemies and anti-clients: everyone’s interested in better financial futures. It makes sense: it works. Or well enough for now, anyway – and much better than those marketing-slogans would have done so on their own.
Customer relations: Credit-card management and debt-reduction is not about stopping people from spending money, but about ensuring customers’ better financial futures.
Internal operations: Everything we do is about ensuring better financial futures throughout the extended-enterprise.
Government relations: Our focus with government is around making better financial futures for the nation as a whole.
Risk management: The purpose of risk-management is to ensure better financial futures.
Hiring policies: We need people who are committed to creating better financial futures for everyone.
Community and philanthropy: Our donations and support-schemes all revolve around better financial futures for the broader community.
And now we can come back to all the marketing-slogans and internal exhortations, to review each of those in terms of the vision. There are plenty of phrases up on that wall that – with perhaps a few tweaks here and there – would line up very nicely behind that feeling described by “better financial futures.” Everything they’ve done so far still works: but they now have a clear reference-point against which everything and anything can be assessed. So it’s now all starting to make sense: we can see the metaphoric light-bulbs lighting up behind many participants’ eyes…
But at that point, it really is time to stop: time for a quick wrap-up, and then let them get on with the rest of their day.
Wrap-Up
We’d started from the problem of respect, or loss of it. From there we’d seen how respect was poor even within the organization, but more in a passive sense, that there was nothing to help tie them all together as an organization, and thence with their market and the broader community. So that’s what we’d concentrated on: how we could link everything together.
You’ll notice that we didn’t mention “architecture” anywhere here – even though that’s actually what this is.
That’s why we’d started the workshop with the function-model, as a way to get everyone within the organization on the same page – literally so. Each member of the executive and senior-management could now see the part their own work played within the overall organization, where they overlapped with others, and where gaps in responsibilities might appear in future.
We’d then expanded that to show how the organization fitted in turn within the broader enterprise – the implied value-propositions and service-interfaces with every other player in the enterprise, including those stakeholders who might have no direct interaction with the organization.
And from there we’d moved on to the notion of a “vision,” a single phrase that links every participant in the entire enterprise, both within the organization and beyond it. We’d shown how this differs from, say, a marketing-slogan, or from the usual business metrics. They themselves had found a usable starting-point for this – “better financial futures” – and we’d then explored how this could be used in practice, with immediate effect, and immediate practical impact.
Together, in effect, we’d created a space in which respect could exist: respect for each other within the organization, respect for the other players in the market and the broader enterprise, and also respect from those other players toward the organization and all the people within it. Sure, there’s lot more still to do, to reclaim that respect, over the coming months and years: but the necessary foundations for all that work are now in place.
Quite a lot to have covered in a single morning, then.
As the participants file out of the room for the midday break, we grab the chance to make some quick notes for the following day’s review with the change-manager; and then settle down to the quiet unnoticed slog of tidying up from the session.
Application
How do you keep implementations “on track” to the architecture? How do you manage your relations with project-leads, portfolio-managers, solution-designers, and other implementation-folks? How do you avoid the dreaded role of “the architecture-police”?
How do you engage with others to share that “one idea” that “things work better when they work together”? How do you explain to others that architecture and overall effectiveness are the responsibility of everyone in the enterprise? How do you bring others along with you on the “journey” that is enterprise-architecture?
What are your own specialisms within architecture? To what extent are you a specialist in being a generalist?
What, to you, is “the architecture of architecture”? How do you describe to others what you do? And what processes do you go through to improve your skills in the work that you do?
What methods do you use for sensemaking and decision-making in architecture? How would you use those methods for sensemaking and decision-making about the architecture and practice of the architecture itself? What kind of meta-thinking and meta-methodology do you apply to your architecture?
How do you identify the actual “problem” within any given context? How do you ensure that you have identified the “root cause” rather than a more surface-level symptom? What methods do you use for sensemaking and decision-making in unordered contexts where the concept of “cause and effect” may make little or no practical sense?
How do you identify “solutions” for any given context? How do you limit the risk that a “solution”-option may constrain your view of the context? How do you align the overall “problem” with an appropriate set of “solutions”? By what means would you ensure that they remain aligned in the future? In what ways could you make your “solutions” self-adapting’ to align themselves with any changes in the “problem”-context?
What patterns do you note in sensemaking (“problem-patterns”) or decision-making (“solution-patterns”) in your own work? How would you describe those patterns? How would you validate them? How would you adapt and apply those patterns in practice within your architecture?
How would you introduce “the architecture of the enterprise” to the executive and senior management of your own organization? What difficulties would you expect to have to deal with – especially with the “numbers-men” among them? How would you keep their interest engaged long enough for the practicality of these initially abstract ideas to start to sink in?
How would you explain to your executive the difference between the organization and the enterprise – and that the broader-enterprise can never be under their control? How would you explain to them the impacts of the broader-enterprise on the organization, as expressed in themes such as respect, trust, or morale? How would you demonstrate the linkage between those seeming-abstract themes and their real impacts on the financial bottom-line? And how would you do so without touching on any “undiscussables” such as externally imposed business-policy?
Architecturally speaking, how would you get everyone in the organization “on the same page”? How would you extend that beyond the organization, to include partners, suppliers, customers, the broader market, perhaps the broader community? What would be the advantages if you do so? Perhaps more to the point, what would be the disadvantages if you don’t manage to do so? In what other architectural ways could you establish a unifying “totem pole for the tribes”?
Summary
In this chapter, we explored what happens – and needs to happen – as we move from plan to implementation. In the first of our two projects, we used the example of developing a new tool for architectural sensemaking – context-space mapping – to in turn make sense of the process itself. Architects are specialists in being generalists: we need the right tools and techniques to support that specialism. In the second project, we explored the step-by-step actions and outcomes of working on two capabilities that we needed the clients to develop for themselves: how to create a functional business model to aid in person-to-person communication across the organization; and a vision-statement that could help to “unify the tribes” and rebuild respect across the overall enterprise.
The main deliverables were, respectively, the descriptions and diagrams for context-space mapping, and new ways to make sense of the principles and practice of enterprise-architecture; and a functional-business model and vision-statement that the organization could put to immediate use.
In the next chapter, we’ll review what we’ve done in those two parallel projects, and assess the value that’s been gained from doing them.