
Chapter 5. Simulating Real Users
In Part I, the first thing we said about WebPageTest was that it is a synthetic tool, not to be confused with real-user monitoring. By virtue of being synthetic, WebPageTest is only an approximation of page loading performance. But synthetic testing can (and should!) still accurately resemble the way actual users access the page.
Why would it matter if a synthetic test is realistic? It is completely within the realm of possibility that a user with an empty browser cache from Dulles, Virginia in Internet Explorer 9 over a cable Internet connection is visiting a given web page. The goal of synthetic testing, however, is not necessarily to optimize for one particular use case but rather to optimize for the entire user base. The best way to do that is to set up synthetic tests that are representative of the population. For example, test in a commonly used browser from a typical location over reasonable network speeds. These simple changes allow you to focus on the performance issues that actually matter to users.
To make the point, imagine that you’re contracted to optimize the performance of a university web page for enrolled students to check their class schedules. You can assume that users are likely to be on very fast university infrastructure, and there’s a good chance that they will be accessing the site from their mobile phones as they figure out when and where their next class is. Given this information, a good test configuration would make use of a mobile browser with a fast connection in a location geographically proximate to the university. By establishing the synthetic test in a way that simulates a student accessing the page, you’re better able to identify performance issues that are actually affecting real users.
This scenario, though contrived, demonstrates the importance of simulating real users. If you only test with the WebPageTest defaults, you might overlook issues specific to mobile usage. What if the hypothetical university happens to be located in London, England? That would be a useful piece of information to have so that you could choose one of WebPageTest’s London test agents. Testing geographically close to the servers would mean that the browser and server have a shorter path over which to communicate, leading to faster round-trip times or latency. Carelessly testing from the default location in Dulles, Virginia would include unrealistic traces of transatlantic latency in the results. The last thing you want to do is spend time fixing a problem that doesn’t even exist, so avoid polluting test results with costly distractions.
Warning
When a user revisits a page configured to cache its resources, the browser is able to make use of the local copy and avoid downloading the resources all over again. This is great for performance because, as the saying goes, the fastest network request is the one you never even have to make. The cache state is such an important factor precisely because it’s so impactful. A page loaded with a warm cache is usually much faster than its cold counterpart. If users typically hit a page with a warm cache, overanalyzing WebPageTest’s first-view results is less likely to lead to meaningful insights.
WebPageTest’s configurability makes real-user simulation possible. As we saw in the university example, we could select test parameters, such as mobile device, connection speed, and test location, to ensure realism. The configuration options extend to the application layer as well, which means that WebPageTest can actually initialize tests by interacting with the web page itself. A significant issue we haven’t considered yet is user authentication. The fact that the application shows a student his own personalized schedule must mean that it knows who that student is. So how can WebPageTest tell the application whose schedule to use? As we’ll see in detail in Chapter 9, there are a few techniques to give WebPageTest access to privileged user data and simulate signing in. For the purposes of this chapter, you should just be aware that these capabilities exist.
Identifying Demographics
In the previous example of the university course schedule page, you were given several pieces of information about the users. Knowing that the users are students, accessing the page from their mobile devices, on campus, and connected to university WiFi, you are better able to simulate their experience in a synthetic test. Understanding who is actually using a website is as vital as understanding how they access it. For our hypothetical scenario, that all sounds great. But reality is never so simple.
The process of understanding your users could take several low- or high-tech routes. One of the easiest and most direct ways would be to post a survey for your users. Think of a web form that users fill out to provide you with their personal information. Potential questions could be, “Where are you?” or “What browser/device are you using?” This virtual census relies on users to volunteer their information to you, which you must then save and organize into meaningful metrics. While these results would be accurate and custom-tailored to the questions you’re specifically looking to answer, users generally don’t want to be bothered with online surveys, especially when it comes to personal information. This method also gets in the way of what the users came to your website to do, and could lead to negative behavior like an increased bounce rate. For these reasons, it’s probably not a good idea to take the low-tech approach.
Fortunately, several high-tech options are available in the form of real-user monitoring. Although RUM has been discussed so far primarily as a web performance tool, it is also suitable for surveying real-user demographics. You may be wondering how this can be done without users volunteering their information such as by entering their browser and location into a web form. The good news is that much of this data can be inferred from the communications already going on between the user’s browser and the web server. Browsers use HTTP request headers to include not only information about the resource they want but also information about themselves. For example, a Chrome browser would include the User Agent request header with a value similar to Mozilla/5.0 (Windows NT 6.1; WOW64) AppleWebKit/537.36 (KHTML, like Gecko) Chrome/36.0.1985.125 Safari/537.36. Additionally, the server already knows the user’s IP address, which is necessary to be able to route responses back to the user. The user agent header and IP address can be used to infer the user’s browser, operating system, and coarse geographical location.
In addition to user metrics, RUM services are also well-equipped to collect page data. Another HTTP request header is Referer, which is intentionally misspelled to maintain consistency with the HTTP specification. This header denotes the URL of the page that the user was on when the request was made. By linking user data like IP address with page data, the services are able to interpolate patterns such as navigation flow through a website. RUM services are also capable of handling application-specific data. For example, a website may have content that makes use of a Flash player. Because not everyone has the Flash plug-in installed, it would be useful for the service to include the proportion of clients that can support Flash.
All of this is made possible by the web page including a callback to the RUM service. The callback is made in the form of an HTTP request to the RUM API endpoint. In addition to the data captured by the HTTP request headers (IP address, User-Agent, Referer), the web page could also attach application data just like a form would turn input fields into request data on submit. By making this request from the user’s browser on the web page directly to the RUM service, all of the aforementioned metrics become available to the service to store and analyze.
Adding a RUM service to your website gives you the ability to not only monitor performance but also capture valuable information about who your users are. And because RUM constantly ingests live data, you can see how users change the way they access your site over time. For the purposes of configuring synthetic tests, there is no better source of truth than RUM data. There are many great RUM services available like Google Analytics (Figure 5-1) and SOASTA mPulse. These tools all have several core features in common like web performance monitoring and reporting of user geography and technology. But because Google Analytics is the most prominent RUM tool in use on the web, we’ll use that to demonstrate how to identify user demographics in live user data. Translating these instructions to other RUM tools or even newer versions of Google Analytics should be straightforward given the similarity between features.
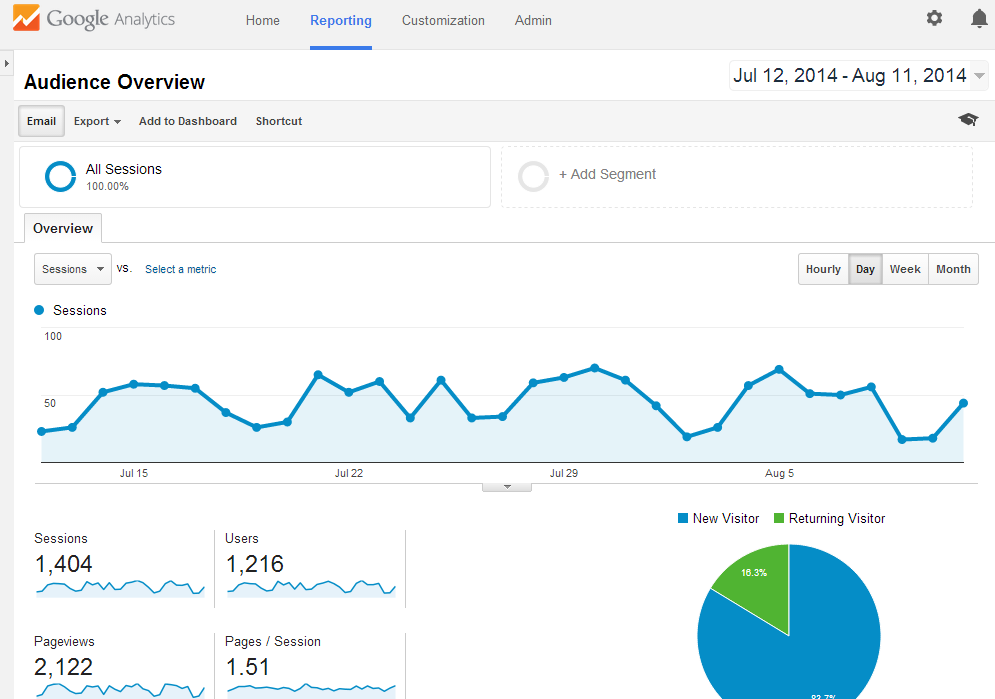
Figure 5-1. Example of the Google Analytics overview page, which graphically displays information about website traffic over a given period of time
Each of the following sections will look at a demographic, walk you through identifying it in Google Analytics, and demonstrate how to configure it on WebPageTest. The sections will increase in complexity, starting with the most-viewed pages of a site. The following three sections will take you through the browser/device, location, and connection-speed user metrics.
Popular Pages
Suffice it to say that the pages that you test on WebPageTest should generally be pages that your users frequently visit. This application metric is the most straightforward for RUM services to analyze because it is just a count of the distinct HTTP Referer values. On Google Analytics, you can find your popular pages by navigating to the All Pages table under Behavior > Site Content. Figure 5-2 shows the most popular pages for an example website.
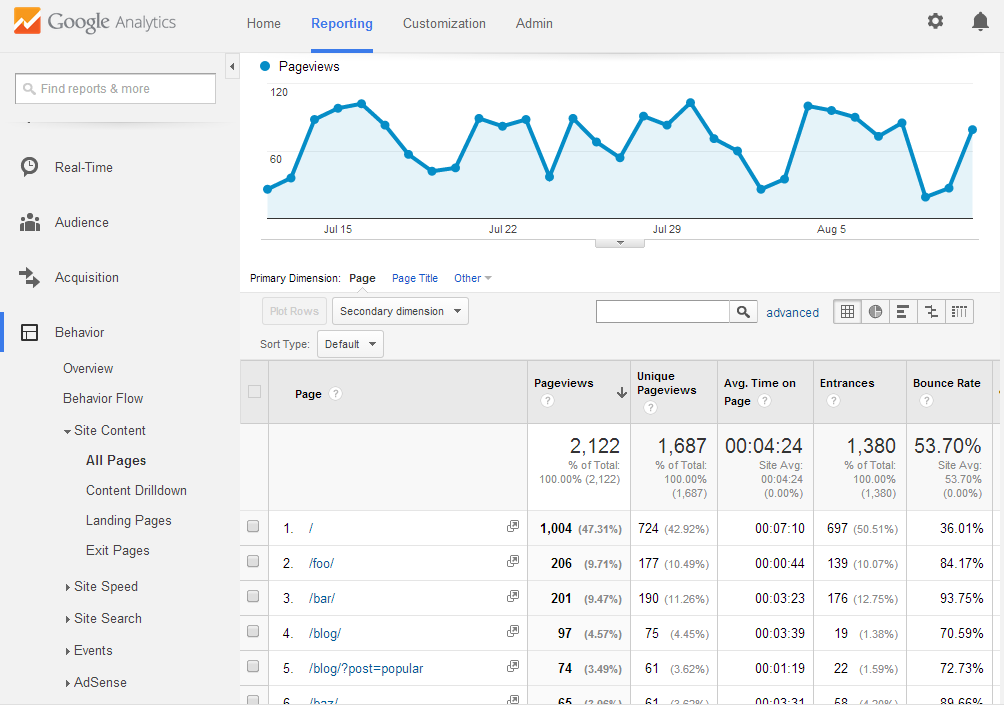
Figure 5-2. Table of fictional web pages for the website www.example.com, sorted by page views. The home page (/) is the most popular page.
Figure 5-2 shows us that the home page accounts for almost half of all page views, so that would definitely qualify as a good URL to run on WebPageTest. /foo/ and /bar/ are the next two most-popular pages, so for more complete coverage it would be a good idea to add test cases for these URLs on WebPageTest as well (Figure 5-3).
Warning
The list of popular pages is not grouped. This means that if your page varies by querystring data, each unique URL would be counted separately. The example website used in Figure 5-2 contains a blog. Each blog post can be directly accessed with the ?post=[title] querystring parameter. When all blog posts are considered, it’s possible that in aggregate the blog is the most popular page of the entire site. Because Google Analytics breaks down pages by unique URL, you are only able to see which blog posts are individually the most popular. The popularity of the blog as a single page type, like the home page or secondary pages like /foo/ and /bar/, is not directly comparable. The current implementation means that you would only be able to determine the relative popularity of individual blog posts instead. This may become an issue if you have many individual pages that each contribute many page views, but not as many as other more popular standalone pages. When you look at a list of pages sorted by page view, you may make the mistake of ignoring the other ungrouped pages.
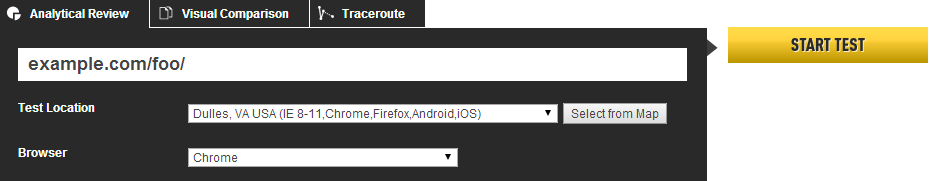
Figure 5-3. One of the most popular page URLs as determined by Google Analytics is fed into WebPageTest via the URL text input field on the test configuration home page
When you select pages to use for testing, popularity should not be the only factor. You must also consider pages on which performance is a business-critical requirement. For example, an ecommerce web site may want to audit the performance of the product pages or the checkout flow. These pages may not show up in the analytics report as some of the most frequented pages on the entire site, but that should not diminish the importance of page-loading performance, due to their direct business impact.
Device and Browser
Up until 2007, the year of the first iPhone, it would be uncommon to see web traffic from anything but desktop computers. But the web-enabled mobile device revolution has now made it possible for users to access web pages from their phones. Google Analytics can show you the breakdown of traffic from traditional desktop, mobile (phone), and tablet devices, as shown in Figure 5-4.
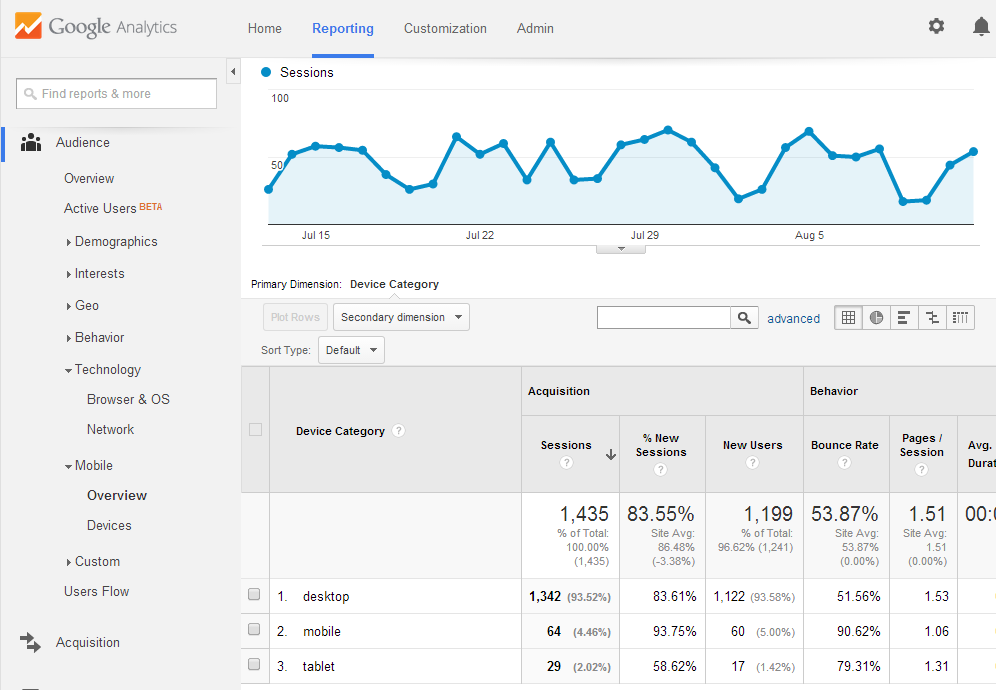
Figure 5-4. The Mobile Overview page breaks down website traffic by the type of device used: desktop computer, mobile phone, and tablet. In this screenshot, desktop overshadows mobile and tablet traffic at 93.5%, with mobile following at 4.5%, and tablet taking up the remaining 2%. This lack of device diversity would suggest that desktop-only testing would be sufficient.
The mobile overview page, as shown in Figure 5-4, is accessible from the Mobile section under the Audience heading. The interesting part of this page is the device category breakdown, which in this case shows desktop commanding over 90% of traffic. Depending on the type of website being analyzed, mobile could easily overtake desktop traffic. If your website is frequently visited by mobile users, you should be pleased to know that as of February 2014, WebPageTest has been upgraded to an arsenal of mobile devices for your testing needs. Figure 5-5 shows you how to select a testing location from the WebPageTest home page.

Figure 5-5. On the WebPageTest home page, selecting the test location in Dulles, Virginia gives you access to a variety of actual mobile devices on which to test
The list of test locations on the WebPageTest home page includes a section just for mobile devices in Dulles, Virginia. This location is equipped with an iPhone 4 as well as several Android 4.4 devices including the Motorola E, Motorola G, Nexus 5, and Nexus 7 tablet.
In addition to the device category, the type of browser used is also relevant. This information can also be found on the Technology tab under the Audience heading. The Browser & OS page defaults to showing you a list of the most popular browsers, as shown in Figure 5-6.
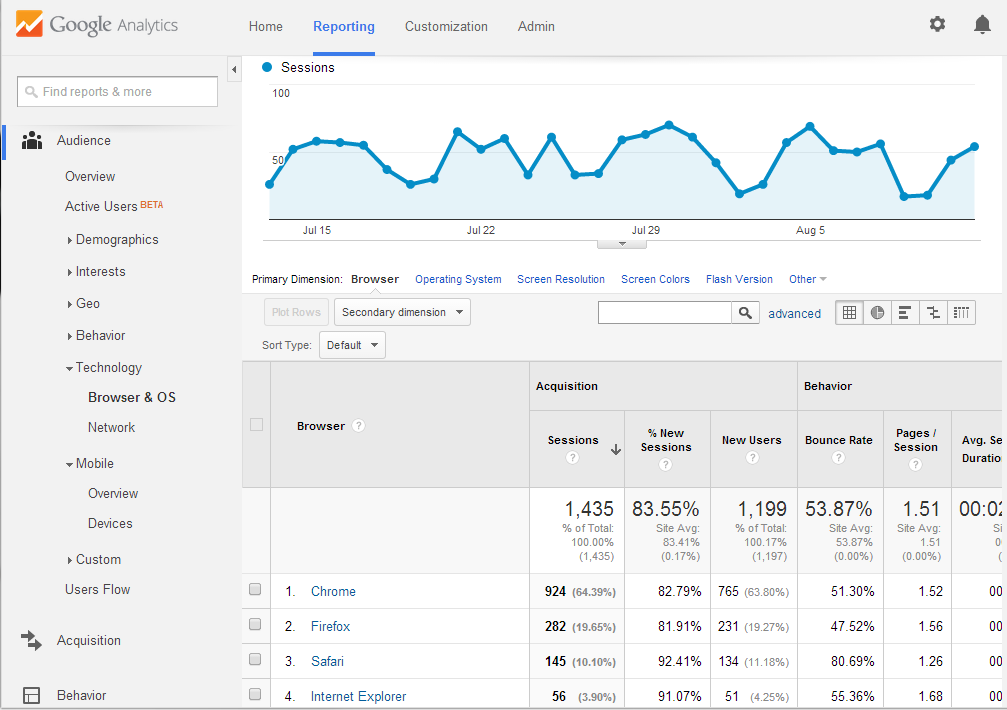
Figure 5-6. The Browser & OS page defaults to a list of the website’s most popular browsers. In this screenshot, Chrome makes up 64%, Firefox 20%, Safari 10%, Internet Explorer trailing at about 4%, and other miscellaneous browsers comprising the rest. Based on this data, you might choose to test in both Chrome and Firefox on WebPageTest.
The data shown in Figure 5-6 indicates that the Chrome browser accounts for almost two-thirds of traffic. If this were your website being analyzed, this should be a signal to you that your test configuration should focus on this particular browser. But does this mean that Chrome is also the most popular browser on mobile devices? We know that phones and tables are able to support a variety of browsers. To get a breakdown of mobile browser traffic, you can modify any page to narrow the traffic to only the mobile segment of users, as shown in Figure 5-7.
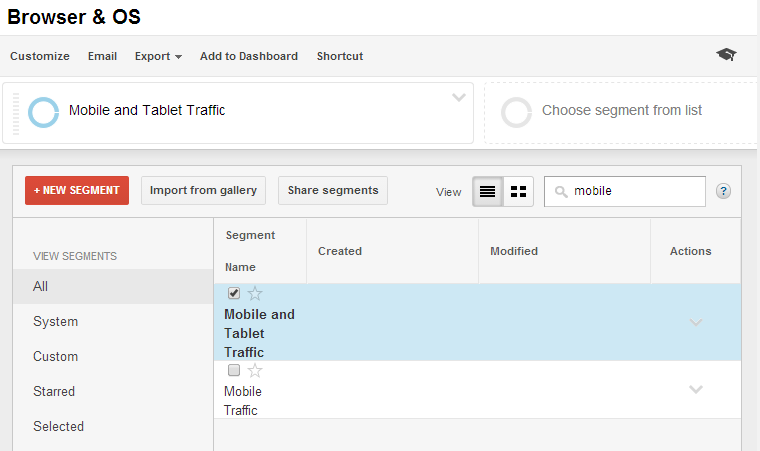
Figure 5-7. This screenshot shows how to segment traffic by mobile and tablet devices. This was accomplished by changing the All Sessions segment, which represents 100% of traffic, to the Mobile and Tablet Traffic segment, which is only 6.5% of the total. Doing this on the Browser & OS page allows you to view the website’s most popular mobile browsers and operating systems.
As the title of the page suggests, the Browser & OS page also allows you to view a breakdown of device operating systems. This is especially useful when you are viewing the mobile segment of traffic. Switching to view the list of most popular operating systems can be done by changing the primary dimension, the control for which can be found above the data table.
Although this provides a more realistic view into actual mobile usage, WebPageTest is only able to provide basic browser support for testing on mobile devices such as Chrome on Android and Safari on iOS. Mobile browsers, such as the native Android Browser, Opera Mini, and Firefox, are unfortunately not supported as of the time of writing.
Geographic Location
The location from where your tests are run matters. Lack of attention to this usually comes in two forms: testing unrealistically close to or far from the server. For example, a private test agent could be set up on the same physical network as the web server itself. This is akin to running a web server on your laptop and testing the page-load performance by opening a browser on the same machine. The time for the test agent to communicate with the server is so small that no live user could ever experience it. Conversely, it’s even easier to configure a test to run unrealistically far from the server. Imagine an Australian-based website being tested from the default WebPageTest agent in the US. If the majority of traffic originates from the US, this might make sense. However, if the website primarily serves Australians, then the latency overhead just to make one round-trip would be quixotically distracting from the actual performance issues.
As noted in High Performance Browser Networking (O’Reilly) by Ilya Grigorik, “the performance of most web applications is limited by latency, not bandwidth, and while bandwidth speeds will continue to increase, unfortunately the same can’t be said for latency.” When it comes to configuring WebPageTest, geographic location is becoming even more important considering its direct impact on the latency performance bottleneck. Due to the number of round-trips needed to service a request, latency is actually the limiting factor, not bandwidth. It is for this reason that understanding real-user demographics like geographic location are so critical. Figure 5-8 shows us a view of Google Analytics’ visitor geolocation page.
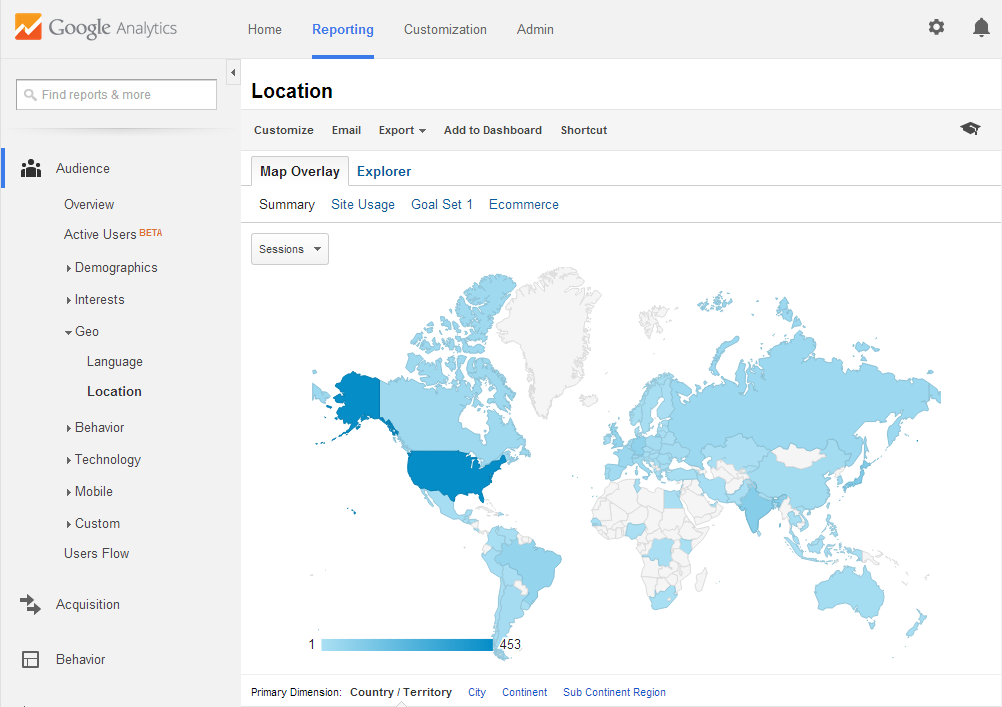
Figure 5-8. The default view of the visitor geolocation page. Visitor locations are grouped by country.
In order to determine where users are from, we turn to Google Analytics’ Audience category, under the Geo heading. This provides a map view of recent visitors, grouped by country by default. It turns out, though, that population-dense countries like India may actually be skewing the results. Popular areas that span multiple countries, like regions of Europe, are underrepresented in this kind of visualization. To account for this, Google Analytics also groups visitors by subcontinent regions (as shown in Figure 5-9). For example, France and Germany are in Western Europe, while countries like Mexico and Honduras are considered Central America. These regions provide a level of detail coarse enough to account for congested political boundaries while still accurately conveying areas of interest.
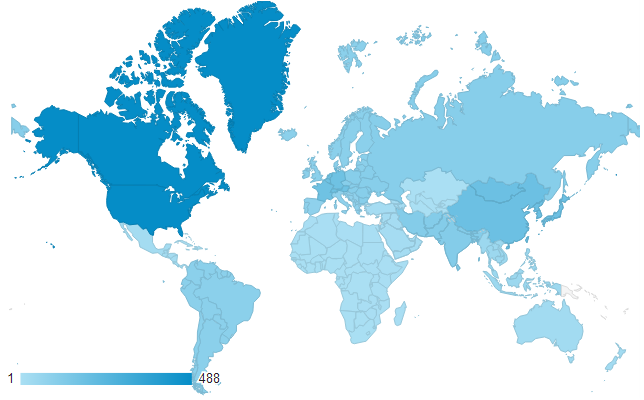
Figure 5-9. An alternate view of visitor locations groups by subcontinent region
The table in Figure 5-10 suggests that to account for at least 50% of visitors, tests should be run from North America, Eastern Asia, and Western Europe.
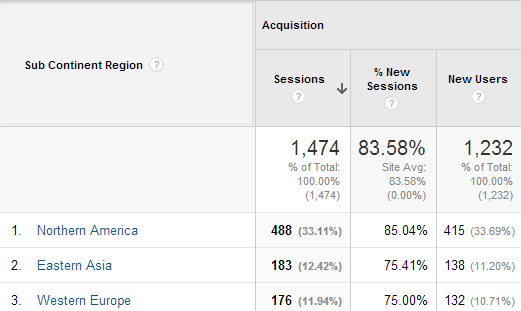
Figure 5-10. Western Europe as a whole accounts for more traffic than just India. In country view, however, India overshadows all other European countries individually.
We can drill down into these regions to see the geographic distribution of traffic within the region. On this particular website, North American traffic overwhelmingly originates from the US. Within the US, only a few states account for most of the traffic: California, New York, and Virginia. WebPageTest may not always have a test agent available in the particular region that accounts for the majority of traffic on your own website, but a neighboring test agent is the next best thing.
Figure 5-11 shows the test agent locations all around the world. This map can be used to select an agent geographically close to regions in which traffic is highest.

Figure 5-11. WebPageTest visualizes test agent locations on a map. Pins are placed around the world to illustrate the presence of a WebPageTest-enabled machine available for use.
Connection Speed
If you’ve ever connected to the Internet over a dial-up modem, you know how frustratingly slow web pages can be. Modern hardware has advanced well beyond dial-up; now we have fiber optic connections near the speed of light. The Web itself has also taken on a different shape. As a whole, the Web has gotten heavier, rich with high-resolution images and video. Users can now take advantage of higher speeds by streaming video from services like YouTube and Netflix, which accounts for about half of North America’s Internet traffic. Unfortunately, not everyone has the privilege of access to high-speed Internet. These users experience the Web much more slowly. In the spirit of this chapter to synthesize tests that represent the actual user experience, controlling test connection speed is equally important.
Real users’ connection speeds are not explicitly tracked in RUM. By using some of the metrics we’ve already explored (and some trial and error) we can make a good approximation. Let’s start by looking at the page-load times for our example website (Figure 5-12).
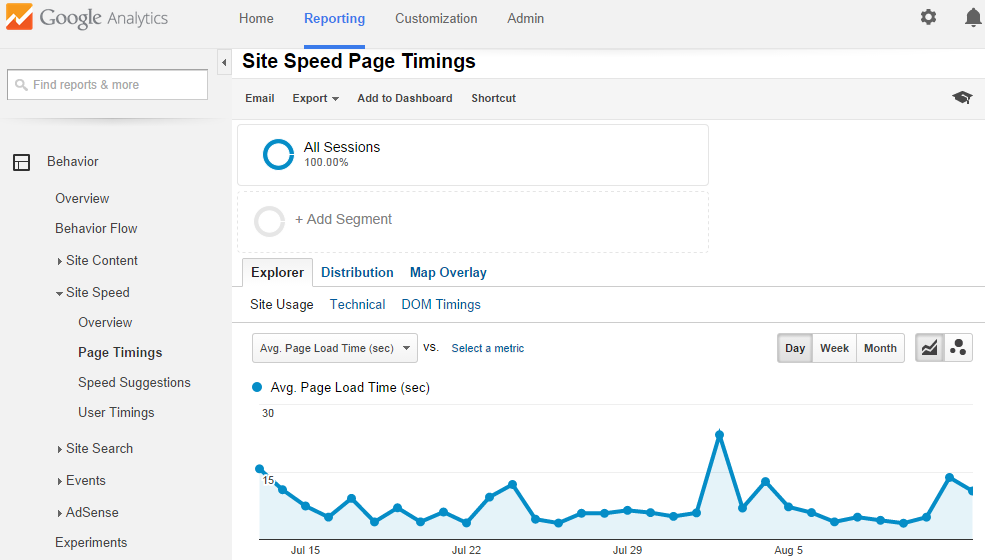
Figure 5-12. By default, the Page Timings view shows the average page-load time for the entire site over time
You can view the average page-load time for any given page, so let’s start by narrowing down to the most popular page. In Figure 5-2, we observed that the home page accounts for about 40% of all traffic. Click on the home page URL in the table below the chart to filter the page speed results to only this page.
Also recall from the previous section that geography plays an important role in web performance, so we will use the table from Figure 5-10 to select the North American subcontinent region (Figure 5-13).
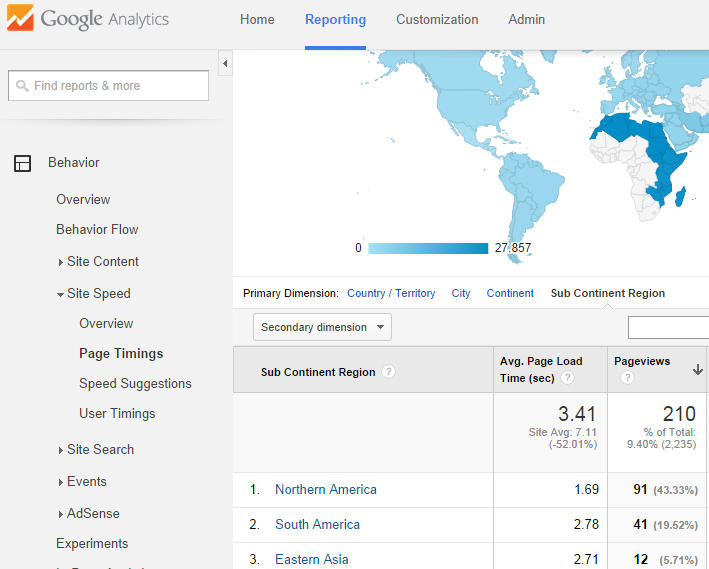
Figure 5-13. Looking at the page-load times per subcontinent region, it’s easier to see the difference in load time across the world. This view also allows us to drill down to specific regions.
To get a more accurate idea of typical page-load time, we need to look at the median time as opposed to the average by default. Statistically, the median (or 50th percentile) of a data set represents the middlemost value, which is unaffected by however large or small the outliers may be. Averages take outliers into account and can be misleading when interpreted by themselves. Switching from Map Overlay to the Distribution view produces a much better look at a histogram of load times (Figure 5-14). Using this, we can deduce the median load-time range by finding the load time at which it accounts for 50% of the total.

Figure 5-14. We can drill down the page-load time buckets to half-second increments to calculate the range in which the 50th percentile of users exist
To read this chart, start with the percentage of the first bucket, 0–1 second, which is about 28%. This is less than 50%, so we look at the next bucket, which accounts for another 58%. This exceeds the median value, so we can drill down to get finer bucket values. At 1–1.5 seconds, an additional 14% is accounted for, bringing the total to 42%. The 1.5–2 second bucket adds another 17%, so we know the 50th percentile lies in this range.
Now comes the trial and error. On WebPageTest, create a few tests of the same page originating from the same subcontinent region, in this case somewhere in North America. In each test, choose a different connection-speed profile: dial-up, DSL, cable, or fiber. What we’re looking for is a connection that produces results with a load time somewhere in the 1.5–second range. Let’s say that cable came the closest at 2.2 seconds. We can speed this up to fall in that Goldilocks range by customizing the connection speed, as shown in Figure 5-15.
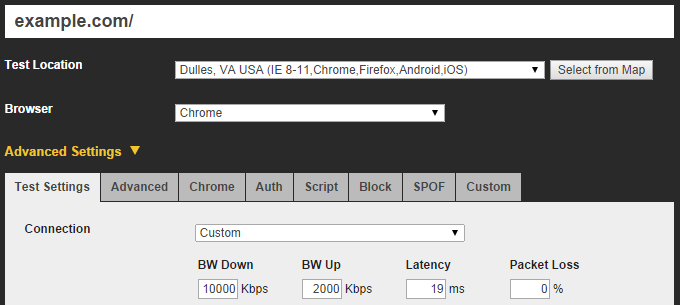
Figure 5-15. Adjusting the up/down bandwidth and latency settings gives us finer control over the speed resources travel over the network
The techniques discussed in this chapter enable you to set up your synthetic tests in a way that reflects typical usage. By leveraging software that aggregates real-user demographics, you’re able to determine the most accurate settings to represent your visitors.
With the assurance that your tests are accurate representations of live traffic, scrutiny of performance issues that manifest themselves in synthetic test results carries more weight. Optimizing the synthetic experience will more likely translate to an optimized real-user experience when you’re able to focus on the issues that actually affect them.