
Chapter 2. What’s Slowing Down My Page?
It’s good to know how fast a page is. Knowing how to make it faster is even better. Knowing the change in performance over time is extremely important to validating that the optimizations to the page are actually working. Before any optimizations can be made, however, you need to understand how the page is put together and what opportunities exist for optimization. To get there, this chapter will walk you through the steps of running a very simple test and analyzing the results to figure out what exactly is going on under the hood.
Running a Simple Test
Almost everyone who starts out with WebPageTest goes through the home page, which acts as the gateway to the rest of the tool. Putting ourselves in the shoes of someone who has never used the tool before, let’s try to run our first test.
First, go to www.webpagetest.org. One of the most prominent parts of the page is the great big text-input field, with a prompt to Enter a Website URL (Figure 2-1). Let’s get started by providing the web address of a page we want to test (Figure 2-2).
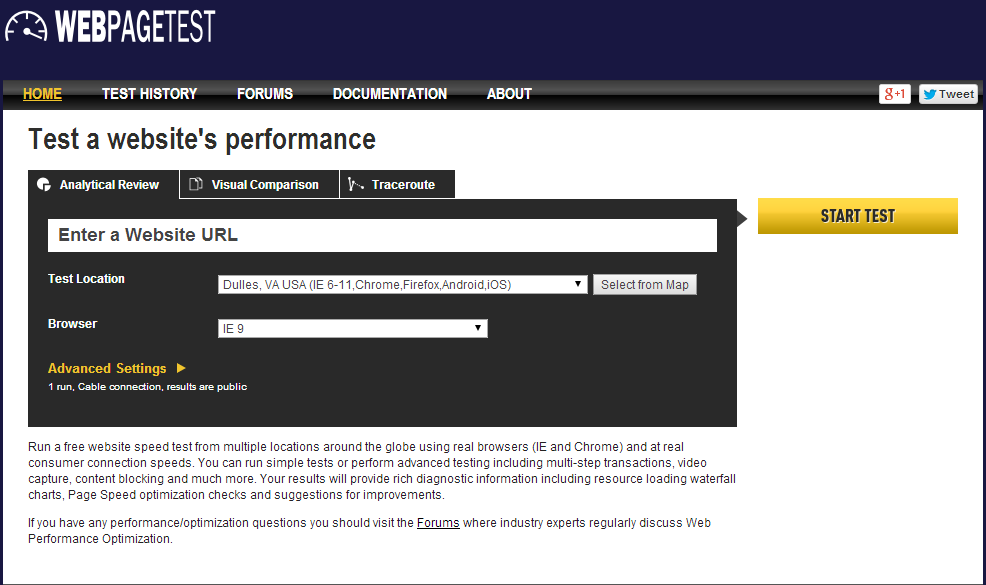
Figure 2-1. The default WebPageTest home page

Figure 2-2. The URL field of the home page set to www.example.com
At this point, you may either be feeling overwhelmed by all of the other configuration options or eager to jump in and start customizing the test. Either way, don’t worry about the rest of the options. Part II will look at some of the more advanced ways to configure tests. But for our first test, let’s simply start with a URL and see what happens when we leave everything else to its default value. To run the test, click on the big Start Test button next to the URL input field. That’s it. That’s how to run the simplest test with WebPageTest. Now the fun begins.
By now, you’ve been taken to a page that shows how the test is progressing (Figure 2-3). There are three phases in the lifetime of a test: waiting, testing, and done.
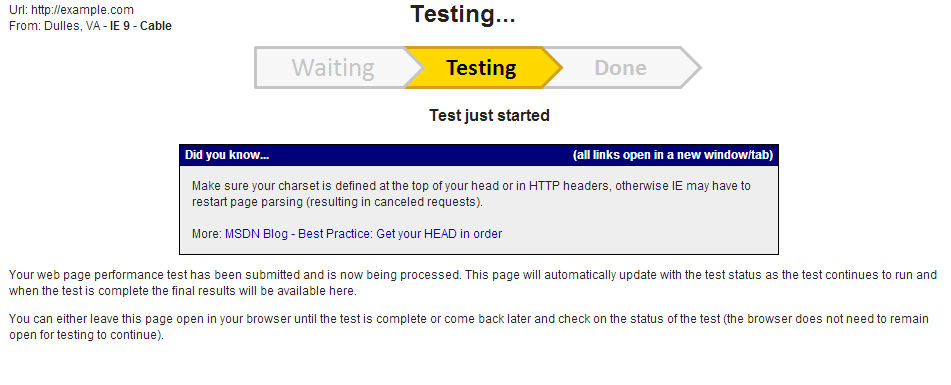
Figure 2-3. The test has progressed to the second phase and is in the process of being run
WebPageTest is a publicly accessible tool, which implies that many people may be trying to use it at the same time. The browser and location are shared commodities, and there could be a queue of tests backed up. This is the waiting phase, when the resource you need is already in use and there may be more tests ahead of you waiting for the same. This can be the most unpredictable phase because of two factors: the variable number of tests in the queue and the variable complexity of the tests. Some tests require more time to complete than others. Having many of these kinds of tests in the queue can slow down this phase to minutes or even hours. Sometimes, a test can get stuck and nothing in the queue can move until an administrator becomes available to sort it out.
Tip
To get an idea of resource availability, check out webpagetest.org/getLocations.php. This page lists the available resources for a given location and browser, which you can use to pick a lesser-utilized configuration for faster testing.
If you find yourself in a queue that’s not moving, consider changing to a different browser or test location. Each combination has its own queue, and this tool will tell you which ones are the shortest.
When your test has reached the front of the queue, it will switch to the testing phase. At this point, a browser somewhere is loading the web page you entered and collecting lots of data. Because we configured a very basic test, this phase should only take a minute. Finally, when the test reaches completion, the progress page becomes a report summary (Figure 2-4). This is where we can start to analyze the performance of our page.
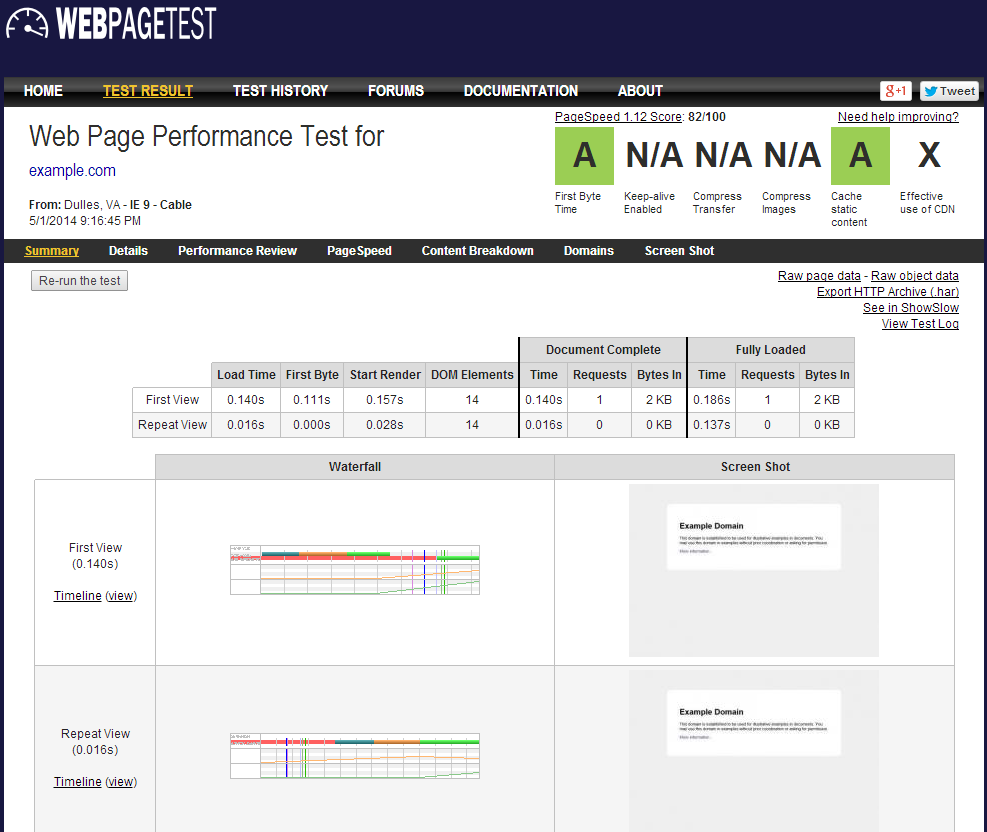
Figure 2-4. After the test has completed, the test progress page turns into the test summary page, which provides an overview of the page performance
The first place to look is the table of data. This is the metrics summary of the test, containing a breakdown of important milestones of the page-load process. From left to right:
- Load Time
-
The time from the initial request until the browser load event. Also known as the document complete time. This is the default performance metric on WebPageTest.
- First Byte
-
Time until the server responds with the first byte of the response.
- Start Render
- DOM Elements
- Document Complete
-
- Time
-
Same as Load Time.
- Requests
-
Number of HTTP requests before the load event, not including the initial request.
- Bytes In
-
Total size of the Document Complete Requests’ response bodies in bytes.
- Fully Loaded
-
- Time
-
The time from the initial request until WebPageTest determines that the page has finished loading content. The page might have waited for the load event to defer loading secondary content. The time it takes to load the secondary content is accounted for in the Fully Loaded Time.
- Requests
-
Total number of HTTP requests recorded in this test run, not including the initial request.
- Bytes In
-
Total number of bytes received in this test run.
Before each test, WebPageTest clears the browser cache to ensure that it downloads all resources. This is considered to be the first view, representing a new user visiting the page without any local copies of the resources. One of the default WebPageTest configurations is to load the page a second time without clearing the browser cache; this is known as the repeat view. The difference between the number of requests of first and repeat views is an indicator of the number of cacheable resources on the page. The metrics for each view are enumerated in the summary table.
Warning
In addition to the first and repeat views, WebPageTest has another configuration for the number of times to run the test. By default, this value is 1. The summary metrics only reflect the performance of the single test run. With so few runs, these metrics can easily be affected by network or server fluctuations. Anomalies do happen, and only running one test can disguise the anomalies as realities. One WebPageTest best practice is to run tests multiple times and choose the most representative run to look at. Tests can be run up to nine times (not including repeat views). The method for choosing the most representative test run is to sort all runs by some metric and choose the middle-most run. By definition, this is referred to as the median run. The default median metric is the document complete time or load time.
There exists a URL parameter named medianMetric. Change the metric used to calculate the median run by providing the medianMetric URL parameter. Set its value to one of the other metrics’ names, and the summary metrics will reflect this other run. For example, ?medianMetric=bytesIn chooses the median based on the number of bytes downloaded. See “Details of Requests In Test Results” for a full list of median metric options.
After running this simple test, we’re able to report on the summary metrics to get an idea of how fast or slow the page performance was. Keep in mind, though, that the performance of the test may not be representative of the actual performance live users of the page are experiencing. The real value in these metrics comes from comparing them against the performance of other similarly configured tests. Comparison is the key to determining whether the differences between tests have made a positive or negative impact. This first test won’t do much good unless we’re able to find ways to optimize the page and rerun the test for comparison, so in the next section we will look at how to read the waterfall diagram to find out what could be slowing the page down.
Reading a Waterfall
Undeniably, the most important part of a web performance report is the waterfall diagram. Waterfalls are a visualization of the network activity, which is broken down into individual HTTP requests (see Figure 2-5).
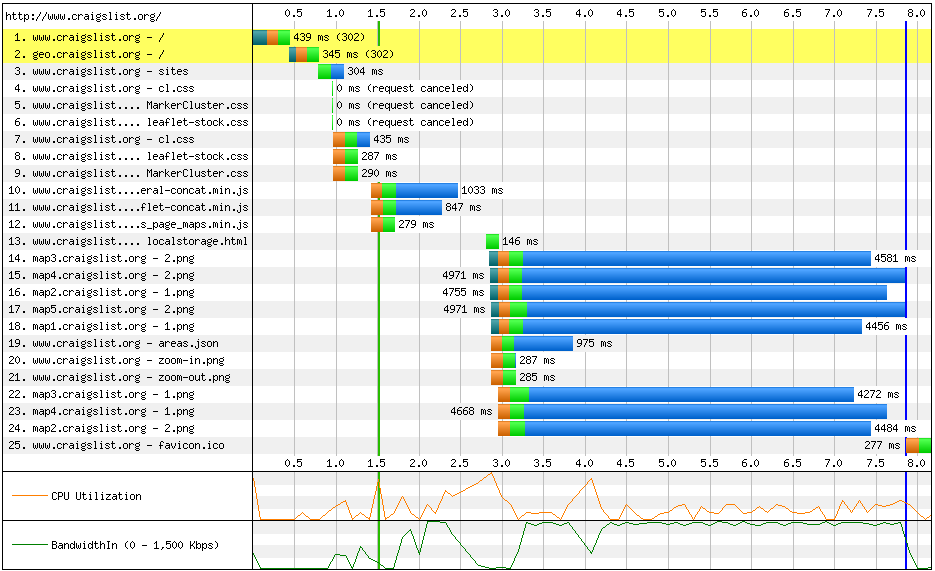
Figure 2-5. An example of a waterfall
Each request is made up of five main phases:
- DNS lookup
-
The time to resolve a human-friendly hostname like http://www.example.com to its Internet Protocol (IP) address. An IP address is like a phone number unique to the computer that will be serving the web page. Resolving the DNS of a web page is sort of like looking through a phone book.
- Initial connection
-
The time for the browser to establish a connection to the server. If resolving the DNS of the server is like looking up a phone number, this is the step of dialing the number and waiting for someone to answer.
- SSL negotiation
-
The time for the browser and server to agree on a secure way to communicate. This step is skipped for plain HTTP requests but is a requirement for secure protocols like HTTPS and SPDY.
- Time to First Byte (TTFB)
-
The time for the server to prepare the response to the request. Prior to this phase, the server had no idea what the request was even for. This is when the server looks something up in a database or calls an external API.
- Content download
-
The time for the server to send the entire contents of the response. This time is directly proportional to the size of the response and the speed of the connection.
Figure 2-6 shows a request with all of the previously listed phases.

Figure 2-6. An example of a request with all five phases: DNS lookup (teal), initial connection (orange), SSL negotiation (purple), TTFB (green), and content download (blue)
Waterfalls are also decorated with bars and lines, marking the times at which page-level events occur, as shown in Figure 2-7.
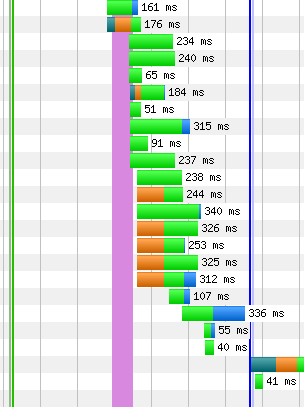
Figure 2-7. The waterfall events shown behind the requests. From left to right: msFirstPaint (light green), Start Render (dark green), DOM Content Loaded (pink), Document Complete (dark blue), and On Load (light blue)
There are four basic page-level events:
- Start Render (first paint)
-
The time for the browser to display the first pixel of content (paint) on the screen. There are two separate events shown, one for each method of measurement. Start Render is WebPageTest’s own metric, determined by programmatically watching for visual changes to the page. This is illustrated in the section “Filmstrip and Video”. The other metric is reported by the browser and represents the time it claims to have first painted to the screen.
- DOM Content Loaded
-
After the browser has received the HTML payload, it parses it into the DOM, which is a virtual representation of the page structure. The browser will fire an event to let the page know that the DOM is ready so that the page can go on to interact with it. One such interaction, for example, would be to assign a click-event listener to a button. This page-level event has both a start and end time, representing how long the page spent handling the DOM ready event.
- On Load
-
The start and end time of the page’s load-event handler. The browser fires the load event when the DOM is ready and all images have loaded. Pages typically use this event handler to perform secondary tasks like loading content below the fold (outside of the user’s viewport).
- Document Complete
-
Effectively, the time that the browser fires the load event. This event name can be considered a misnomer because the document may not necessarily be complete. Around this time, the page’s script is hard at work in the load-event handler firing off more requests for secondary content. The incomplete nature of this metric is why Fully Loaded was added to the table of metrics from the previous section.
The final type of waterfall adornment is the request highlighting. Yellow and red highlights are applied to request rows to indicate that some kind of inefficiency or error occurred.
Highlights fall into three main categories:
- Errors (red)
-
The most common cause for this is likely to be HTTP 404 errors (Not Found), which can occur if the URL of a resource was mistyped or if the resource was deleted from the server. Other typical errors include HTTP 500 internal server errors, when the server can’t respond to the request because of a bug in its own code. See Figure 2-8.
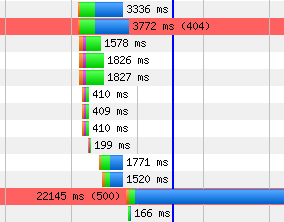
Figure 2-8. A series of requests, two responses to which are shown as errors: HTTP 404 (Not Found) and 500 (Internal Server Error)
- Redirects (yellow)
-
A resource was requested at one particular URL and the server reported that it does exist, but under a different URL. The alternate URL is returned and the browser has to try again. These are HTTP 301 and 302 response codes (Figure 2-9 and Figure 2-10). This is inefficient because the browser had to repeat its request, further delaying the time to load the resource. Redirects commonly occur when the server rewrites the URL of the page, such as from example.com to www.example.com. Secure web pages may even redirect users from http://example.com to https://example.com. Or even worse, both: http://example.com to http://www.example.com to https://www.example.com. These redirects occur on the initial request before any content has even been loaded, so they are considered especially harmful to page performance.
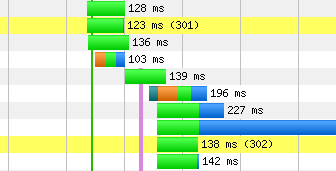
Figure 2-9. A series of requests, two responses to which are shown as redirects: HTTP 301 (Moved Permanently) and 302 (Found)
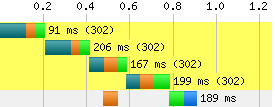
Figure 2-10. The initial request for a page is redirected four times in a chain reaction of redirection. The initial request is already at a 800 millisecond disadvantage. This happens when the server tries to rewrite a page URL, commonly to a different subdomain or protocol, which in turn causes another rewrite, and so on, until finally the actual resource is able to load.
- Cache (yellow)
-
In repeat views, which is the second pass of a page with the browser cache already warmed up, some resources have been downloaded but didn’t include information about how long they are valid. For each of these resources, the browser had to ask the server if what it has in cache is still valid. The server responded with an HTTP 304 code (Not Modified) to answer that the file has not been changed since it was cached, as shown in Figure 2-11. Having a resource in cache is always better than having to download it all over again, but this 304 response should not be necessary. When the server sent the resource to the browser the first time, it should have included all of the pertinent information of its cache lifetime.
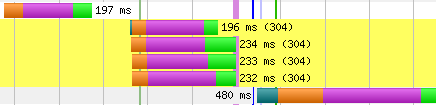
Figure 2-11. A series of requests, four responses to which are shown as 304 (Not Modified)
Waterfall Slope
In addition to the lines, bars, and colors in a waterfall diagram, there’s another, more subtle indicator. Remember that the start offset is the amount of time that has passed since the page started loading until the request is finally made. Waterfall shapes are determined by the start offsets of the requests. Shapes can be tall, short, wide, or narrow depending on the number of requests and the rate at which they are completed. See Figure 2-12 and Figure 2-13 as examples of these variations. Identifying the shape of a waterfall is an easy way to see the performance big picture.
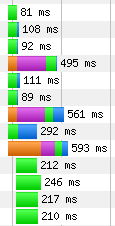
Figure 2-12. An example of a series of requests in a waterfall with tall and narrow slope. Many requests are initiated at roughly the same time, as illustrated by their mostly aligned left edges.

Figure 2-13. An example of a series of requests in a waterfall with short and wide slope. Several requests are made in a row but with a noticeable amount of time between them. The horizontal slope here is an indicator of inefficient network utilization.
Waterfall shapes are simply a general descriptor for a page’s performance. To really understand which requests are hurting performance, we need to look at the waterfall’s slope. Recall from geometry that the slope of a line in a coordinate system is its height divided by its length, or “rise over run.” In a waterfall diagram, things are a little different. The top-left point is the origin (or zero value), so increasing requests actually go downward. Still, we can apply the concept of slope to waterfalls in order to better understand them.
Looking at a waterfall from the perspective of request start offsets, you can begin to notice similarities and differences. For example, many requests in a row with close to the same start offset appear stacked. If you draw a line to the left of the requests, the line will look almost vertical, as shown in Figure 2-14. In terms of slope, this is ideal. What it means is that in a given period of time, many things were happening. The opposite would be a case when adjacent requests have very different start offsets, in which case the slope line would be long and approaching horizontal. These imaginary near-horizontal lines are excellent indicators of poor performance afoot. In essence, something is happening such that requests are getting delayed.
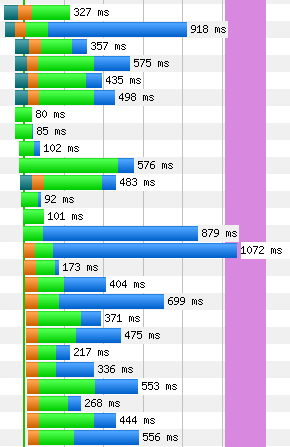
Figure 2-14. An example of a long series of requests in a waterfall with tall slope. These are mostly images loading over five domain shards. The vertical slope is an indicator of efficient use of the network.
There are a couple of key considerations when looking at waterfall slopes. First, be aware of the scale of the time axis. Tests that run in a short amount of time may sometimes be shown in units of half a second, which would exaggerate the horizontal aspect of slope. Second, keep in mind which requests are most important to the user experience. Many requests may be necessary to construct a usable page. The critical path is the name for the requests that are required to get the page to this state. The slope of the critical path should always be as vertical as possible. In contrast, the slope of requests outside of the critical path should be second in priority.
Connection View
To recap, the waterfall diagram is a visualization of the network traffic while a given page loads. This view is great for spotting most performance anti-patterns related to the critical path. WebPageTest provides an alternate view, called the connection view, focused not on the sequence of requests but rather the connections through which requests are made (Figure 2-15). This type of view lends itself to better illustrating how the networking between server and browser works.
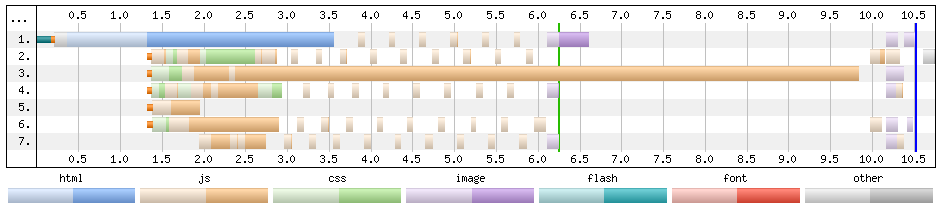
Figure 2-15. The connection view for a page with many JavaScript resources, as indicated by the color coding. Each row is numbered 1 through 7, representing seven total connections. Each connection would normally be labeled with the host to which it is connecting, but this information has been omitted from the figure for simplicity.
Each row in the connection view diagram represents a communication channel established over the Transmission Control Protocol (TCP). It’s not uncommon to see multiple connections opened for the same domain. When this happens, requests are able to be made in parallel, which can be useful for taking advantage of available bandwidth. Note, however, that with multiplexing support in HTTP/2, it is no longer necessary or beneficial to open multiple connections. A single connection can efficiently stream multiple responses concurrently.
Drawn in each row is one or more requests. Although the requests are illustrated differently from the waterfall diagram, keep in mind that the same data is being shown in the connection view. The DNS lookup, initial connection, and SSL negotiation phases are shown as short bars before the first request in each row. By definition, each row has one and only one initial connection. Further, each domain has one and only one row that completes the DNS resolution phase. This illustrates the reuse of phases between subsequent requests to the same domain. The domain name does not need to be resolved again, plus open connections can be reused without penalty of creating another.
The TTFB and content download phases are included, but their colors are unique to the content type of the request. For example, JavaScript resources are tan and images are purple. The legend below the diagram shows what each color represents. The lighter shade is the TTFB and the darker shade is the content download phase. Be aware that very small resources may have download times so small that the darker shade is virtually imperceptible. All of this color coding has nothing to do with connections, but it still adds some value to the diagram by making it easier to spot patterns and irregularities.
Common Anti-Patterns
So far, we’ve looked at ways of reading a waterfall to conclude that something is wrong. But to figure out what is wrong, you need to know what you’re looking for. Some performance problems have a telltale signature, called an anti-pattern, that they leave behind in a waterfall. Spotting these anti-patterns takes some practice, so in this section we’ll look at a few common performance issues and their signatures.
Long first-byte time
If we’re going to look at common performance issues, let’s start with the one that people seem to need a lot of help with. A tweet in December 2012 by WebPageTest creator Pat Meenan, stated that 90% of the posts on the tool’s forums had to do with excessive time-to-first-byte results. At the beginning of this chapter we defined First Byte as the time from the request to the first byte of the response. This isn’t to be conflated with the Time to First Byte (TTFB), which is one of a few phases of the initial request that can contribute to unacceptable first-byte times.
Starting from the beginning, DNS resolution could be affected by long certificate chains or high latency on the name servers. Long DNS resolution could be debugged using free online tools. The connection phase of the initial request could be compromised by inefficient server settings, such as a small congestion window, which would result in more round-trips than necessary. The security negotiation phase requires even more round-trips between the browser and server to secure the connection. Despite everything that can go wrong in the first three phases, the TTFB phase tends to be the culprit, as shown in Figure 2-16. This is the phase affected by long-running server processing, typically database access. Because the server is outside of WebPageTest’s instrumentation reach, diagnosing backend issues will require additional tooling.
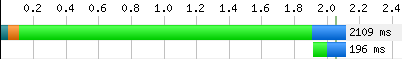
Figure 2-16. A 2,109 millisecond request with a 1,795 millisecond TTFB, which accounts for approximately 85% of the total request time. The subsequent request is blocked during the entire TTFB phase.
This anti-pattern is arguably one of the most detrimental because it affects the initial response, which contains the markup and styles necessary to draw something onto the screen. Users waiting for the response would have no visual fodder to alleviate the wait. Anti-patterns after the first paint would at least leave something on screen for users to preoccupy themselves with, unlike this one. This first request’s performance impacts the lower limit on how fast the page can get. No amount of optimization on the frontend can change how quickly the backend is able to service requests.
Reopened connections
One of the easiest anti-patterns to spot in the connection view is the problem of not reusing connections. In order for the browser to request a resource from the server, it needs to have an open connection, or channel, over which to make the request. These channels are usually left open for the browser to reuse for its next requests. This is accomplished by the server instructing the browser how long the connection is good for. Without it, the browser must initiate a new connection for each and every request, as shown in Figure 2-17. The underlying connection protocol, TCP, is known as the three-way handshake for the number of messages between browser and server. So for every request, additional time-consuming round-trips are unnecessarily incurred. This is made worse for secure requests, which require even more round-trips for the SSL negotiation phase. Reused connections share the preexisting security, avoiding the need to spend redundant time establishing another channel. Enabling connection reuse requires a change to the web-server configuration; the Keep-Alive setting must be turned on. Fortunately, this is an easy and well-documented change.
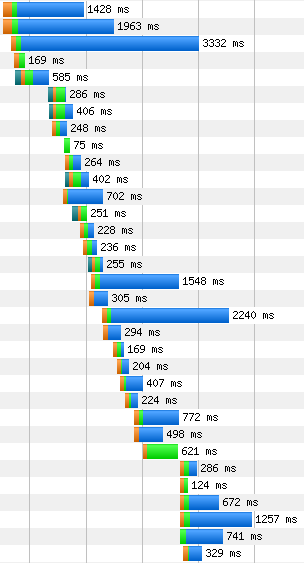
Figure 2-17. Looking closely, you can see that many of these requests start with a small orange bar to indicate that new connections are being made. This is time that could otherwise be spent downloading the requested content.
Closing connections is the signature anti-pattern of the connection view. By design, each row is a connection, so you’d normally expect to see connections to the primary content server being reused for multiple requests, leading to many resources shown side-by-side. For this anti-pattern, however, connections are used only once, so each row would only contain a single request. This problem is unique to each server, so it may not be a problem throughout the entire diagram.
Canceled requests
Consider a page with relatively complex markup consisting of many elements, several levels deep. This page was built with some best practices in mind, so the script tags were appended to the body of the document. After making the initial request for this page, a simple browser would receive the response data and linearly parse the document to construct the DOM. As it parses further and deeper into the markup, more time passes before those footer scripts are loaded. Finally, after everything above the scripts is parsed, the scripts can be requested from the server. If this seems inefficient, that’s because it is. Modern browsers are smarter than that, so they use a technique to find resources like these scripts earlier, but not always without making a mistake.
Modern browsers employ lookahead scanning on a page to get a sense of what will need to be loaded. Think of it as two parsers on the document at the same time: one does the simple job of parsing the markup into the DOM, and the other—known as the lookahead pre-parser—jumps ahead to find external resources that will be needed by the page. When the lookahead pre-parser finds one such resource, it tries to download it as soon as possible. The problem is that the DOM may contain information relevant to that resource, which may not have been parsed yet. If this happens, the lookahead pre-parser will have wastefully started loading a resource that cannot be used anymore, and WebPageTest will record this as a canceled request. Canceled requests will eventually be completed later, resulting in a duplicate entry in the waterfall diagram.
This problem, mostly limited to Internet Explorer, happens because the lookahead pre-parser makes some incorrect assumptions about the resources it’s trying to preload. For example, if a script source attribute is given a relative file path like /main.js, the lookahead pre-parser may see this and assume that the file is relative to the current host. However, there is a way to override the host to use for relative paths in HTML; this is known as the base tag. If content is served over www.example.com, the base tag can be used to supplant the host with something else, like foo.example.com, where all relative file paths should be served. If the lookahead pre-parser gets to the main.js script before the DOM parser finds the base tag, it will incorrectly look for the resource at www.example.com/main.js. Even if a resource exists at that location, it’s still not what the document actually requested and it must be discarded. Similarly, other kinds of markup can invalidate preloaded resources like the charset and x-ua-compatible meta tags. As is the situation with the base tag, these tags can lead to invalid assumptions about the resources to be loaded on the page.
Canceled requests have noticeable effects on the performance of a web page. The resources that the lookahead pre-parser was trying to preload may have been unnecessarily competing for bandwidth with other important resources on the page (Figure 2-18). Worse, when the resources are finally loaded, they may come through seconds after the initial attempt.
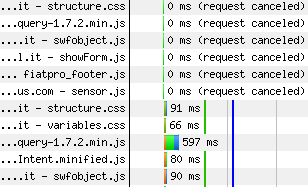
Figure 2-18. Requests for several resources are shown as canceled. Many of the subsequent requests are for the same resources, duplicating effort.
Fortunately, there are some best practices that can help you avoid this situation. Meta tags with equivalent attributes to HTTP response headers should be set as a header to begin with. This avoids preload invalidation because the lookahead pre-parser knows to make the correct assumptions before the DOM parser even begins. As for the base tag, if it must be used, it should be included as early in the HTML head element as possible. This will reduce the amount of time that the lookahead pre-parser has to make incorrect assumptions, but it is not bulletproof.
Network silence
Maintaining good waterfall slope requires the number of requests in a given time to be high. Of the anti-patterns that kill slope, network silence is the epitome of suboptimal request scheduling. A silent network means that requests are not being made. This is fine if the page has finished loading, but when there are still outstanding resources, they should be loaded as soon as possible. The observable clues to network silence are long pauses or gaps between requests in the waterfall, low bandwidth utilization, and, more rarely, high CPU utilization.
An inverse relationship between CPU and bandwidth during a period of network silence is usually indicative of a blocking process. Because the browser’s main thread is busy on a long-running process, it is unable to proceed with other jobs in the queue, such as fetching additional resources. There are a couple of ways that a web application can hold up the queue like this. Most commonly, slow JavaScript is to blame. Scripts that do too much, like iterating over a very large list and processing each item, will take a noticeably long time to complete, as shown in Figure 2-19. When this happens, the browser is unable to respond to user input, including click or scroll events. One technique to mitigate this effect is to yield the thread back to the browser by using requestAnimationFrame or setTimeout to delay additional processing after the script has run for some time. Complicated markup can also take a long time to process. For example, using HTML tables for layout has often been discouraged because of its lack of semantics. Using tables for layout could also be computationally expensive, due to the high cost of laying out a table that changes size to fit its content. This can be avoided by using less expensive markup for layout. Also keep in mind that the impacts of slow JavaScript and complicated markup are exacerbated on a slower CPU.
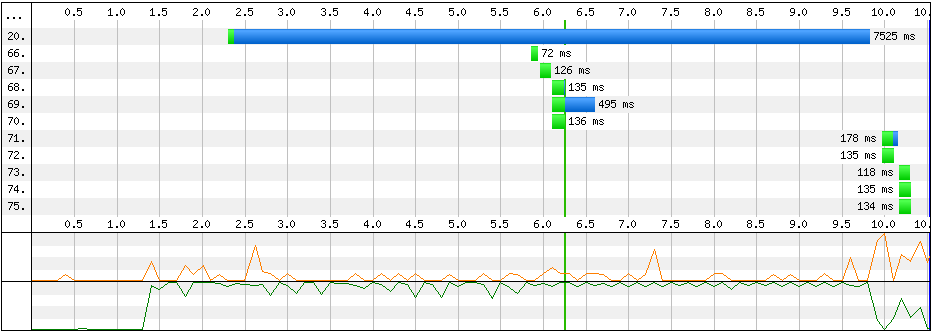
Figure 2-19. In this abbreviated waterfall, the gap between request numbers 70 and 71 is nearly four seconds long. The low CPU and high bandwidth utilizations suggest that request 20 is likely to blame for blocking request 71.
As easy as it is to see network silence in a waterfall diagram, WebPageTest is not equipped to identify the underlying problem by default. As with the problem of a long first-byte time, the tool is great at showing that there is a problem but additional tools are necessary to determine what the problem actually is. In the case of network silence, a profiler is required.
WebPageTest Grades
Similar to YSlow, the web performance analysis browser plug-in developed by Yahoo!, the WebPageTest grades evaluate the page data captured by the test and show whether the page has passed or failed a certain goal. There are several goals being tested, all of which were chosen to be the most essential performance benchmarks. For example, YSlow or Google’s Page Speed tool might give a grade for combining multiple stylesheets into one. In reality, there can be valid reasons for loading multiple stylesheets, yet these tools aren’t necessarily able to take that into consideration. The WebPageTest grades, on the other hand, are a set of web performance must-haves to which most, if not all, pages should adhere. In this section, we’ll look at how the grades are evaluated and what you can do to improve them.
In general, grades are evaluated first as a percentage. The numeric values are converted to the familiar letter grades on a standard academic scale:
| Letter Grade | Percentage |
|---|---|
A: |
90%+ |
B: |
80–89% |
C: |
70–79% |
D: |
60–69% |
F: |
0–59% |
The intention of the grades described in this section is to call attention to some of the most important web performance best practices. The grades are organized so that the most critical appear first. This means that you should focus your efforts on optimizing things like connection reuse and gzipping before moving on to other important but less impactful optimizations like image compression or content delivery networks.
First-Byte Time
The first-byte time is the time at which the browser receives the first byte of the HTML content. This grade rates how tolerable the first-byte time is for the test. Up until this time, the only things going on are the network-level connections and the server-side processing. As a reminder, these phases are the DNS lookup, initial TCP connection, SSL negotiation (where applicable), and TTFB. WebPageTest rates a test’s first-byte time by looking at how long these phases take in aggregate and comparing it against a target time. The closer to the target time, the better the rating.
The formula to compute the grade of the test is based on the expected number of round-trips between browser and server. The grade automatically fails if the first-byte time is greater than seven round-trips plus some allowance time. The target time is expected to be three round-trips plus allowance time for SSL negotiation:
target first-byte time = RTT * 3 + SSL
If the initial connection is less than three seconds, RTT = initial connection. Otherwise, RTT is the network shaping latency time (i.e., 28 ms for Cable) plus 100 ms. See the section “Traffic Shaping” for more on customizing the connection speed.
The percentage value for this grade is evaluated by the following formula:
value = 100 - ((observed first-byte time - target first-byte time) / 10)
For demonstration purposes, let’s evaluate the first-byte time for a hypothetical test. The first-byte phases of the initial request are:
-
100 ms DNS lookup
-
150 ms initial connection
-
500 ms TTFB
The target first-byte time would be three times the initial connection, or 450 ms. The observed first-byte time (the sum of the phases) is 750 ms, which is 300 ms slower than the target time. That would make the value 70, resulting in a C grade.
target first-byte time = 3 * initial connection = 3 * 150 ms = 450 ms
observed first-byte time = 100 ms + 150 ms + 500 ms = 750 ms
value = 100 - ((750 ms - 450 ms) / 10) = 100 - (300 / 10) = 100 - 30 = 70
In this way, WebPageTest does a good job of highlighting the opportunity for optimizing the first-byte time. At a glance, it should be easy to see that the initial request TTFB is dragging the grade down.
Keep-Alive Enabled
The grade for enabling Keep-Alive measures the effectiveness of connection reuse. As we’ve seen in the “Reopened connections” anti-pattern section, closing connections are a missed opportunity for performance enhancement. Necessitating additional round-trips between the user and the server to initiate a connection is redundant and time-consuming. The purpose of this grade is to evaluate the extent to which requests are inefficiently reopening connections.
Recall that a connection must be made whenever the page is communicating with a new host. For example, a page with two resources from a single host should ideally make a connection for the request for the first resource and reuse that same connection for the second resource. We say that the page has two requests to the same host, the first of which is expected to negotiate a connection and the second of which is expected to communicate using the already-open channel.
The grade is evaluated according to the following formula:
value = number of reused connections / expected number of reused connections
Let’s look at another hypothetical test to see how the grade would be evaluated. The requests per host are:
-
1 request to Host A
-
10 requests to Host B
-
7 requests to Host C
The expected number of reused connections can be expressed as the total number of requests less one initial connection per host. That would make 15 reused connections. Hypothetically, however, Host B is the only one that has the Keep-Alive configuration enabled. Hence, the number of reused connections would only be Host B’s requests (10) less the initial connection: 9. Therefore the value would be 9/15, or 60%, equal to a barely passing grade of D. In other words, 60% of the requests could have shaved a round-trip’s worth of time off simply for reusing the existing open connection.
Compress Transfer
Like Keep-Alive, compressing text-based resources over the network is a straightforward server-side configuration. When enabled, resources like HTML, JavaScript, and CSS files will be compressed, or gzipped, resulting in a smaller file size and quicker download. The grade for compression is also like that for enabling Keep-Alive in that it is a ratio of the actual performance over the expected performance.
The exact formula for this grade is:
value = optimized resource size / actual resource size
To determine the optimized resource size, WebPageTest actually compresses each and every resource to find out if it is suitably smaller than the size of the resource as it was transferred. “Suitably smaller” in this case means that the resource is more than 10% smaller and more than 1,400 bytes when compressed. If a resource meets these conditions, the test is penalized in proportion to the number of bytes that could have been saved.
Note that because images are binary resources, they are excluded from the compression grading. But they are not exempt from scrutiny, as the following two grades are especially for them.
Compress Images
Just as text-based files can be gzipped to save bytes and time, images are compressable as well. WebPageTest specifically evaluates JPEG images by optimizing them and measuring the difference. A test is penalized if it contains images that can be reduced in size by configuring them to load progressively and degrading visual quality to 85%. The exact evaluation is:
value = optimized image size / actual image size
After compressing each image, its size is compared to the actual image without optimizations. The greater the difference, the lower the score. For example, if 1 MB of images could be compressed by 150 KB, the optimized image size would be ~85% of the actual size, resulting in a grade of B.
Progressive JPEGs
JPEG images are one of two types: baseline or progressive. Most images used on the web are baseline, which appear to load from top to bottom. Progressive JPEGs, on the other hand, show the entire image with low quality at first, and then with gradually increasing quality. The advantage of the progressive JPEG type is that the user perceives it as loading more quickly, even if it is of low quality. As we’ll discuss in “Perceived Performance”, giving users the perception of speed is a very valuable optimization.
This grade is evaluated by the ratio of the number of progressive bytes in a JPEG to its total size:
value = progressive bytes / total bytes
The WebPageTest grading is based on 10 KB chunks of the image, each of which is checked for a new scan. Scans are the gradual increases of quality. If the chunk contains a scan, all 10 KB are considered to be progressive bytes. All of the test’s JPEGs are checked and the bytes are tallied to come up with a final value, which is then expressed as a letter grade.
Cache Static Content
Static resources like images tend not to change often. Repeated visits to a page may be redundantly downloading these resources if they are not properly configured to stay in the browser’s cache. This grade checks the HTTP responses for resources that are determined to be static and evaluates them based on their lifetime:
value = expiration score / number of static resources
This formula is a little different from the previous grades, as it relies on a scoring system. The way it works is that a static resource’s response headers are inspected for a cache lifetime value. This could come from a Cache-Control: max-age or Expires header. A static resource is given a score of 100 if its lifetime is greater than a week. If not, it can still be redeemed for 50 points if its lifetime is greater than an hour. Otherwise, it receives a score of 0. The scores for all static resources are tallied and divided by the total number of static resources to get the percent value.
Effective Use of CDNs
A content delivery network (CDN) is a system for distributing resources to servers geographically closer to users. One benefit of this is that the round-trip time is faster. The formula is straightforward:
value = static resources served from a known CDN / number of static resources
WebPageTest keeps a log of known CDN providers. Each static resource is checked to see if its host server was one such provider. The more resources served from a CDN, the better the value. This grade is unique in that there are only two possible outcomes: pass or fail. The passing grade for using a CDN effectively is to have at least 80% of static resources served from a CDN.