Chapter 5
What Is Edge?
Edge is the value created in an option’s sale or purchase when you are able to exploit fair value to produce consistent profits. There are those that teach that edge is the embedded ‘extra premium’ that naturally exists in selling options. This is the foundational thesis of my first book, The Option Trader’s Hedge Fund. In this book, I introduced the concept of TOMIC (The One Man Insurance Company). This is an approach to trading options based on market volatility and discipline, a technique similar to that used for risk assessment by insurance companies. In this chapter, we begin to break that concept apart by discussing the relative value of an option, and how to determine if an option should be bought or sold. Thus, edge is not just the ‘insurance’ value of an option; edge is the value created when you can buy an option cheaply relative to normal levels, or sell an option at a higher than normal rate. For instance, if you have a value of 1.00 on an option and the market maker acquires edge from a bid-ask spread, the trader that is initiating the order wants to buy it for any number less than 1.00. You may find a period of time where IV is so depressed that the 1.00 option is offered at a buy of 0.95 or a sale of 1.05. The question many traders have when evaluating option pricing is how to tell a good trade from a bad trade. It’s time to delve into the relative value of an option, how traders develop the true value of an option, and how to determine what should be bought and what should be sold.
Edge
What is edge, really? Edge, in short, is exploiting option pricing to take advantage of overly cheap or expensive contracts. In capturing edge, traders need to be able to sell premium when IV is high and buy premium when IV is low, but how do you recognize this? It starts with knowing the volatility of the product under consideration. SPX traders that stand in the pit all day generally know the volatility. One of my true mentors of trading, as I mentioned in Chapter 3, was the Gator, Scott Kaplan. In the products he traded, he knew volatility levels so well that he could walk away from the pit or the trading screen for a week, and if I named the volatility levels and the current level of the S&P he could walk into the pit and start trading. Thus, when he was in the pit, watching trading all day, he could spot the good ones from the bad in an instant.
I am not expecting all the readers of this book to understand volatility at the level of a professional trader, however, you can prepare to trade like a professional. Additionally, the ability to initiate a trade gives you the ability to skip the ‘average trades’ and go after the trades that are clear winners. The key is volatility charts. Yes, every trader should have a list of stocks they follow closely. But because of the availability of good vol charts and the trader’s understanding of the zones, you should be able to figure out where IVs of a trade are within a few minutes. The steps are simple:
- Review the HV of the underlying at the 10, 20, and 60 day levels.
- Review the IV of the product.
- Establish the product’s trading zones for HV and IV based on bullets 1 and 2. In what zone is the product’s HV and IV trading?
- Know the zone of the whole market.
- Determine if there is a trade with edge.
Let’s walk through this trading process.
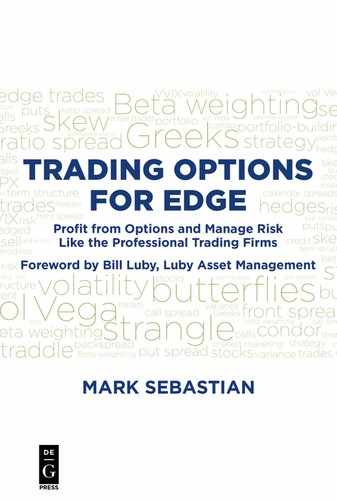
Like the market as a whole, each stock has its own levels of realized volatility and implied volatility it hangs in. The product will typically reach levels that are at the extremes but it does not stay there for long, and will have normal levels in which it meanders—between zones 1 and zone 4. Let’s take a look at a chart of movement in AAPL from September 2015 to September 2016 at the 10, 20 and 60 day HV levels.
10 Day HV

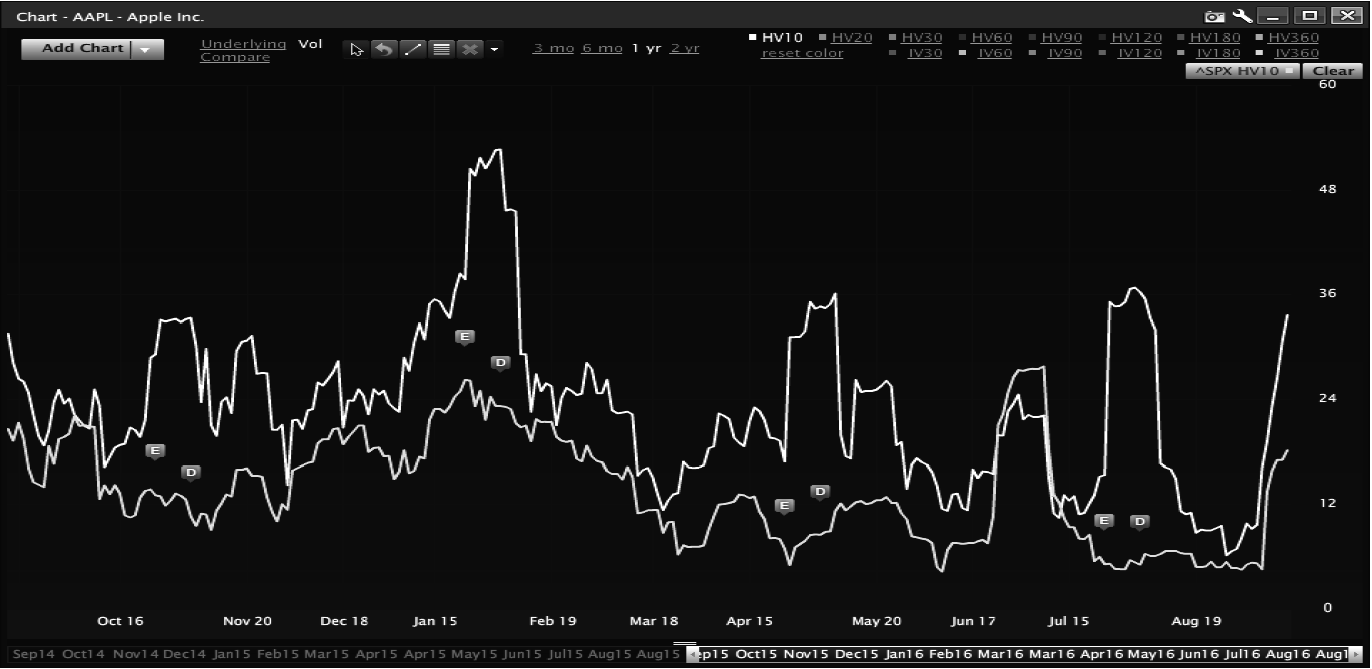
As one can see in Figure 5.1, 10 day HV (10HV) has its ranges; at its absolute extremes, it can get near 50 as it did in January 2016 (we’ll discuss why that was the case in a little bit). Looking at HV10, I would put zone 1 around 17% HV or lower. I would put anything above 35 in zone 4. Zones 2 and 3 are a little more difficult. You might eyeball zone 3 above 26 and zone 2 between 17 and 26 (zone 2 should normally be the biggest zone).
20 Day HV
In the 20 day HV graph in Figure 5.2, the same holds true, although the zones represent different levels in 20 day HV. This is less representative of near-term realized vol and more of how much the underlying moved on a relatively smooth basis. You can see the levels of 20 day HV are: zone 1 below 16, zone 2 from 16 to 23, zone 3 from 23 to 30 and zone 4 at 30 or higher.

60 Day HV
60 day HV will still having some similarities to the zones of the market and to the zones of the underlying. However, it should show down the trends. In this case, AAPL HV was trending lower but, since mid-August, it had ticked up significantly after bottoming out. Longer term HV is a great tool to help traders to recognize whether a pop in 10 day or 20 day HV is just a blip, or the real thing. In this case, it appeared the move was in fact a real thing. The zone of the 60 day HV in Figure 5.3, which should reflect the near term mean for 10 and 20, appeared to be about 26%. Therefore, if the 10 day HV was above 26%, that had to be zone 3 or 4, and below that was probably zone 1 and 2.
Review the IV of the Product
Unlike HV, which should have many iterations that traders look at, IV has fewer durations to study but with more dimensions. Durations are the days to expiration of the contract from which IV can be derived, typically one month, two months, or three months. Dimensions are all of the different variants of IV in a contract month, different strikes along different contract months, or how puts and calls trade in the different durations relative to ATM IV or how far OTM options trade relative to nearer the money OTM options. Additionally, dimensions represent the relationships of one expiration duration to another. IVs are in many ways four dimensional, ATM, above the money, below the money, far out of the money on both ends, and with different expiration months.
Traders reading this book, for the most part, really only need to pay attention to one duration, maybe two. However, they also need to know what skew and term structure look like (thus, in many ways they look at lots of durations). Before worrying about skew and term structure, the first step is to figure out what is high and low 30 day IV (IV30). From 30 day IV, every other piece of volatility is derived. It’s the duration that is most active, it’s the place that every trader looks to evaluate premium, and it is the duration that is most fairly priced. In viewing IV30 and getting an accurate representation of where implied volatility with a duration of 30 days to expiration is, you can formulate any trade and have a reasonable chance at creating edge. IV30 is so important that you could skip skew and term structure and still create trades with edge. (By the way, don’t skip skew and term structure. Just because you can, doesn’t mean you should; there is far more edge to be found by examining all three).
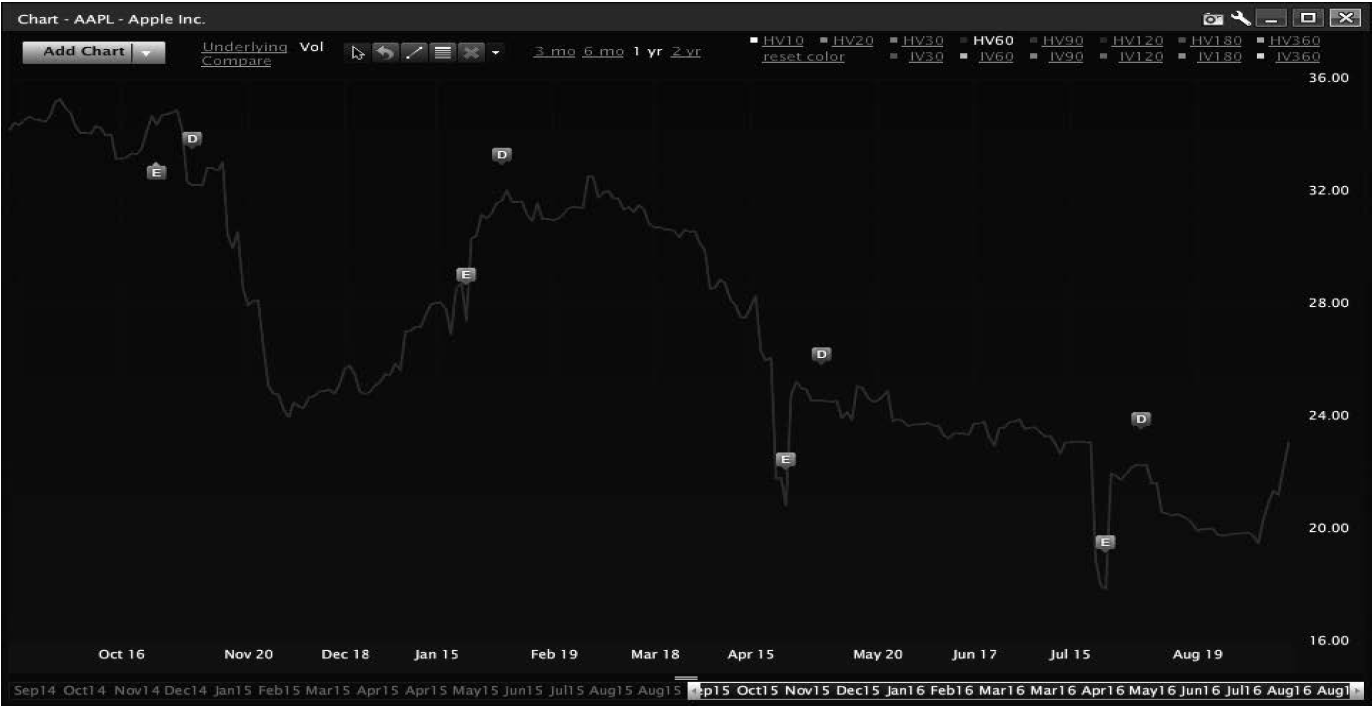
IV30
We are going to use Livevol for AAPL data in our 30 day IV examples; however, many other brokerage platforms also put out IVs. In addition, for those that want to use an extremely discounted broker, the CBOE puts out a host of indexes based on VIX that give an accurate view of 30 day IV. For instance, while we are going to use Livevol’s IV30 for AAPL, CBOE publishes VXAPL which is the VIX of AAPL options with 30 days to expire. Let’s take a look at two years of 30 day IV for AAPL is shown in Figure 5.4.
While you can see that there are highs and lows, 30 day IV seems to have a level it centers around, even more than HV10, 20, and 60. In this case, I would put it between 23 and 26 based on the IV levels to which AAPL tends to gravitate. Outside of that, you can see stress levels and extremes. Reviewing these extremes and knowing when earnings are coming, you can set up many trades. Thus, in reviewing the above, at the time we were evaluating, you can see that 30 day IV was coming off a two-year low, but rising. The next move in the IV appears to be higher, not lower. From here, you can set up a trade somewhat easily without looking at any other pieces of vol. However, you would be trading on only a partial story.
Term Structure
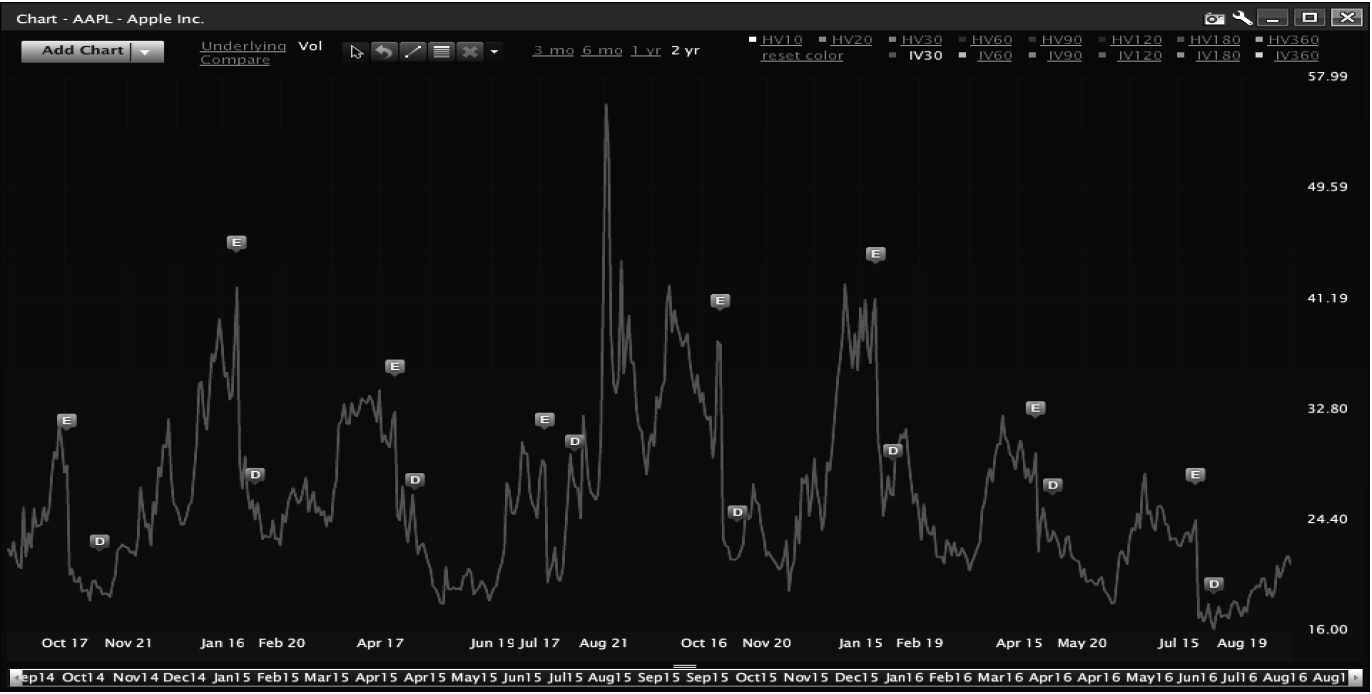
In reviewing the above, you might think, “I want to buy options.” You can do many trades; but without looking at term structure, how the contract months are priced against one another, you can’t develop the best way of knowing what to buy and, if so inclined, what to sell. Let’s take a quick look at AAPL term structure from Livevol. The below represents the aggregate vol in each contract for AAPL. In short, if you were to run an aggregate vol in the month of October, the vol would be 21.35%. If you were to run the same aggregate in November the IV for AAPL options in that month would be 25.33%.
Looking at the above, you can see that if you were looking to buy options in the near term, the October 14 or regular October contract might make sense because relative to the rest of the contracts, they are low-priced. Additionally, aggregate IV for October 14 and 21 were lower than the months in front and the months behind those contracts. If you want to own a longer-term contract, you might look at January 2017, since IV was cheaper in January than it was in December and November. Alternatively, if you are looking to sell options without explosive gamma against a long, you could sell the September 30 or the October 7 contract for a nearer-term trade. Longer term against a January trade, you could sell November or December because they were more expensive. The point is that while you might want to own premium, without looking at the term structure you can’t pick the best spots to trade.
Skew
Skew is the relative price of OTM puts and OTM calls when compared to ATM implied volatility. Typically, in equities, calls will have lower IV than ATM options and puts will have higher IV. However, the IVs of puts and calls relative to ATM options moves constantly. Thus, skew as a whole can become expensive or cheap. There are times where puts, regardless of strike, are expensive and at other times calls can be as well. Calls and puts tend to move freely from each other as the option flow (customer orders) tend to be unrelated to each other. By having an idea of how expensive puts and calls should be, and where skew normally trades, you can figure out trades that make sense. This is especially true in the indexes where there is less put selling on a relative basis.

When skew is steep as in Figure 5.6, trades may be extremely favorable, and when skew is flat, trades may also be favorable. However, trades that work in one condition tend not to work in the other. When skew is normalized and you don’t see an overall advantage to being long or short one side of the curve (skew as a whole is not out of ‘whack’), skew can help in strike selection because it will help the trader see which strikes may be mispriced even if the curve is mostly normal. Strikes can be out of whack even if the curve as a whole is not.
If you aren’t trading skew, you can still use it to your advantage, especially in equities, as one strike can get overbought or oversold. By looking at the curve, you may be able to pinpoint opportunity between strikes. Strikes as close as one price increment might offer an advantage over another. You can figure this out by looking at the curve within one month. This is especially true in equities where one customer can push things around. If customers want to own a call or put, they can move volatility by insisting on buying that strike; the other strikes around that option will not move nearly as quickly and may produce an opportunity. This is, as we explained in Chapter 3, because the nature of market makers is to not want a position. Because they are trying to adjust for customer order flow, if a large customer continuously buys or sells a strike or contract month, that customer’s order flow will move volatility. This action we used to call ‘pushing vol around’ when on the floor. Even in some of the most liquid equities this can be true. Figure 5.7 presents a snapshot of AAPL Skew.
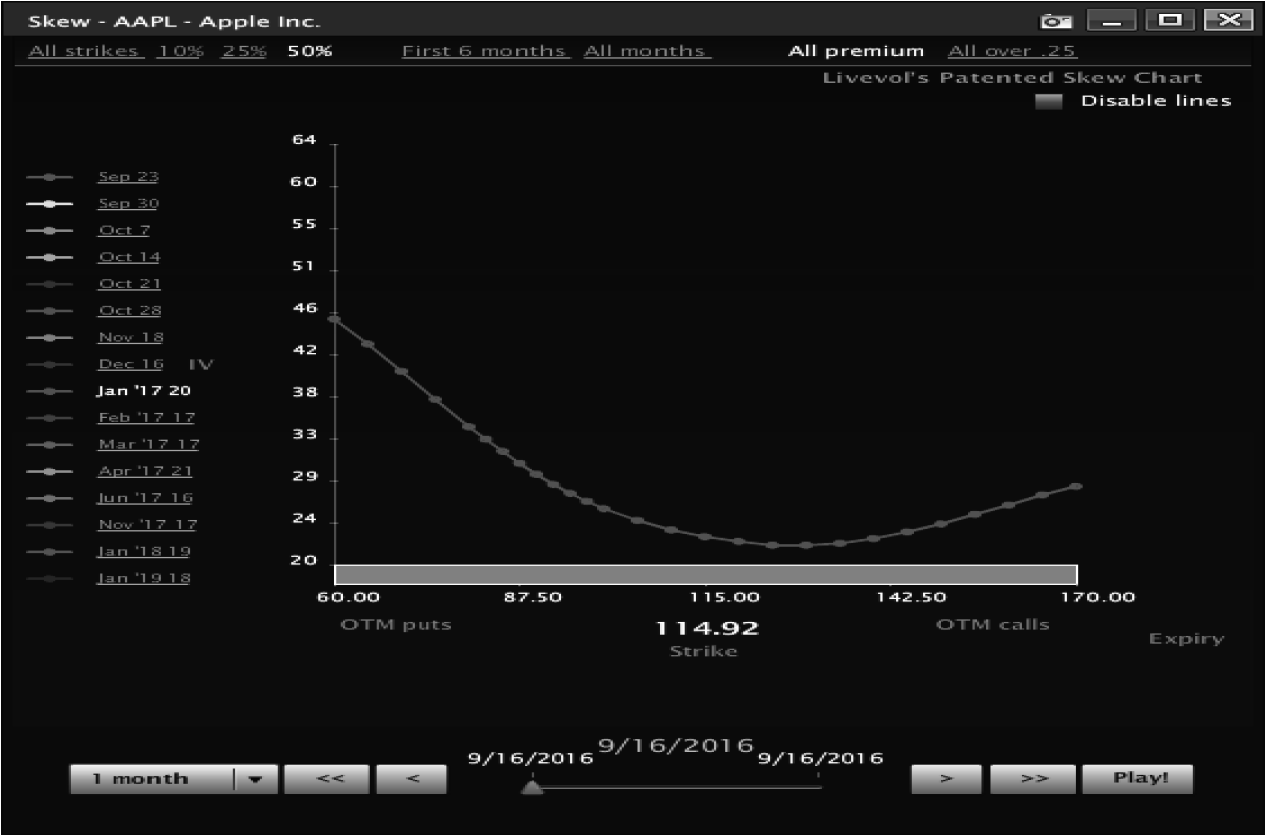
Within equities, skew can get out of whack, but it is subtle at times. It almost always develops if customers are buying or selling strikes. Take a look at the skew chart in Figure 5.7. The 105 strike in Figure 5.7 ever so slightly appears to be overpriced relative to the 100s and 110s. On the bullish side, the 125s are the cheapest option on the board. Considering that these are options with 3 months to expire, you could formulate a trade using these options as a base. Alternatively, if you want to sell an option, those two are not the strikes to select. Something as simple as avoiding a bad sale or making a good buy can make a huge difference in the result of a trade.
Know the Zone of the Market
As we discussed in the previous chapter, the market as a whole has zones; this applies to any product. Whether you are looking at cornmeal, mash, or oil options, you still need to know what the root vol looks like in the product. This is because there is always a dog and always a tail when it comes to volatility. If you want to dig down a rabbit hole, you could say, “This market affects the next market, and the next market affects another,” and so on. However, I can tell you, professionals are aware of what is going on around them, but until something bleeds into what they are trading, they only look at the main dog of the product. For the average traders this makes sense as well. Until volatility ‘bleeds’ into the market they are trading, it makes little sense to get overly concerned about inter-market volatility. This doesn’t mean ignoring macro events; it means not allowing IV decisions to be affected until the volatility actually starts to move.
When trading equities, there is really only one dog, the S&P 500; you might argue in some small companies it’s the Russell 2000 or the NDX in the case of some technology stocks. However, in the end, all stocks are driven by movement in the S&P 500. If you know the zone of the VIX, you know the zone of the SPX. For equities, if you know the zone of the SPX, you know the zone of the market. Every volatility in every ETF and stock has volatility correlated to the S&P 500 save a few commodity ETFs and possibly the most defensive stocks. In the most extreme times, even uncorrelated ETFs and defensive stocks will have volatilities that start to correlate with the VIX. Take a look at Figure 5.8, where the vols of a few unrelated ETFs move with vol of SPY.
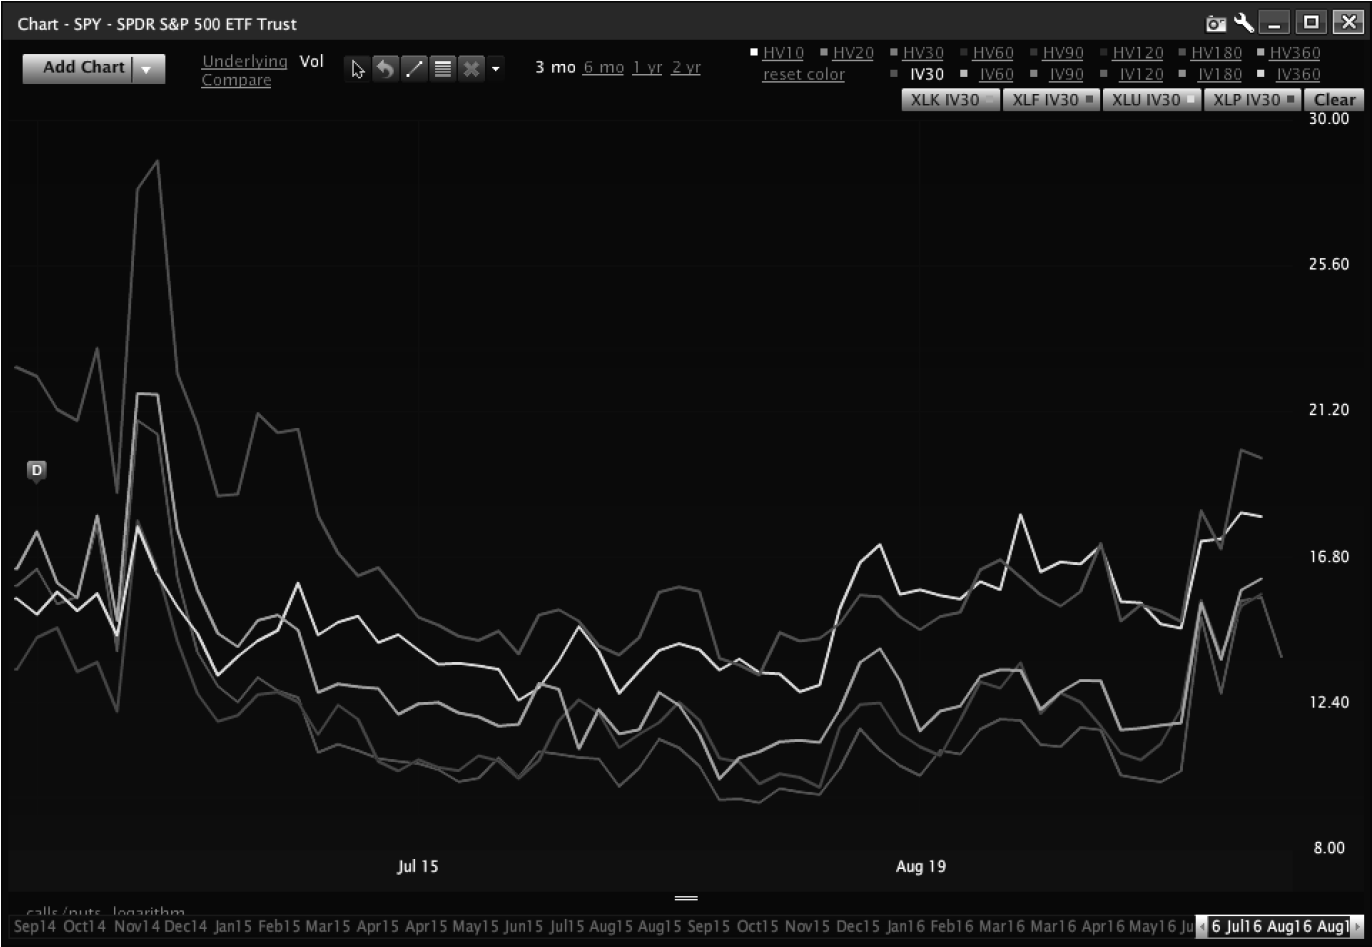
In Figure 5.8, you can see that while the volatilities don’t move in lock step with SPY, you should easily be able to see that if the above indexes are not tied, they are clearly connected with the individual ETFs being higher than SPY, but moving with the index nonetheless. The point is that the zone of an ETF or stock as a relative level is determined by the overall market. In short, you cannot determine the zone of IV of an equity or ETF without first knowing the IV of SPY.
Looking at individual equities, going back to our charts of AAPL HV, Figure 5.9 shows that when the market was in zone 3, as it was in January of 2016, AAPL hit its zone 4. The same holds true for June of 2016.
The same holds true for every other HV chart.
Select the Trade
Now that the trader has established the zone of the market and has a strong understanding of the direction of HV—is it going up, down, or sideways—you can make a decision on stock movement. Now that you have looked at IV level and the IV of the overall market, you can determine what option trade fits the current expected realized vol. You can figure out whether trade conditions exist because of the equity market as a whole, or because there is an edge with the specific trade. It is important to never get lost in a stock or ETF. The market drives everything in crisis. It’s the rest of the time that edge can be found. Skills in evaluating realized vol, implied vol facets, and the overall market will enhance your trading skills. Without that skill, traders are unlikely to succeed. In the next chapter, we will begin to put the rubber to the road in showing you how to evaluate when to enter many trades that can be profitable . . . given the right circumstances.