Chapter 7
A Quick Review of Spreads
Throughout this book, I discuss how to evaluate different trades in the market given specific market conditions. While this book assumes that the reader has knowledge of most spreads, I think it is worth the time to describe each type of complex spread. In this chapter, I’ll briefly discuss what makes each spread, what makes each spread make money, and the goals of the trade at onset.
The Call Spread
A call spread is very similar to a long call. The construction of the long call spread is pretty simple, but offers two possibilities. A call spread can be done for a debit or a credit. The debit version involves buying a call close to the underlying price, usually at or slightly out of the money, although it can be executed in the money as well. We will walk through the most common version which is a debit spread with a long call slightly out of the money.
In executing the call debit spread, the trader is looking for movement, but is more interested in actual movement than the market thinking movement might increase in the future. Thus, it is more of a ‘gamma-centric’ trade than ‘vega-centric’ trade. The construction involves buying a call slightly OTM and then selling a call that is further OTM. In the example below, the SPX was trading 2355; the trader opened an April 2375–2400 call spread, buying the 2375 calls for 6.50 and selling the 2400 calls for 1.35. Figure 7.1 shows a P&L chart.
Notice the trade is heavy on delta and gamma, and relatively light on vega for an index trading at 2350. The advantage of the trade is that cost is limited and profit potential is big. As these spreads go further out in time, the trader gives up some cost; the spread is more expensive in exchange for more time. The trader hopes that the underlying will rally, in which case the trader makes money. The goal of the trade is for the underlying to do something, in this case, to move higher.
The credit spread is just the opposite. The trader sells a call out of the money and buys a call further out of the money. Like the debit spread, this can be done at and in the money. In the case of a trade above, a trader does the opposite of the debit spread.


In this case, the trader believes the underlying will not rally above 2375. If it does, the trader loses; if it does not rally, the trader keeps the value of the spread, in this case a touch over 5.00. The goal of this spread is for the underlying to not rally and/or rally slowly settling below 2375. Both of these spreads can be great, but they need to be formed on an opinion—will the underlying move or will it not move?
The Put Spread
A put spread long or short (debit or credit) has the same goals as a call spread— just in the opposite direction. The debit holder hopes the underlying will drop. In comparing the two, you want to see a rally in the case of a debit spread, while with a credit spread you hope the underlying will rally.
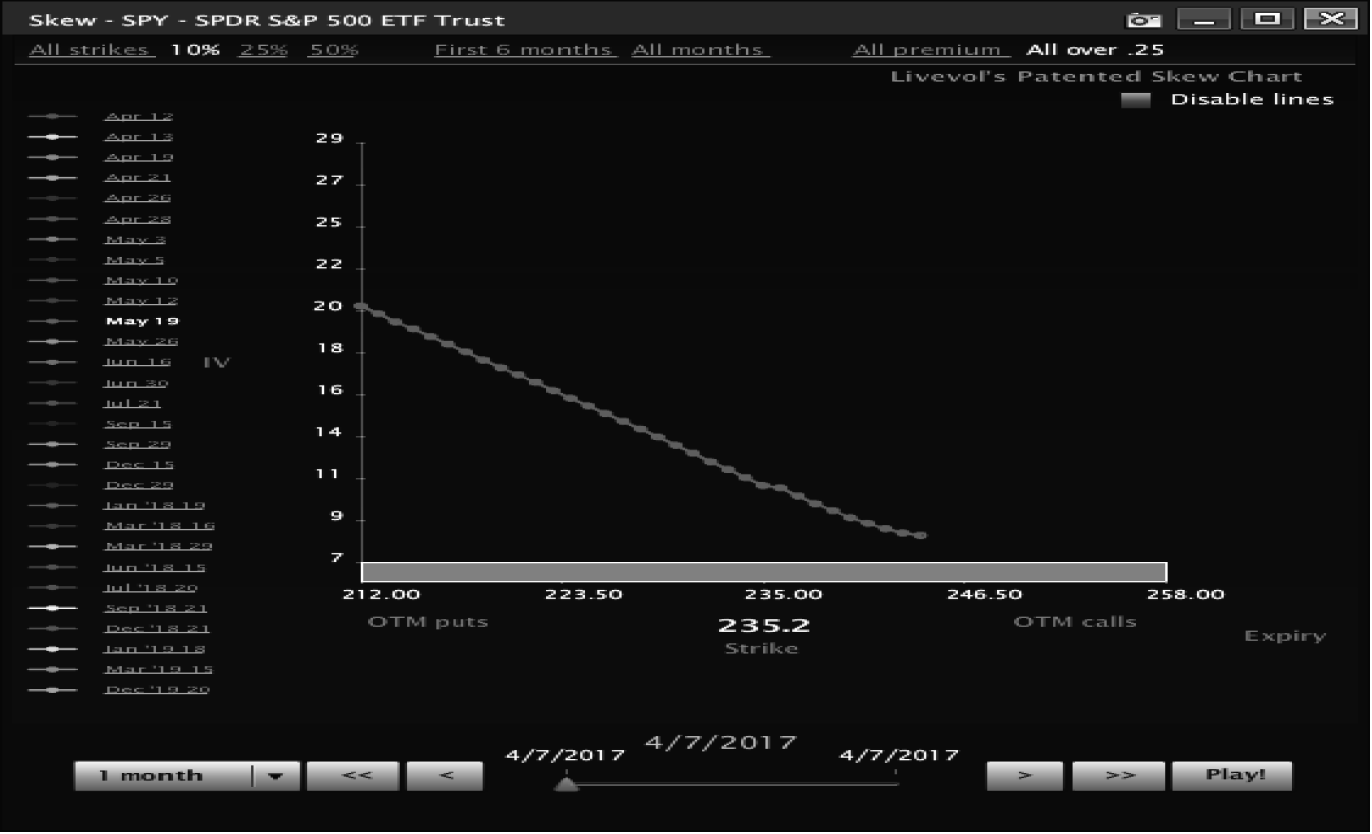
A long put spread tends to be short delta and long vega. However, like the long call spread, it seeks movement more than it wants a pop in volatility. This is especially true because of volatility. Recall that most stocks have an ‘investment skew’ meaning downside puts are more expensive than near the money puts in terms of volatility.
Notice, in Figure 7.3, puts get progressively more expensive in volatility terms. Let’s price out a put credit versus put debit spread to see that pricing makes owning a debit spread more favorable.
In this case, we are going to look at a May put spread with five weeks to expiration. In Figure 7.4, the May 2300 puts cost about 27.50, meanwhile the May 2200 puts are further out of the money and still cost more than $10. That is a huge difference in how the calls from our call discussion priced when we looked at them at a similar distance from the money. It also changes the risk-reward of a long and short put spread.
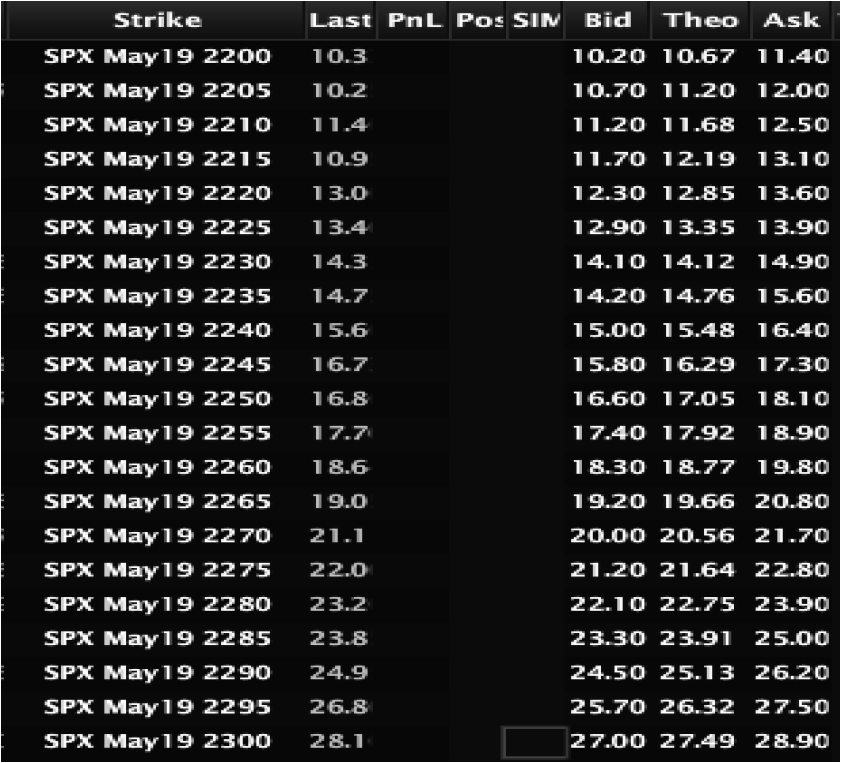
I can buy or sell a put spread for about $17.50 per spread. Thus, if I buy it, I am risking $17.50 to make about $83 on the spread (Figure 7.5).
Notice that if the trader is right, this spread pays out big. However, if the trader is wrong, the $17 he or she spent goes “poof” and decays away. In owning the put debit spread the trader is looking for something to happen, just like in owning a call spread.
Looking at the put credit spread (Figure 7.6), if I sell it, I am risking $83 to make $17.
The trader is betting a lot to make only a little; however, because markets tend to grind higher there are a lot of traders that like to sell put credit spreads. Traders like to bet that the market won’t go down. The trader is looking, like a credit call spread, for something not to happen.
In credit versus debit spreads, it is easy to bet that nothing will happen, but the market will charge you for it if you are wrong, to the tune of over 4 to 1 most of the time. It is priced that way because generally 4 out of 10 times, nothing happens.
Credit and debit spreads are often the first spreads traders execute but they are far more complex when you sit down and think about it. Take the time to understand what makes these work and not work and you will be much better off. To wrap up credit and debit spreads:
–A debit spread has a preference in direction of the underlying, thus it has a delta. The spread wants something to happen, thus it is long gamma. If nothing happens, the spread will lose money as time passes, thus it is short theta. The spread is buying premium; thus it wants the belief that movement will increase, making it long vega.
–A credit spread has a preference in the direction of the underlying, thus it has a delta. The spread wants something to happen, thus it is short gamma. If nothing happens, the spread will make money as time passes, thus it is long theta. The spread is selling premium; thus it wants the belief that movement will increase, making it short vega.
The Straddle
A straddle is the buying or selling of both a call and a put on the same strike. The straddle is based on whether something will or will not happen. If you go long on a straddle, you are betting that the underlying is going to move. If you sell a straddle, you are betting that the underlying won’t move.
You could describe a straddle as the perfect combo of a vega trade and a gamma trade. You want the market to think the underlying is going to start moving or stop (vega exposure) and you want the underlying to either stop or start moving (gamma exposure). Let’s walk through how long and short straddles make money.
The long straddle is the purchase of a call and a put on the same strike. Looking at the P&L graph in Figure 7.7, you hope the underlying will rally. But the P&L of the position shows a 10% increase in volatility.

If the SPX sits, and vol goes up, you do well. If the underlying moves 2%, you do well. If the underlying moves and implied volatility increases, you hit it out of the park. If the underlying moves, even if the IV drops, you win. Gamma is a powerful force in straddles, but vega will augment the trade almost as much as the movement. In the end, you need something to happen though, either a change in perception or a change in underlying price. Wrapping up a long straddle the basic structure is:
–The spread does not have a preference in direction of the underlying, thus it is flat delta. The spread needs something to happen, thus it is long gamma. If nothing happens, the spread will lose money as time passes, thus it is short theta. The spread is buying premium; thus it wants belief that movement will increase, making it long vega.
Short Straddle
The short straddle is the opposite of the long straddle. It wants the underlying to not move and it wants perception of movement to decline. Thus, the trade is both short movement and short perception of movement. This produces a spread that is short gamma and short vega. The P&L of the short straddle in Figure 7.8 shows the preferences quite clearly.

The straddle loses money if the underlying moves 10%, but it loses far less if IV drops, meaning that if the underlying moves and perception of movement drops, you will be okay over time, but will lose immediately. As a straddle seller, more so than any other type of trader, you look for something not to happen. You want the underlying to stick either in the immediate or over time. There is an advantage for you as a straddle seller, if you have the stomach for it, if the underlying gyrates (up-and-down or down-and-up) you are in a position to do extremely well. Based on the risk associated with the straddle, I almost never sell straddles naked. Generally, I trade iron butterflies instead (I will discuss Iron Fly’s later in this chapter). Wrapping up a short straddle the basic structure is:
–Short A call and a put on the same strike as in Figure 7.8
–The spread at onset does not have a preference in direction of the underlying, thus it is flat delta. The spread wants nothing to happen, thus it is short gamma. If nothing happens, the spread will make money as time passes, thus it is long theta. The spread is selling premium; thus it wants belief that movement will decrease, making it short vega.
The Strangle
A strangle, long or short, is a straddle with split strikes. The strangle takes in less premium; in return, you get a wider landing pad for the underlying to move about. Like a straddle, a strangle is vega- and gamma-centric. The strangle wants perception of movement to change and movement to change. The long strangle looks for movement and perception of movement to increase. In the example in Figure 7.9, you buy the May 2250 put and 2375 call at the same time.

You look for movement or an increase in belief that there will be movement. You want something to happen. Wrapping up a long strangle the basic structure is:
–The spread does not have a preference in direction of the underlying, thus it is flat delta. The spread needs something to happen, thus it is long gamma. If nothing happens, the spread will lose money as time passes, thus it is short theta. The spread is buying premium; thus it wants belief that movement will increase, making it long vega.
Looking at a short straddle Figure 7.10, you are trading off a lot of risk for your belief that the underlying isn’t going to move. If the underlying moves, you will lose, if the perception is that the underlying is going to move, you will lose. You are set up with a wider landing pad than a straddle, but you receive fewer dollars than a straight straddle. You receive fewer dollars (theta) relative to the straddle, but in return, the points where you lose money are much wider than a straddle.

You need the underlying not do something; in this case, move outside of the strikes you sold. Based on the P&L, you need the underlying to sit and the perception of movement to sit. Strangles are essentially straddles with more room whether bought or sold. Personally, I do not like buying or selling these. I think the risk-reward does not work for the independent trader. I feel similarly about straddles, but will trade them from time to time, because they are a stronger play on a hard belief. Wrapping up a short strangle, the basic structure is:
–The spread at onset does not have a preference in direction of the underlying, thus it is flat delta. The spread wants nothing to happen, thus it is short gamma. If nothing happens the spread will make money as time passes, thus it is long theta. The spread is selling premium; thus it wants belief that movement will decrease, making it short vega.
The Iron Butterfly
An iron butterfly is simply a straddle that is hedged. You sell or buy a straddle, generally ATM (although butterflies can and often are used as directional plays). Against the straddle, you buy or sell the opposite spread in the form of a strangle. Thus, if you sell a straddle, you buy a wider strangle. If you buy the straddle, you sell the strangle against it. This lowers the premium collected or paid; in return, it lowers risks if you sell the straddle and decreases gain if you buy. I am a huge proponent of these spreads, as they can be used strategically. The added benefit of these spreads is the margin they require, which is far less than straddles, especially short straddles.
The Short Iron Butterfly
A short iron butterfly as stated above is a short strangle versus a long strangle. You look for the same result as a straddle seller, but with less cost. The longs have the effect of reducing the associated Greeks of a short straddle. Let’s suppose we want to set up an iron butterfly, here is the standard way to pick strikes setting up the trade:
Start by selling an ATM straddle. Next calculate the standard deviation of the straddle. This can be done by taking the strike, multiplying it by the implied volatility of the short straddle, and then multiplying it by the square root of days to expiration of the spread, divided by the days in a calendar year. Let’s look at an example starting with Figure 7.11.
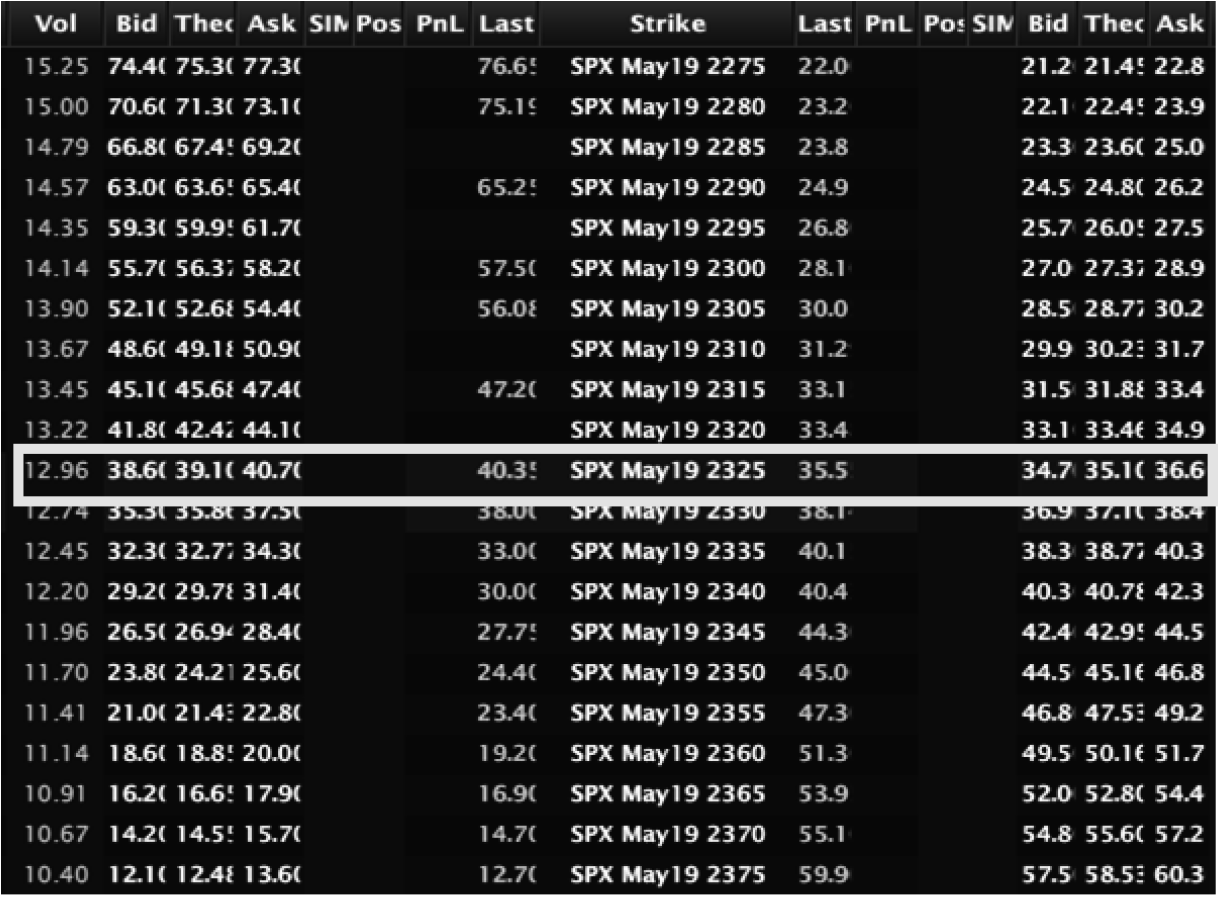
In this case, the trader would likely sell the 2325 straddle with a volatility of 12.96%; May, in this case, has 35 days to expiration. Thus, the trader would calculate the standard deviation in Excel:
2325*.1296*SQRT(35/365) or 93 points.
Obviously 93 points is a little off; 93 points will not land on a strike; thus the trader should lean in not out, making the wings 90 points wide instead of 95 points wide (wings are the long strikes on a butterfly or Iron Butterfly). Thus, the trader would set up a short iron butterfly as in the 2235–2325–2415 butterfly. However, one needs to make sure that the calls are not too cheap. If skew is steep, the calls might be inexpensive, so the trader might be buying what amounts to worthless calls as a hedge. Generally speaking, the wings should be worth at least 1–2% of the value of the underlying, generally at least 0.25 for equities and 2.50 for a major equity index. In the case above, you can see how upside calls are priced in Figure 7.12.

The 2415 calls were worth about 3.00, an acceptable level for the hedged calls. Thus, the butterfly would look like Figure 7.13.

What you will notice is that the spread is a touch odd looking. While the strike is all set up equally, the iron butterfly appears to have a preference that the underlying should fall. This is because the delta for OTM puts is greater than that of OTM calls; this is caused by skew in the SPX options. This raises a related question that invariably affects combination strategy: Do you close profitable legs or wait to expiration? In closing one leg, the risk of the remaining side could be increased substantially. So, you need to determine (preferably in advance) whether to hold the position through to expiration in the hopes of overall profit with managed risk, or close early. In the second choice, rather than closing, rolling to a later expiration often presents the best combination of risk management and profit. At onset, we generally believe that some of the delta should be managed, so I suggest buying calls to hedge. I like buying about half of the delta, using a call inside of the ‘tent’ (between the short and the long) in this case, you could buy three 2375 calls to smooth out delta exposure, as shown in Figure 7.14.

While the spread still has a delta, the gamma from the long calls reduces the true P&L effect of delta quickly because of the gamma in the calls.
With this spread on, the trader is clearly looking for one thing, the underlying to sit. If it moves, the trader will lose. Additionally, the trader is looking for the belief that the underlying might sit for a while. If the trader is right and the underlying sits as time passes, much like a short straddle, the trade is profitable. If the underlying moves, the trader will be sad. Wrapping up a short iron butterfly, the basic structure is:
–The spread does not have a preference in the direction of the underlying, thus it is flat delta once hedged. The spread wants nothing to happen, thus it is short gamma. If nothing happens the spread will make money as time passes, thus it is long theta. The spread is selling premium; thus it wants movement to decrease, making it short vega.
The Long Iron Butterfly
A long iron butterfly is developed in exactly the same way as a short iron butterfly, only on its head. The trader is buying a long straddle and using the same standard deviation formula to pick the strikes to sell. This spread has the exact opposite characteristics as well. See the example of the spread in Figure 7.15.

I do not suggest hedging off the delta of the spread, unlike in the short butterfly. This is because of the vega exposure of the spread. Because you are actually looking for movement, you need to take into account how vega will affect the value of the spread with movement. If the underlying rallies, almost certainly (except under extraordinary circumstances) IV will fall. If the underlying falls, the IV will almost certainly increase. This will change the payoff of the graph above by a wide margin, making delta the equalizer of P&L. This spread is delta neutral if you want movement to occur in either direction. You also need movement to occur quickly because the spread is purchased, thus every day that the underlying doesn’t move, the trade loses money. If perception of movement increases, you will believe that the options should cost more, and the spread will make money, benefiting the trade. Wrapping up a long iron butterfly the basic structure is:
–The spread does not have a preference in direction of the underlying, thus it is flat delta. The spread needs something to happen, thus it is long gamma. If nothing happens the spread will lose money as time passes, thus it is short theta. The spread buys premium, thus it wants movement to increase, making it long vega.
Standard Butterfly
A standard butterfly is the exact same spread as an iron butterfly. The only difference is that it is made up of a long call spread and a short call spread with the shorts at the same strike, or it’s a short and long put spread with the shorts at the same strike. The long call butterfly is shown in Figure 7.16; the long put butterfly is shown in Figure 7.17.
Notice that long call (Figure 7.16) and put (Figure 7.17) butterflies look almost exactly the same and share the same Greeks as the iron butterfly. This is because they are essentially the same spread.
While there are some slight differences in terms of having a call or put in the money, the spreads are synthetically (linked by put-call parity) the same spread. A long call or put butterfly ATM is going to look exactly the same as a short iron butterfly. The difference between an iron spread and the standard spread is pretty simple to calculate. Take the credit from the iron spread, subtract it from the distance between the shorts and longs and you will have the value of the call or put spread. For example, if the SPX iron butterfly that is 90 points wide and collects $57, the debit on a call or put butterfly should be 90–57 or $33 per spread.

I generally do not suggest standard ATM put butterflies, but I do like them better for directional spreads. This is primarily due to spread width of ATM versus ITM and OTM options. Here is a brief example. Take a look at the spread between the OTM calls and the ITM puts at the 2415 strike:

The OTM calls are about 0.95 wide (about 0.20–30 if quoted in the open market) while the 2415 puts are about 3.70 wide (about 0.50–70 wide if quoted in the open market). The ability to price more easily makes iron butterflies more desirable for ATM spreads in big indexes. It’s worth the time to price a call and put butterfly, just in case there is a mispricing somewhere, especially in individual equities, where mispricing is more prone to happen.
The Iron Condor
An iron condor is simply a strangle that is hedged. A trader sells or buys a strangle. Against the strangle, the trader buys or sells the opposite strangle even wider than the initial strangle against the initial trade. So, if the trader sells a strangle, he or she will buy a wider strangle. If the trader buys the strangle, he or she will sell a wider strangle against it. This will lower the premium collected or paid for the strangle; in return, it will lower risk for the strangle seller and decrease the gain for the strangle buyer.
The Short Iron Condor
A short iron condor, as stated above, is a short strangle versus a long strangle. There are variants on the iron condor where one has all puts or all calls, but we almost never trade those and they are hard to find (so we are not going to discuss them). The trader is essentially looking for the same result as a strangle seller, just with less risk. The longs have the effect of reducing the associated Greeks of a short strangle. Let’s suppose we want to set up an iron condor, the standard way to pick strikes consists of:
Start by figuring out what strangle to sell. For an iron condor, I typically look for wings well out of the money. I look about 60 days out and at the 10 delta mark. Next, I find options wider out that will provide the cheapest hedge in a relative sense. In ‘relative sense’ I mean what provides the best bang for the buck. Here are two theoretical scenarios:
I can sell the 10 delta call and put together and collect 2.50. Against it I can:
1.Buy a strangle 10 points wider for 1.50
or
2.Buy a strangle 20 points wider for 1.00
In scenario 1, I collect 1.00 (2.50–1.50), creating a margin of 900 per spread. I’m risking 900 to make 100. The payout on risks of 100/900 or 11.11% return occurs if I collect every last dollar (which I don’t).
In scenario 2, I collect 1.50 (2.50–1.00), more dollars relative to scenario 1; but what about the return on risk? The payout is now 150 against the potential loss of 1850 a spread. This is a payout of 150/1850 or 8.1%.
While scenario 2 makes more raw dollars in a risk-to-reward analysis, clearly scenario 1 is preferable.
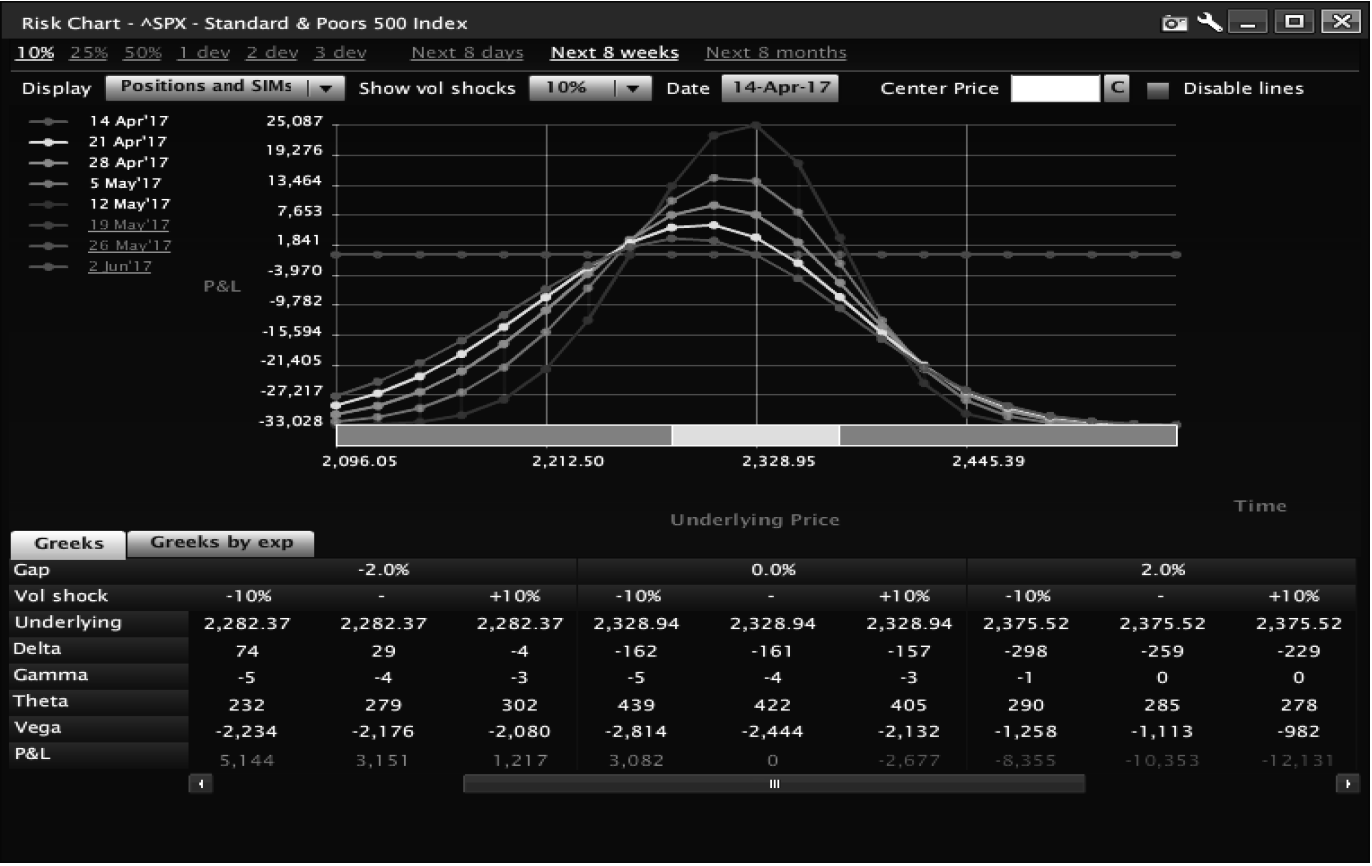
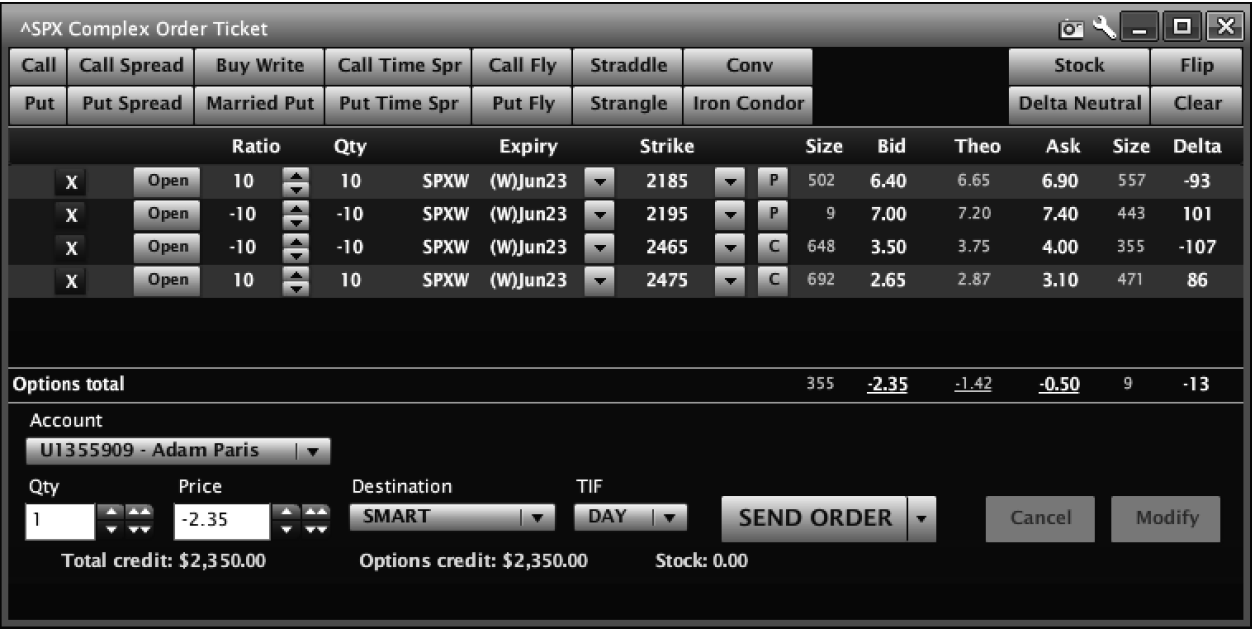
Moving on to time to expiration, in Jim Bittman’s book Trade Options Like a Professional (2008), he discusses how selling an option 10% out of the money produces more decay in raw dollars 60 days out of the money than selling a 10% out of the money at 30 days to expiration. The way most iron condors are traded, we like setting up iron condors at about 55–70 days to expiration since that range, along with a 10 delta option sale on the condor, tends to produce optimal decay. Figure 7.18 shows a chart of an iron condor set up to these specifications:
We end up short the 2195 puts against the 2185 puts, about 7.5% OTM on the puts. The calls were sold at 2465 versus 2475, only about 4% OTM.
While not 10% OTM on either strike, it is at a level where, by the time the spread is 30–40 days to expiration, the decay has come out of these spreads. Interestingly, while the spread pulls more dollars out of the calls, more of the money will be made by the puts dying than the call spread. This is because of the proximity of calls relative to puts.
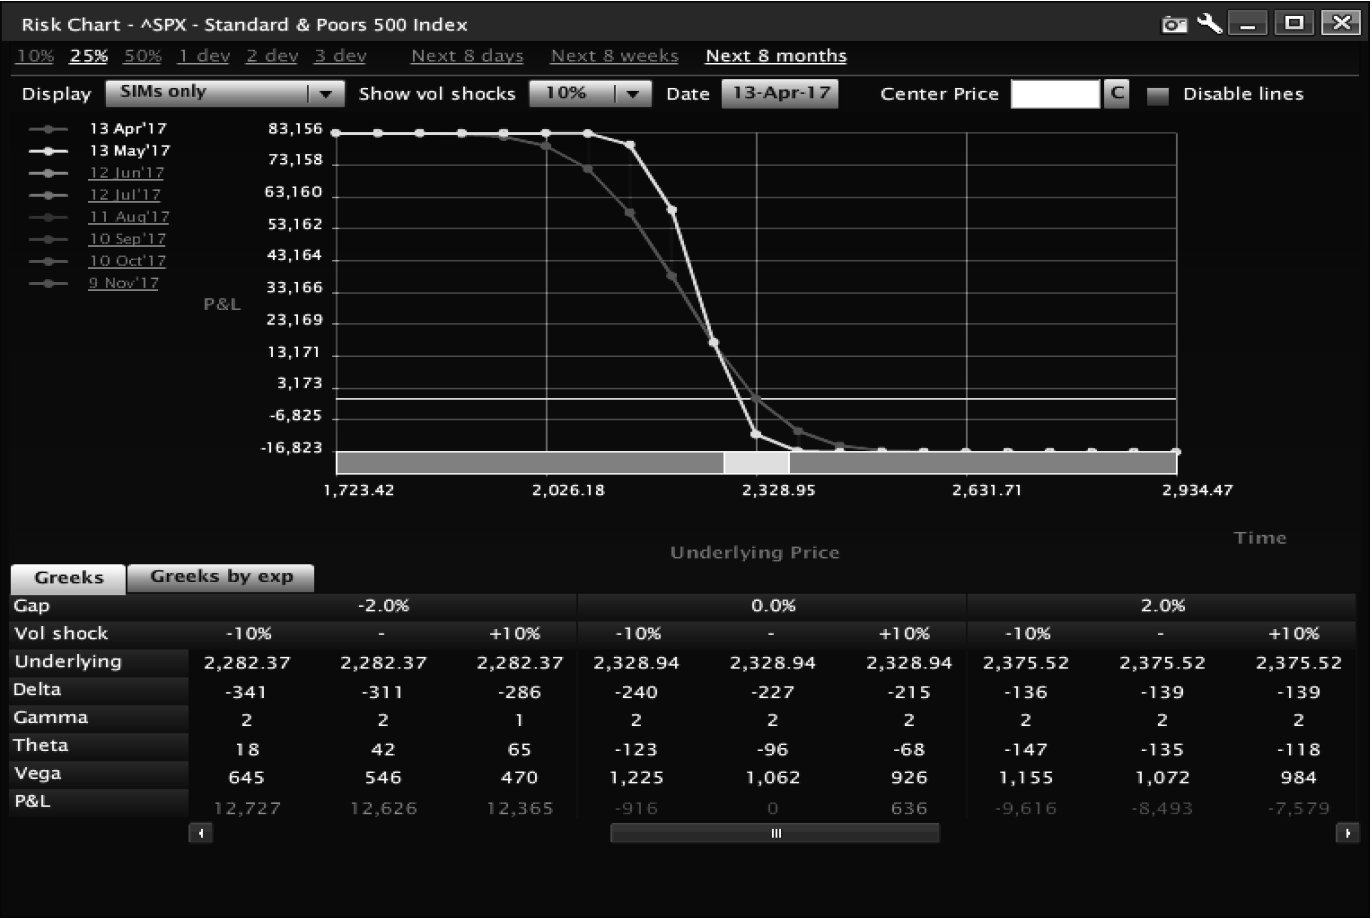
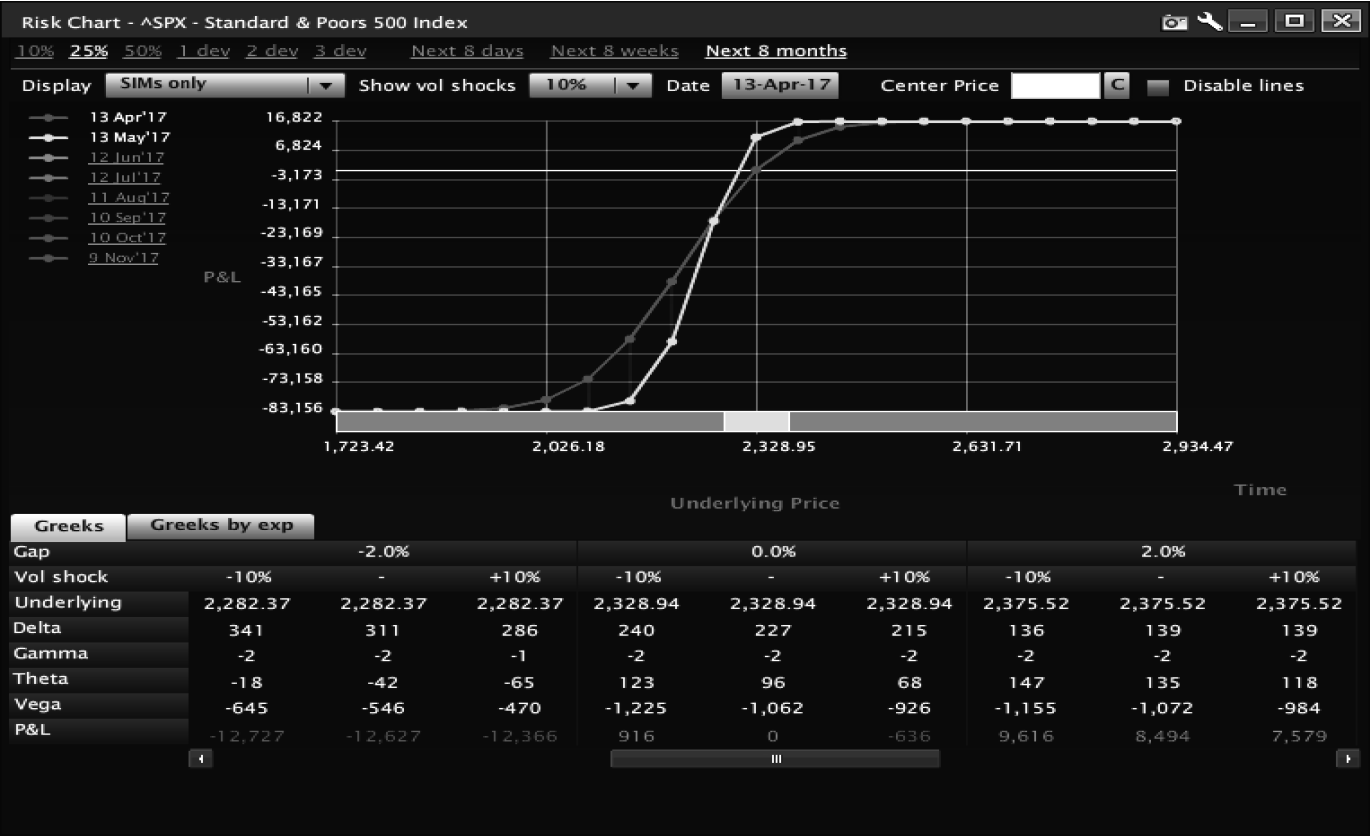
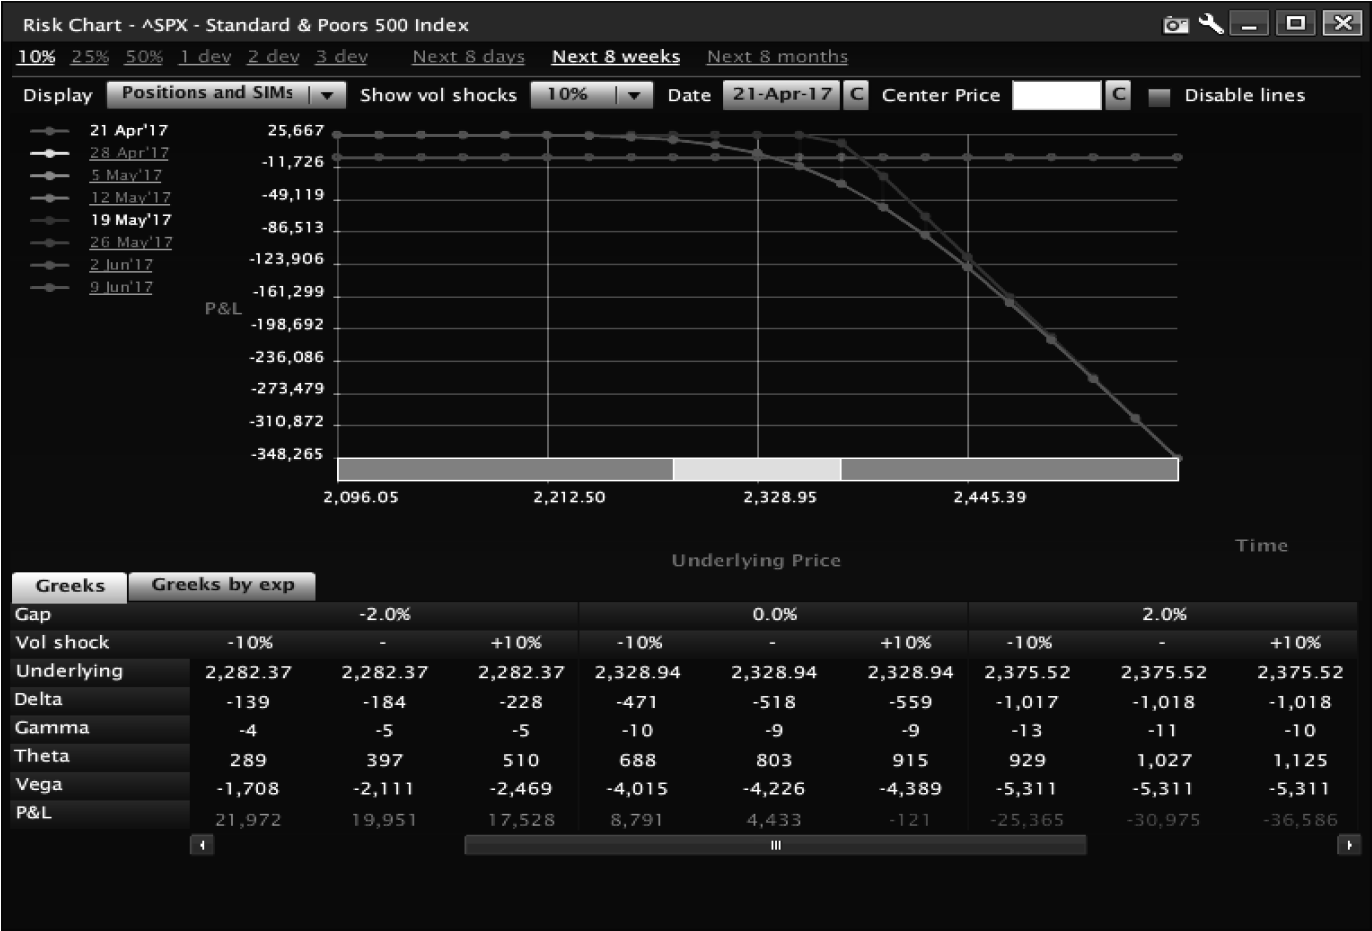
Risk in iron condors exists in the calls. While traders tend to obsess over downside risk in iron condors, upside risk loses more money than downside. The risk chart (Figure 7.19) makes this pretty clear:

Looking at risk, one can clearly see that upside options are closer and steeper. This is another reason we push traders to shoot for half the credit and to move on; the market tends to move higher creating problems in an upside condor.
We almost never trade these spreads because, as active traders, we believe we can find better values in other spreads. Those who want to trade these need to learn that these spreads are less of a sit-and-wait trade than they may seem, and are much more a play on vol dropping for a few days and collecting the vega. When we do execute these trades, we are almost never looking for more than 50% of the credit; typically, we are looking for about 30–40%, mostly derived from a drop in vol. The theta that occurs is additive. If you are in an iron condor for more than 15–20 days, you are set up to lose.
With this spread on, the trader is clearly looking for one thing, the underlying to sit. If it moves, the trader will lose. Additionally, the trader is looking for the belief that the underlying might sit for a while. If the trader is right and the underlying sits and time passes, much like a short straddle, the trade is profitable. If the underlying moves the trader will be sad (the trader loses). Wrapping up, for a short iron condor, the basic structure is:
–The spread does not have a preference in the direction of the underlying, thus it is flat delta, although it tends to have a small short delta. The spread wants nothing to happen, thus it is short gamma. If nothing happens, the spread will make money as time passes, thus it is long theta. The spread is selling premium; thus it wants movement to decrease, making it short vega.
The Calendar Spread
A calendar spread, also called a horizontal or time spread, is buying a contract in one month against selling of another contract in a different month and at the same strike (although they do not have to be). For the purposes of this description, we will assume they are on the same strike. Calendars represent a dichotomy. On one hand they want something to happen, on the other hand they do not. A long calendar spread expects the underlying to sit. The trader wants implied volatility to increase while the stock does not move at all. A short calendar spread wants just the opposite. In many ways calendars are like hedged straddles, different from the way butterflies hedge, but hedged straddles nonetheless. We will discuss how to make money on these spreads later on, but for now let’s walk through the build and how they look like straddles.
The Long Calendar
A long calendar is the selling of a near-term contract and the buying of a longterm contract to set up a net debit. This can be done over weeks, months, or even over years. Traders think the long contract is cheap relative to the nearer-term short contract. When put together, the similarity to a straddle is striking, see Figure 7.20.

The major difference is the exposure to perception in movement. The trader wants the trade to do nothing in the short term, but for long term expects movement to increase. This creates the long calendar’s payouts. The longer the length between contract months the more ‘perception of movement’ will matter to its success.
The value of the calendar relative to the straddle beyond the ‘perception of movement’ exposure is the limited risk. The most a calendar spread can lose is the cost of the spread. Thus, a calendar purchased for $20 net should not lose more than the $20 paid per spread. Wrapping up a long calendar spread, the basic structure is:
–The spread does not have a preference in direction of the underlying, thus it is flat delta. The spread wants the underlying to sit, thus it is short gamma. If nothing happens, the spread will make money as time passes, thus it is long theta. The spread is buying premium; thus it wants movement to increase, making it long vega.
Short Calendar
If a long calendar is similar to a short straddle then a short calendar is going to look an awful lot like a long straddle. The short calendar is a sell of a near term option against a buy of a longer term option. It produces a spread that wants the underlying to move now, and perception of movement to fall. The trader believes that near-term options are too cheap and long-term options are too expensive. When put together, it looks a lot like a long straddle (see Figure 7.21).

If the underlying moves, the trader makes money, just like a long straddle. The big difference is what the short contract represents. If perception of movement drops, the spread will make money, so it is short vega (exposure to the perception that movement will change). If the underlying moves and the perception of movement drops, the trader will do extremely well. Short calendars are great on rallies and less than great on sell-offs. I like the spreads; however, the downside of the short calendar is that despite the limited risk, they are generally margined worse than long straddles. Many firms view the short strike as naked despite the fact that it’s hedged by near term options.
The one issue with these spreads is if the trader is wrong on perception of movement. If the back month begins to see an increase in movement perception, the P&L of the short calendar can change quickly, creating problems for the trader. A big increase in the long-term option can cause losses to be greater than the initial P&L predicts, and can be so large that the longer-term option can possibly see its value increase.
Wrapping up a short calendar spread the structure is:
–The spread does not have a preference in direction of the underlying, thus it is flat delta. The spread wants the underlying to move, thus it is long gamma. If nothing happens the spread will lose money as time passes, thus it is short theta. The spread is selling premium; thus it wants belief that movement will decrease, making it short vega.
Front and Back Spreads
Front and back spreads involve the trading of one option near the money against the trading of several options out of the money. Depending on the spreads, they want either a long movement (back spread) or almost no movement (front spread). These are considered professional trades as they tend to be margin intensive. We will dig into these in detail in later chapters, but I want to spend a few moments describing these trades.
Back Spreads
A back spread is the sale of a near-term option to finance the purchase of at least two options out of the money. The spread uses the near-the-money option to finance the further-out-of-the-money options in hopes of rapid movement from the underlying. These spreads generally do have a directional bias, but can be set up not to lose if the underlying moves in the opposite direction, so long as they are set up for a credit or for zero cost. These spreads, more than any other spread, require a change in perception with a change in movement. If the underlying moves in the direction of the spread, the trader will likely not make money, but if the underlying moves and perceptions change, the trade will do exceptionally well. These are usually set for periods when IV is perceived to be cheap. A classic example would be for the spread to be executed for even money. Let’s look at an example in SPX, in this case short 10 SPX 2350s versus long 20 SPX 2380 calls, as shown in Figure 7.22.

Notice that as time passes, the spread loses exposure to movement and the spread becomes less effective. Back spreads need movement and they prefer it quickly, preferably with an increase in perception of movement. They can be set up as either bullish or bearish. To do them at zero cost in equities and indexes, generally call back spreads will have strikes closer than put back spreads (caused by skew). Wrapping up a long back spread, the basic structure is:
–The spread does not have a preference in direction of the underlying, thus it is flat delta; but in the end, expects the underlying to move in the direction of the long strike. The spread needs something to happen, thus it is long gamma. If nothing happens, the spread will lose money as time passes, thus it is short theta. The spread is buying premium; thus it wants belief that movement will increase, making it long vega.
The Front Spread
A front spread is a flip of the back spread, and often is called the ‘pro’ trade because it is so popular among professional traders. The trader buys a near-the-money option and sells at least two out-of-the-money options. The spread is almost always set up as a credit. The goal of the trade is for the underlying to slowly creep toward the two short strikes, but not get there quickly. As time passes, the OTM options lose Greeks and the near-the-money options gain delta and gamma. What is odd about a front spread is that the trader wants movement, just extremely slow movement. If the underlying moves slowly toward the short strike, the trade will do extremely well. If the underlying moves too hard, the trade loses. Generally, these are done as a credit, so if they move in the opposite direction of the spread, they will make money for the trader. Essentially, the value of a front spread is that the trader can be right or wrong and still win, as long they aren’t too right. A call front spread is shown in Figure 7.23.
With the underlying trading 2325, the trader is long 10 of the 2350 calls and short 20 of the 2375s for a net credit. If the underlying creeps higher, the trader does well. If the underlying drops, the trader keeps the credit. The issue the trader will have is if the underlying rallies quickly, above 2375, the P&L starts to look ugly. Bear spreads tend to be wider because of skew, and bullish spreads will have to be tighter if done for a credit. Wrapping up a front spread, the basic structure is:
–The spread at onset does not have a preference in direction of the underlying, thus it is flat delta; but in the end, wants the underlying to slowly move in the direction of the short strikes. The spread needs movement to be slow, thus it is short gamma. If nothing happens, the spread will make money as time passes, thus it is long theta. The spread is selling premium; thus it wants belief that movement will drop, making it short vega.