INTRODUCTION
“Sight is swift, comprehensive, simultaneously analytic, and synthetic. It requires so little energy to function, as it does, at the speed of light, that it permits our minds to receive and hold an infinite number of items of information in a fraction of a second.”
CALEB GATTENGO, Towards a Visual Culture
WE HAVE NO CHOICE but to be drawn to images. Our brains are beautifully wired for the visual experience. For those with intact visual systems, vision is the dominant sense for acquiring perceptual information. We have over one million nerve fibers sending signals from the eye to the brain, and an estimated 20 billion neurons analyzing and integrating visual information at rapid speed.1 We have a surprisingly large capacity for picture memory, and can remember thousands of images with few errors.2
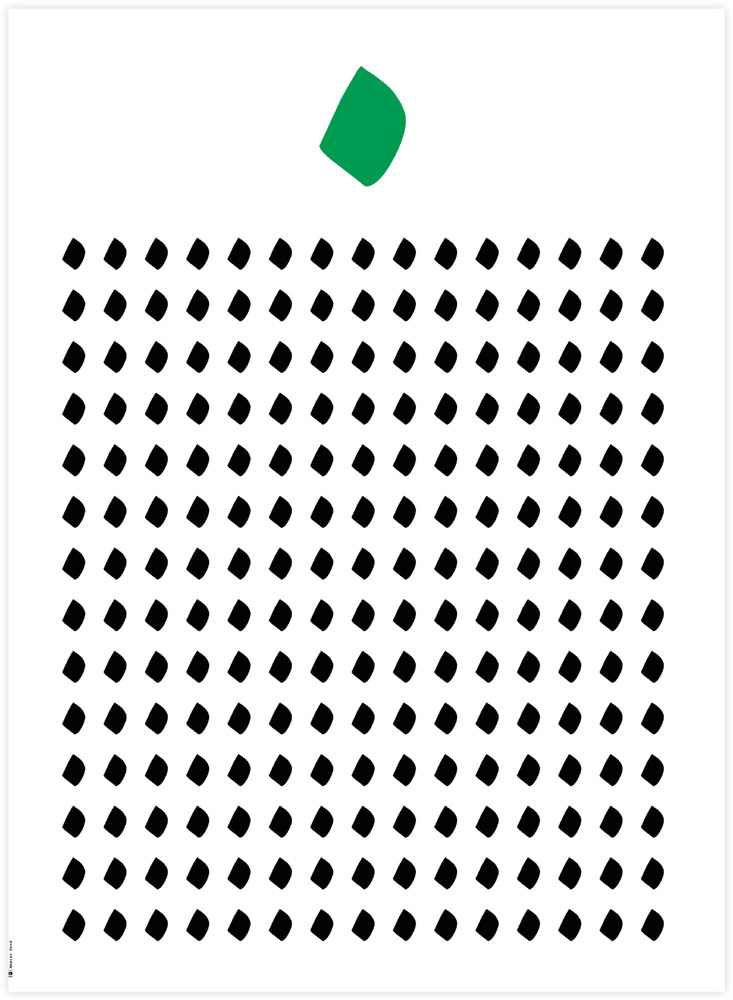
In the beginning was the dot.
Maziar Zand, M. Zand Studio, Iran
We are also compelled to understand images. Upon viewing a visual, we immediately ask, “What is it?” and “What does it mean?” Our minds need to make sense of the world, and we do so actively. To understand something is to scan and search our memory stores, to call forth associations and emotions, and to use what we already know to interpret and infer meaning on the unknown. As we derive pleasure, satisfaction, and competence from understanding, we seek to understand more.
Acquiring a sense of our innate mental and visual capacities can enable graphic designers and illustrators to express their message with accurate intent. For example, if one’s goal is to visually explain a process, then understanding how humans comprehend and learn helps the designer create a well-defined information graphic. If one’s purpose is to evoke a passionate response, then an understanding of how emotions are tied to memory enables the designer to create a poster that sizzles. If one’s purpose is to visualize data, then understanding the constraints of short-term memory enables the designer to create a graph or chart that is easily grasped.

Imagery enables us to apprehend concepts that are difficult to explain. By visualizing three layers of the human form as distinct bodies and using blurred doubles to express motion, the artist provides a glimpse of how each interconnected layer of the body performs while running.
Daniel Muller, United States
This book explores how the human brain processes visual information. It presents ways to leverage the strengths of our cognitive architecture and to compensate for its limitations. It proposes principles for creating graphics that are comprehensible, memorable, and informative. It examines the unique ways we can provide cognitive and emotional meaning through visual language. Most important, this book is meant to inspire new and creative ways of designing to inform.
We depend on visual language for its efficient and informative value. As the quantity of global information grows exponentially, communicating with visuals allows us to comprehend large quantities of data. We often find that technological and scientific information is so rich and complex, it can only be represented through imagery. Using an informative approach to visual language allows the audience to perceive concepts and relationships that they had not previously realized.
Our neurons seem to be plugged in to the digital stream, having adjusted to the continual barrage of visual information. With multiple windows, scrolling text, personal digital assistants, new media, digital imagery, video on demand, advertising banners, and pop-ups, we have come to appreciate the fact that visuals reduce the time it takes for a viewer to understand and respond to information. The sheer quantity of visual messages relayed through new technology has led some to call imagery “the new public language.”
Visual communication is fitting for a multilingual, global culture. Using basic design elements, it’s possible to bypass differences in symbol perception and language to convey our message through imagery. Gyorgy Kepes, influential designer and art educator, envisioned this in 1944, when he wrote, “Visual communication is universal and international; it knows no limits of tongue, vocabulary, or grammar, and it can be perceived by the illiterate as well as by the literate.”
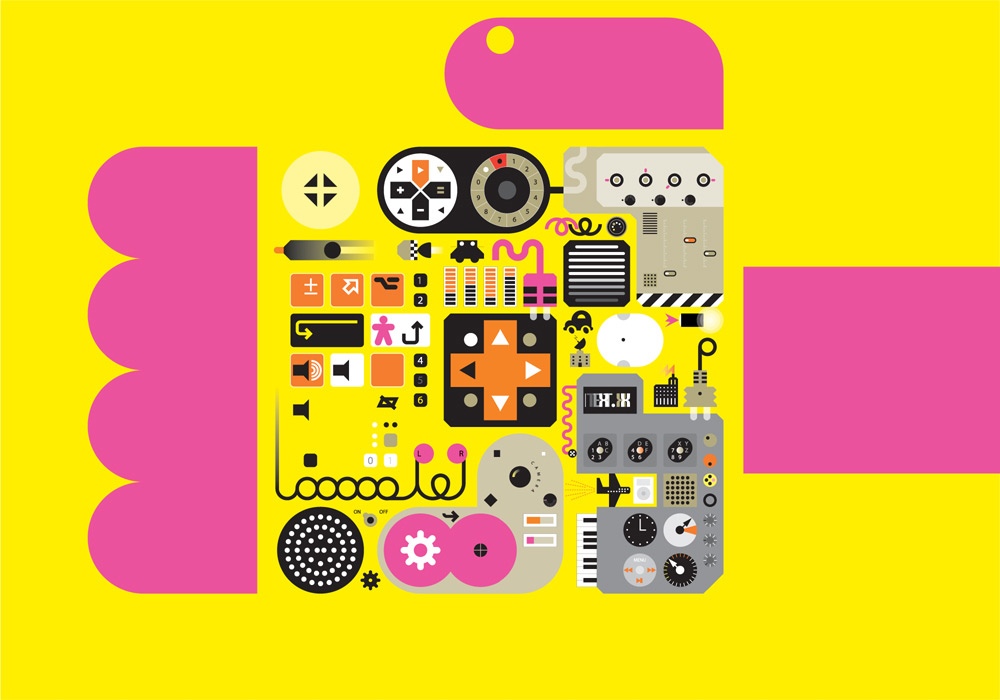
This graphic for Vodafone pairs the complex symbols of technology with the simplicity of iconic forms to effectively convey “technology at your fingertips.”
Peter Grundy, Grundini, United Kingdom
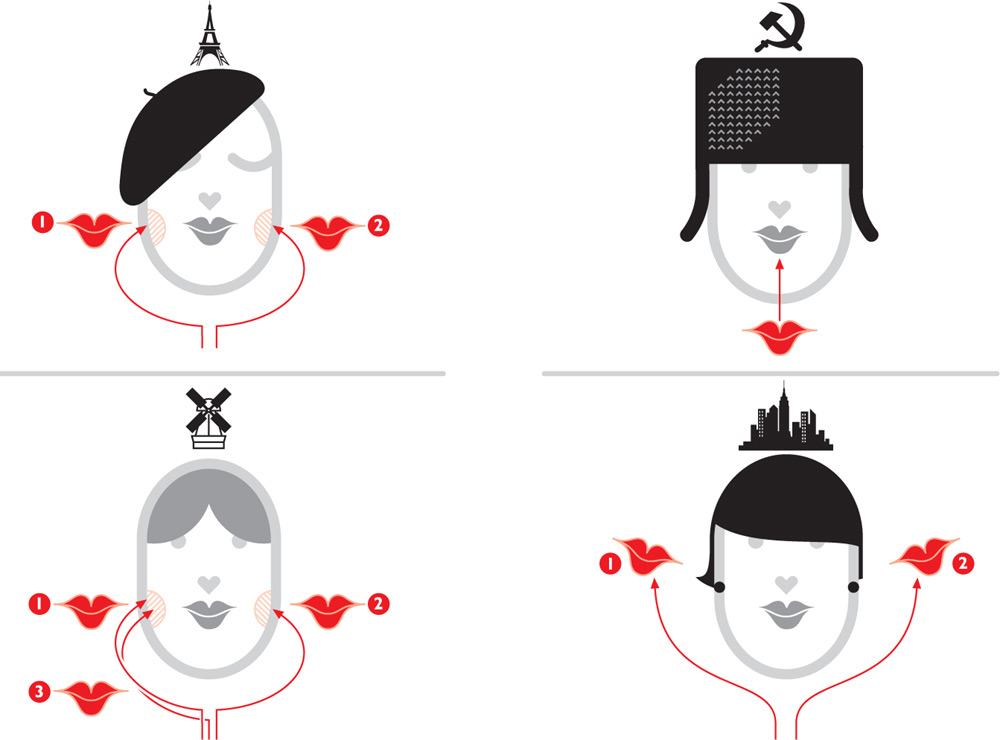
In this graphic depicting the greeting customs of four different cultures, the illustrator uses a minimum of graceful strokes and effective symbols to convey his message.
Nigel Holmes, United States
Communication through imagery has other advantages as well. To explain something hidden from view, such as the mechanics of a machine or the human body, a cross section of the object or a transparent human figure works well. When we need to describe an invisible process, such as how a mobile text message is transmitted, iconic forms interconnected with arrows can be used to represent a system and its events. To communicate a difficult or abstract concept, we may choose to depict it with a visual metaphor to make the idea concrete. Precise charts and tables help to structure information so audiences can easily absorb the facts. When we wish to instigate a call to action, we find that emotionally charged imagery is the most memorable. We see that a graphic with humor or novelty can capture our audience’s attention and provide motivation and interest. And when the task calls for an immediate response, we know that a graphic will provide quick comprehension. The power of visual communication is immeasurable.

Visual language enables us to depict processes and systems in their entirety so we can understand the big perspective. This diagram of a campus enterprise system details each component of the system while presenting the global view.
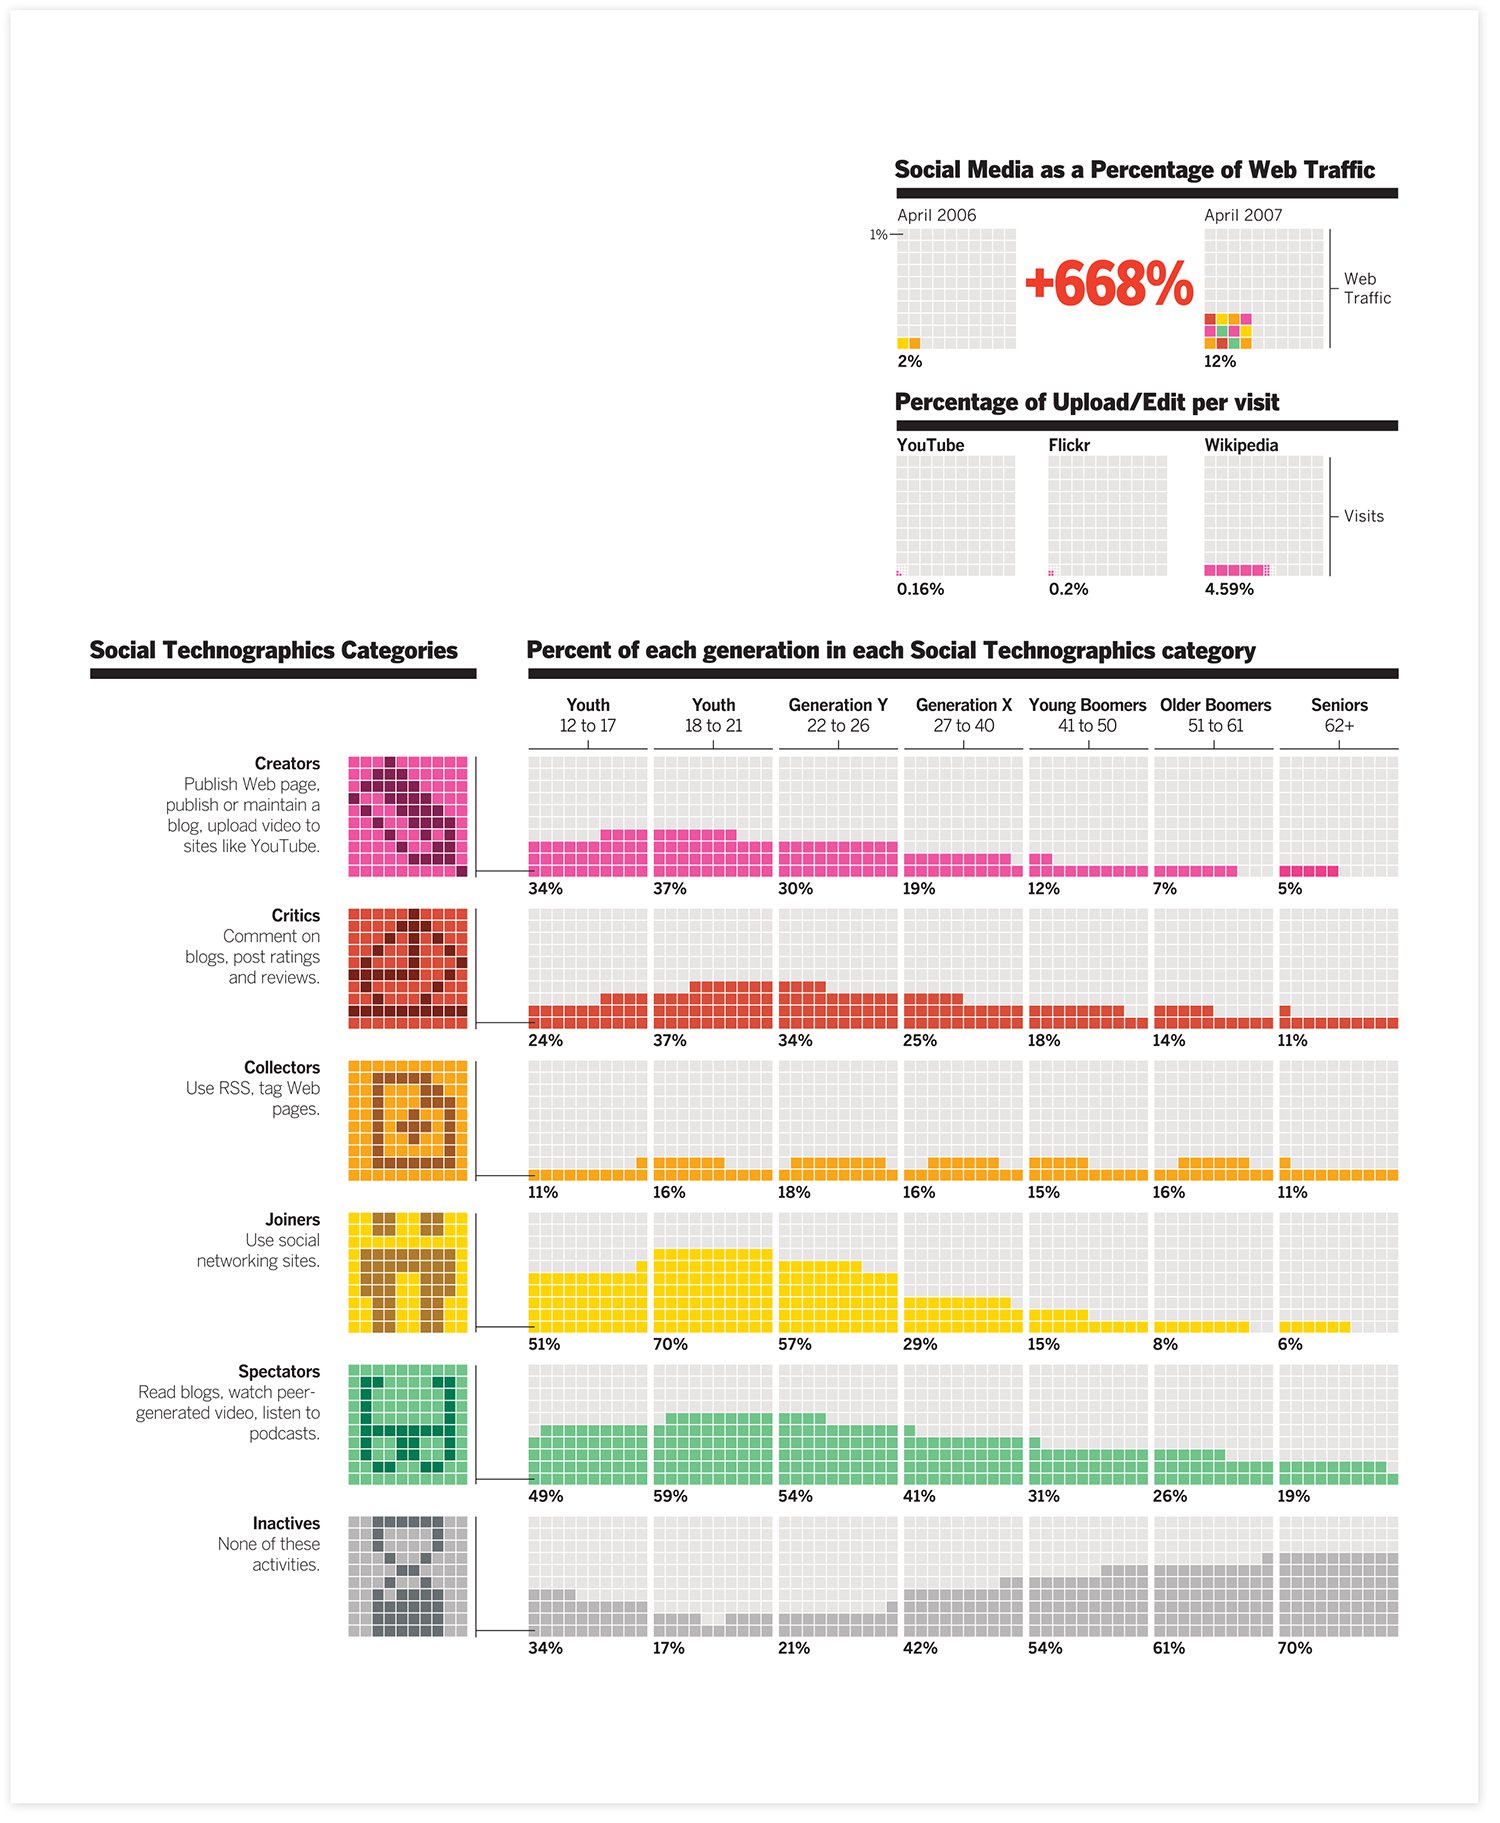
This snapshot of social media trends on the Internet was created for Business Week magazine. The clear and precise pixel graph provides the coherency we need to make comparisons, find patterns, and appreciate the richness of the data.
Arno Ghelfi, United States
The Designer’s Challenge
The never-ending flood of facts and data in our contemporary world has caused a paradigm shift in how we relate to information. Whereas at one time information was community based, slow to retrieve, and often the domain of experts, information is now global, instantaneous, and often in the public domain. We now want information and content in our own hands and on our own terms. We maintain an underlying belief that it is our fundamental right to have access to well-structured and organized information. As a result, information design is exploding as organizations and individuals scramble to manage an overwhelming quantity of content. Understanding the most effective ways to inform is now a principal concern. According to professor of information design Dino Karabeg, “Informing can make the difference between the technologically advanced culture which wanders aimlessly and often destructively, and a culture with vision and direction.”4
This has profound implications for graphic communication. There is an increasing demand for the information-packed graphic, greater competition for an audience’s visual attention, and ever more complex visual problems requiring original solutions. There are requirements to design for pluralistic cultures and a continuous need to design for the latest technologies.
As part of this new path, visual communicators need a sense of how the mind functions. Effective informative graphics focus on the audience. An increased awareness of how people process visual information can help the designer create meaningful messages that are understood on both a cognitive and emotional level. An informative image is not only well designed; it captures both the feeling of the content and facilitates an understanding of it. The final product affects how the audience perceives, organizes, interprets, and stores the message. The new role of a graphic designer is to direct the cognitive and emotional processes of the audience. In shaping the information space of a visually saturated world, efficient and accurate communication is of primary importance.
Step Inside
Visual Language for Designers is based on research from the interconnected fields of visual communication and graphic design, learning theory and instructional design, cognitive psychology and neuroscience, and information visualization. The imagery incorporates an expansive definition of visual design, exemplifying the diverse fields from which this research is drawn. This type of fusion is natural in a world of collaboration, interrelationships, and blurry delineations, and represents the diverse requests that contemporary designers must often fulfill.
The first section of Visual Language for Designers presents an overview of how we perceive, understand, and acquire visual information. The reader will also be introduced to the important concept of cognitive load, which has significant implications in the design of informative graphics.
The second section presents principles for creating graphics that accommodate the human mind and emotions. These principles are intended as a guide—as a space for exploration and discovery rather than hard-and-fast rules. The principles are meant to serve as a catalyst for finding visual solutions and fine-tuning one’s work. Most important, this book is meant to inspire new and creative ways of designing to inform.
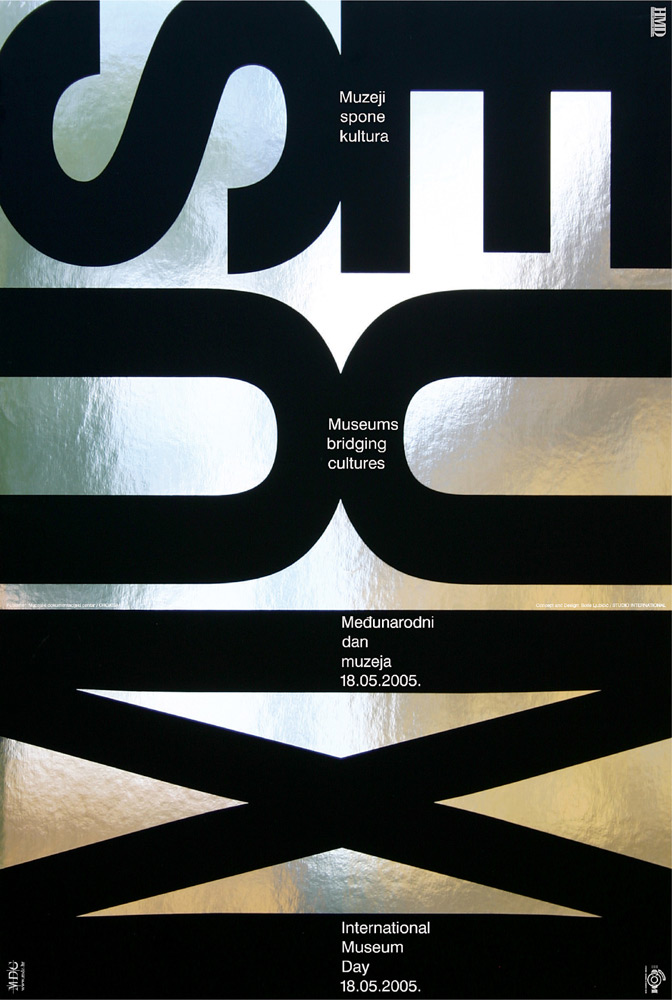
With a reflective background, this poster captures the museum experience as it receives varying images from the changing surroundings.
Boris Ljubicic, Studio International, Croatia