
Chapter 8. Strategies for fault tolerance and monitoring
- What is latency?
- Why do microservices need to be fault tolerant?
- How do circuit breakers work?
- What tools can mitigate against distributed failure?
You’ll use the example from the previous chapters to expand the functionality of Stripe and Payment to include fault mitigation as you explore the concepts of fault tolerance and monitoring. Fault tolerance is especially important when your Payment microservice is communicating over a network to external systems. You need to expect failures and time-outs when communicating across networks.
8.1. Microservice failures in a distributed architecture
Figure 8.1 revisits what your distributed architecture for microservices looks like.
Figure 8.1. Microservices in a distributed architecture
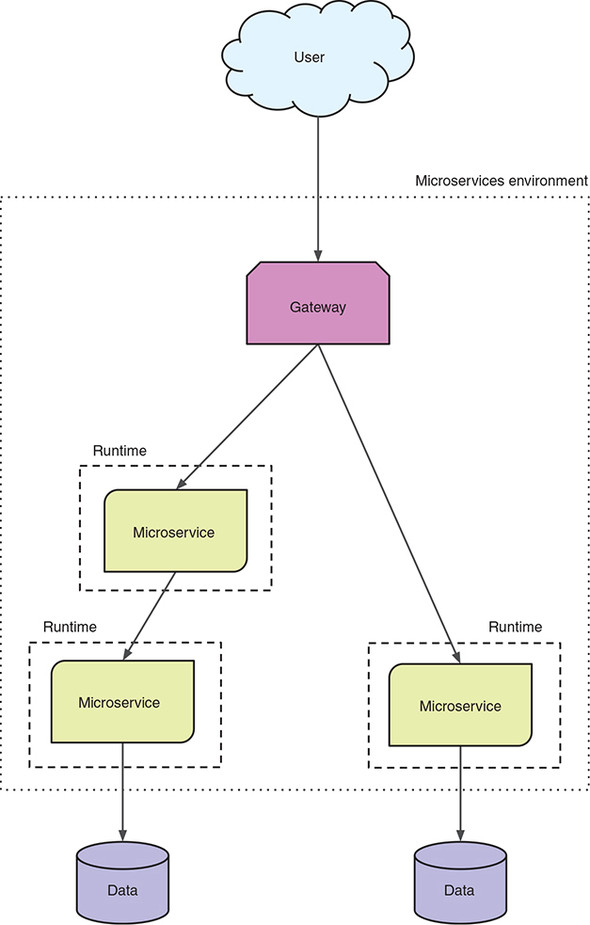
How is this distributed architecture relevant to failures? By virtue of your microservices containing smaller chunks of business logic, as opposed to a monolith that contains everything, you end up with a significantly larger number of services to maintain. You’re no longer dealing with a UI that might communicate with a single backend service that handles all its needs. More likely, that same UI is now integrating with dozens of microservices, or more, that need to be just as reliable as your previous monolith.
But your microservices won’t fail in production, right? Nothing fails in production! We’ve all likely made statements similar to that at some point, usually before we’ve been bitten by a major failure in production! Once bitten, twice fault tolerant!
Why is it that, without previous experiences of production failures, we tend toward grandiose statements about the reliability of our production systems? Some of it’s because we can be optimistic in nature, but mostly it’s a lack of experience. If you’ve never had to deal with fixing production issues for your application, especially in the middle of the night, it’s hard to appreciate the valid concerns around the reliability of systems.
I remember in the late ’90s—yes, I was in IT back then—that the most dreaded experience of the novice was to be handed the pager for on-call duty. There’s no worse feeling than getting a page around 2 a.m. about failed jobs that need to be fixed, and then trying to complete them before the staff arrives in the office at 8 a.m.! These were only nightly batch jobs, but the anxiety over being paged was terrible.
I can only imagine what it’s like to receive a page (if pagers are still around today) for a production failure on a live application that needs to be resolved because it’s affecting the 24/7 running of the business!
Here are some of the statements you might falsely believe regarding production systems, and distributed architectures in particular:
- The network of computing devices is reliable. Without taking into account the possibility of network failures, it’s possible for an application to stall while waiting for a response that won’t arrive. Worse, the application would be unable to retry any failed operations when the network is available again.
- There’s no delay in making a request and having it acted upon (known as zero latency). Ignoring network latency, and associated network packet loss, can result in wasted bandwidth and an increase in dropped network packets as the amount of traffic on the network grows without limitation.
- There’s no limitation to the available bandwidth on the network. If clients are sending too much data, or too many requests, the available network bandwidth could shrink to the point that bottlenecks appear and application throughput is reduced. The impact of latency on network throughput can last for a few seconds or be constantly present.
- The entire network is secure from possible attack, external or internal. It’s naive to ignore the possibility that a malicious user, such as a disgruntled employee, could attempt to cause damage to an application. Likewise, a once-internal application can be easily exposed to external threats by making it available publicly without proper security vetting. Even an innocuous change in firewall rules for a port could make it unintentionally accessible externally.
- Location and arrangement of computing devices on a network never changes. When networks are altered, and devices moved to different locations, the available bandwidth and latency can be diminished.
- There’s a single administrator for everything. With multiple administrators for different networks within an enterprise, conflicting security policies could be implemented. In this case, a client who needs to communicate across differently secured networks needs to be aware of the requirements of both to successfully communicate.
- Zero transport cost. Though the transport of physical data through a network may cost zero, it’s a nonzero cost to maintain a network after it’s built.
- The entire network is homogeneous. In a homogeneous network, every device on the network uses similar configurations and protocols. A nonhomogeneous network can lead to the problems described in the first three points of this list.
All these statements are known as the Fallacies of Distributed Computing (www.rgoarchitects.com/Files/fallacies.pdf).
8.2. Network failures
Though there are many ways a network can fail, in this section you’ll focus on network latency and time-outs. Previously, I mentioned zero latency as being part of the Fallacies of Distributed Computing, which equates to no delay in making a request and having it acted upon.
Why is latency important for your microservice? It affects almost anything your microservice might want to do:
- Calling another microservice
- Waiting for an asynchronous message
- Reading from a database
- Writing to a database
Without being mindful of the existence of latency in your network, you’d presume that all communication of messages and data is near instantaneous, assuming the network devices involved in the communication are sufficiently close.
Time-outs are another crucial source of network failure you need to be mindful of when developing microservices. Time-outs can be linked to high latency; requests aren’t responded to in a timely manner not only because of network delays, but also because of issues with the consuming microservice. If the microservice you’re calling has gone down, is experiencing high load, or failing for any other number of reasons, you’ll notice problems when you try to consume it, most often in the form of a time-out. There’s no way to predict when a time-out will occur, so your code needs to be aware that time-outs happen, and of how you want to handle the situation when you receive one.
Do you try again, either immediately or after a short delay? Do you presume a standard response and proceed anyway?
It’s these network failures that you want to especially mitigate against. Otherwise, you leave your microservices, and entire application, open to unexpected network failure with no means of recovering other than restarting services. Because you can’t afford to be restarting services every time a network problem occurs, you need to develop your code to prevent restarting from being your only option.
8.3. Mitigating against failures
In looking at how to mitigate against failure, you could certainly implement the features you need yourself. But you might not be an expert in all the best ways to implement the features you need. Even if you were, accomplishing that implementation requires more than a short development lifecycle. You’d rather be developing more applications! Though you might be able to use many different libraries, in this case you’re going to be using Hystrix from Netflix Open Source Software.
8.3.1. What is Hystrix?
Hystrix is a latency and fault-tolerance library intended to isolate access points with remote systems, services, and libraries; halt cascading failure; and enable resilience in distributed systems. Wherever failure is inevitable, as with distributed systems, the Hystrix library improves the resiliency of microservices in these environments.
A lot of things are going on with Hystrix, so how does this library do it? We can’t cover the entirety of Hystrix within this single chapter; that would require an entire book in its own right. But this section provides a high-level view of how Hystrix performs its segregation.
Figure 8.2 shows a view of a microservice handling the load of many user requests. This microservice needs to communicate with an external service. In this situation, it’s easy for the microservice you’ve developed to become blocked as it’s waiting for external service 2 to respond. Worse, you could overload the external service to the point it stops functioning completely.
Figure 8.2. Microservice processing user requests without Hystrix

This is where Hystrix comes in, to be the middleman and mediate your external communication in order to mitigate against various failures. Figure 8.3 adds Hystrix into the picture, by wrapping your external service calls inside HystrixCommand instances that use configuration to define its behavior, such as the number of available threads.
In figure 8.3, each external service has a different number of threads available to the respective HystrixCommand. This is an indication that some services might be easier to overload than others, and you need to restrict the number of concurrent requests that you send.
Figure 8.3. Microservice processing user requests with Hystrix

By wrapping external service 2 into a HystrixCommand, you’re limiting the number of requests that call it from your microservice concurrently. Though you’ve added mitigation for interacting with that particular external service, you’ve just increased the likelihood of requests failing in your microservice because you’re rejecting additional requests out to the external service! Such a situation may be fine, or it may not; the outcome depends on the speed with which the external request can process your requests.
This does raise an important point. Adding failure mitigation to a single micro-service within an entire ecosystem isn’t that beneficial. Making your microservice a better citizen within the distributed network is great, but if everyone else in the network doesn’t have the same mitigation for interacting with your microservice, you’ve simply moved where the bottleneck and failure point reside. For this reason, it’s critical that failure mitigation is an enterprise-wide concern, or at least within a grouping of microservices that all communicate with each other.
Another advantage to Hystrix that you can see in figure 8.3 is the isolation it provides between external services. If calls to external service 2 weren’t limited, there’s a good chance it could consume all available threads within the JVM, preventing your micro-service from handling requests that don’t need to interact with external service 2!
For the remainder of the chapter, our approach will be to outline the theory behind a mitigation strategy for failures, and then show how that strategy is implemented within Hystrix. You know you need to mitigate against network failures in your code, so what strategies do you have at your disposal?
8.3.2. Circuit breakers
If you’re in any way familiar with the way fuses work in your home’s electrical panel, you’ll understand the principles of a circuit breaker. Figure 8.4 shows that electricity flows through a fuse unhindered unless it’s tripped open, causing the flow to be interrupted.
Figure 8.4. Electrical circuit-breaker states

The one difference between an electrical panel and software is that a software circuit breaker will automatically close itself without manual intervention, based on thresholds that have been defined to indicate the level at which it becomes unhealthy.
Figure 8.5 shows the initial part of a larger flow to mitigate against failures when calling external services. As you progress through this chapter, additional parts will be added to the flow, providing additional functionality to assist with mitigation. This first part focuses on providing a circuit breaker.
Figure 8.5. Failure mitigation flow with basic circuit

When the circuit breaker is Closed, all requests continue through the flow. When the circuit breaker is Open, the requests exit the flow early. You can see in figure 8.5 that your circuit breaker requires Circuit Health Data, which is used in determining whether the circuit should be open or closed. In addition to the states in figure 8.5, a circuit breaker can be in a Half Open state. See figure 8.6.
Figure 8.6. Circuit-breaker states

Here are the transitions between states of a circuit breaker:
- All requests pass through unhindered, as the circuit is Closed.
- When a failure threshold is reached, the circuit becomes Open.
- While the circuit is Open, all requests are rejected, failing fast.
- The circuit’s Open time-out expires. The circuit moves to Half Open to allow a single request to pass.
- The request fails or succeeds:
- The single request fails, returning the circuit to Open.
- The single request succeeds, returning the circuit to Closed.
In the Half Open state, the circuit breaker is officially still Closed. But after a sleep time-out is reached, a single request will be allowed to pass through. The success or failure of this single request then determines whether the state shifts back to Closed (a single request was successful), or whether it remains Open until making another attempt when the next time-out interval is reached.
A circuit breaker is only a way to allow or prevent requests from passing through. The key piece to it behaving the way you want is the Circuit Health Data. Without capturing any Circuit Health Data, the circuit breaker would always remain Closed, regardless of how many requests might fail or for what reasons.
Hystrix provides sensible defaults for a circuit breaker to handle time-outs, network congestion, and latency with any request you make. Let’s take a look at a simple Hystrix circuit breaker.
Listing 8.1. StockCommand
public class StockCommand extends HystrixCommand<String> {           1
    private final String stockCode;

    public StockCommand(String stockCode) {
        super(HystrixCommandGroupKey.Factory.asKey("StockGroup"));   2
        this.stockCode = stockCode;
    }

    @Override
    protected String run() throws Exception {                        3
        // Execute HTTP request to retrieve current stock price
    }
}
- 1 Specify String as the HystrixCommand Type.
- 2 Unique key for grouping data in the Hystrix dashboard
- 3 Execution of call to external service
You can then call this command synchronously with code such as the following:
String result = new StockCommand("AAPL").execute();
If you prefer asynchronous execution, you use this:
Future<String> fr = new StockCommand("AAPL").queue();
String result = fr.get();
In each of the examples, you’re expecting only a single result from executing the request, whether you’re calling it synchronously or asynchronously. For that reason, you choose to extend HystrixCommand, which caters to single-response executions.
What happens if you expect multiple responses instead of one? Stock prices change extremely frequently, so wouldn’t it be nice to not continually execute another call every time you want it updated?
You need to modify your circuit breaker to support a command that returns an Observable that can emit multiple responses. You’ll subscribe to this Observable to handle each response as it’s received. Handling each response as it’s returned identifies the execution as being reactive.
Definition
Reactive is an adjective meaning acting in response to a situation rather than creating or controlling it. When you’re using an Observable and listening to results that are emitted from it, you’re acting in response to each emitted result. An advantage with this approach is that you don’t block while waiting for each result to be emitted.
Let’s modify your command to provide an Observable.
Listing 8.2. StockObservableCommand
public class StockObservableCommand extends HystrixObservableCommand<String> { 1
    private final String stockCode;

    public StockObservableCommand(String stockCode) {
        super(HystrixCommandGroupKey.Factory.asKey("StockGroup"));             2
        this.stockCode = stockCode;
    }

    @Override
    protected Observable<String> construct() {                                 3
        // Return an Observable that executes an HTTP Request
    }
}
- 1 Specify String as the HystrixObservableCommand type.
- 2 Unique key for grouping data in the Hystrix dashboard
- 3 Return an Observable that executes a call to an external service.
If you want the command to be executed as soon as an Observable is created, you request a hot Observable:
Observable<String> stockObservable =new StockObservableCommand(stockCode).observe();
Normally, a hot Observable will emit responses whether or not there are subscribers, which makes it possible for responses to be lost completely if no one is subscribed. But Hystrix uses ReplaySubject to capture those responses for you, allowing them to be replayed to your own listener when you subscribe to the Observable.
You could also use a cold Observable instead:
Observable<String> stockObservable =
With a cold Observable, the execution isn’t triggered until a listener has subscribed to it. This guarantees that any subscriber will receive all notifications that the Observable has produced.
Which type of Observable to use depends on your situation. If a listener can afford to miss some initial data, especially if they’re not the first subscriber to an Observable, then hot is appropriate. If, however, you want a listener to receive all data, then cold is the better choice.
Note
Though HystrixCommand supports returning an Observable from its nonreactive methods, execute() and queue(), they’ll always emit only a single value.
8.3.3. Bulkheads
Bulkheads in software offer a similar strategy to those in ships, by isolating different parts to prevent a failure in one from impacting others. For ships, a failure in a single watertight compartment doesn’t spread to others because they’re separated by bulkheads.
How does a software bulkhead achieve the same result? By shedding the load that a microservice is experiencing or is about to experience. A bulkhead allows you to limit the number of concurrent calls to a component or service, to prevent the network from becoming saturated with requests, which would then increase latency across all requests in the system. Figure 8.7 adds the bulkhead strategy as the next step in your flow.
Figure 8.7. Failure mitigation flow with bulkhead

You add a bulkhead after any circuit breaker. There’s no need to check the bulkhead if the circuit breaker is Open, because you’re in an error state. When you’re in a Closed state, the bulkhead prevents too many requests from being executed that could create a network bottleneck.
You may need to call a database service to perform a computation that’s extremely intensive and time-consuming, for instance. If you know that the external service can take 10 seconds to respond, you don’t want to be sending more than six requests a minute to that service. If you send more than six, your requests are queued for later processing, which causes your microservice to hold up client requests to itself from being released. It’s a vicious cycle that can be hard to break, potentially resulting in cascading failures through your microservices. The bulkhead in figure 8.7 performs its checks and indicates whether you’re OK to continue processing the request or whether it needs to be rejected.
How would you implement a software bulkhead? Two of the most common approaches are counters and thread pools. Counters allow you to set a maximum number of parallel requests that can be active at any one time. Thread pools also limit the number of parallel requests that are simultaneously active, but by limiting the number of threads available in a pool for executing requests. For a thread-pool bulkhead, a specific pool is created to handle requests to a particular external service, allowing different external services to be isolated from each other, but also isolated from the thread being used to execute your microservice.
Details of rejected requests are provided to Circuit Health Data so that counters can be updated for use the next time that the circuit breaker status needs to be calculated.
As a software bulkhead, Hystrix provides execution strategies for thread pools (THREAD) and counters (SEMAPHORE). By default, HystrixCommand uses THREAD, and HystrixObservableCommand uses SEMAPHORE.
HystrixObservableCommand doesn’t need to be bulkheaded by threads, because it’s already executing in a separate thread via the Observable. You can use THREAD with HystrixObservableCommand, but doing so doesn’t add safety. If you wanted to run StockCommand in SEMAPHORE, it would look like the following listing.
Listing 8.3. StockCommand using SEMAPHORE
public class StockCommand extends HystrixCommand<String> {
    private final String stockCode;

    public StockCommand(String stockCode) {
        super(Setter                                                   1

    .withGroupKey(HystrixCommandGroupKey.Factory.asKey("StockGroup"))
             .andCommandPropertiesDefaults(
                 HystrixCommandProperties.Setter()
                     .withExecutionIsolationStrategy(

    HystrixCommandProperties.ExecutionIsolationStrategy.SEMAPHORE      2
                      )
              )
        );

        this.stockCode = stockCode;
    }

    ...
}
- 1 Using Setter as a fluent interface to define additional configuration for Hystrix
- 2 Set the execution isolation strategy to SEMAPHORE.
The listing illustrates how to set additional configuration for Hystrix to customize the way a particular command behaves. In practice, you wouldn’t use SEMAPHORE with HystrixCommand because it doesn’t provide any ability to set time-outs on how long an execution should take. Without time-outs, you can easily find yourself with a deadlocked system if the service you consume fails to provide a timely response.
8.3.4. Fallbacks
Currently, when your circuit breaker or bulkhead doesn’t proceed with the request, an error response is returned. Though that’s not great, it’s better than your micro-service being in a state of waiting until time-out.
Wouldn’t it be nice if you could provide a simple response in place of the failure? In some cases, it certainly may not be possible to provide a common response for these situations, but often it’s possible and beneficial.
In figure 8.8, you can see fallback handling after Circuit Breaker and Bulkhead on the failure paths. If the microservice your method wants to consume has a fallback handler registered, its response is returned to you. If not, the original error is returned.
Figure 8.8. Failure mitigation flow with fallback handling

Let’s see how to implement a fallback handler for StockCommand.
Listing 8.4. StockCommand with fallback
public class StockCommand extends HystrixCommand<String> {
    ...

    @Override
    protected String getFallback() {                                   1
        // Return previous days cached stock price, no network call.
    }
}
- 1 Override the default fallback that throws the failure exception.
Implementing a fallback handler is a little different when you’re dealing with HystrixObservableCommand, but not much.
Listing 8.5. StockObservableCommand with fallback
public class StockObservableCommand extends HystrixObservableCommand<String> {
    ...

    @Override
    protected Observable<String> resumeWithFallback() {                 1
        // Return previous days cached stock price as an Observable,
no network call.
    }
}
- 1 Returns an Observable<String> instead of String to match the command response type
8.3.5. Request caching
Though not directly mitigating against a failure, request caching can prevent bulkhead and other failures from occurring by reducing the number of requests you make on another microservice.
How does it do that? With a request cache, previous requests and their responses can be cached, allowing you to match future requests and return the response from the cache instead. Figure 8.9 shows the request cache sitting in front of other mitigation strategies as it reduces the number of requests that need to pass through any subsequent stages of the flow.
Figure 8.9. Failure mitigation flow with request cache

The request cache provides the joint benefits of reducing the number of requests passing through your mitigation flow and increasing the speed with which a response is returned. Enabling the request cache isn’t appropriate for all situations but is beneficial when the data being returned doesn’t change at all or is unlikely to have changed during the time your microservice completes its task.
This solution is particularly beneficial for reference data or for retrieving a user account, as some examples. It allows your microservice to call out to an external microservice as many times as needed without fear of increasing network traffic. This approach also simplifies the interfaces of your microservices’ internal methods and services, as you no longer need to pass around data in your calls to prevent an additional call. With a request cache, you have no risk of additional calls.
To enable the request cache in Hystrix, you need to do two things. First, you need to activate HystrixRequestContext so you have a means of caching responses:
HystrixRequestContext context = HystrixRequestContext.initializeContext();
This call needs to occur before executing any Hystrix commands. For our situations, you make the first call inside your JAX-RS endpoint method, as you’ll see later. Second, you need to define the key to use for caching requests and their responses.
Listing 8.6. StockCommand with request cache
public class StockCommand extends HystrixCommand<String> {
    private final String stockCode;

    ...

    @Override
    protected String getCacheKey() {       1
        return this.stockCode;
    }
}
- 1 Override key for request cache with the stock symbol you used in your request
8.3.6. Putting it all together
In your flow so far, you have a request cache, circuit breaker, bulkhead, and fallback. Figure 8.10 shows how they fit into an actual call.
Figure 8.10. Entire failure mitigation flow

Here you add Execute to indicate that you’re making the call to an external service. Any failures or time-outs that Execute experiences feed back into the fallback handling, but also provide the failure data to Circuit Health Data. The information is then used by the circuit breaker to determine whether error thresholds have been reached, and the circuit should switch to Open.
Figure 8.11 takes the flow a step further to show how Hystrix provides these features when integrated between your microservice, Service A, and one that you consume, Service B.
Figure 8.11. Microservice calls with failure mitigation

As the request enters your Service A method, or endpoint, you create a request and pass it to Hystrix. The request passes through whichever checks have been enabled before being executed on Service B. A response from Service B passes back to your Service A method for any required processing before you construct a response for the client.
As you can see, at many points Hystrix can provide a different, or cached, response without needing to call Service B directly. Such a flow provides many benefits in directly reducing failures, but also in reducing the factors that lead to failure. An example is the reduction of microservice load by using a request cache.
Though you’ve been seeing how Hystrix implements these failure mitigation features, other libraries or frameworks that provide the same features should operate in a similar manner. But the way that other libraries or frameworks implement the required mitigation can differ greatly.
8.3.7. Hystrix Dashboard
Awesome—you can now improve the reliability of your microservices in a distributed architecture. But how can you determine whether a particular microservice is continually causing failures? Or whether you need to tune settings to reduce errors and handle additional load?
Sounds like you need a way to monitor how your fault-tolerance library is performing. It just so happens that Hystrix provides SSEs (server-sent events), providing many details about a particular microservice. You can see and analyze everything—the number of hosts running the microservice, requests processed, failures, time-outs, and more.
Hystrix also provides a way to visualize all these events: the Hystrix Dashboard, shown in figure 8.12. The Hystrix Dashboard provides a visual representation of the SSEs that it receives from each registered stream. You’ll get to see what a stream is shortly.
Figure 8.12 shows the information for the StockCommand. There are many data points in such a small UI, but some of the most crucial are as follows:
Figure 8.12. A single circuit from the Hystrix Dashboard

- Error percentage in last 10 seconds—100%
- Number of hosts running the microservice—1
- Successful requests in last 10 seconds—0
- Short-circuited requests that were rejected in the last 10 seconds—40
- Failures in last 10 seconds—0
- Circuit is open or closed—Open
Tip
Full details of each metric for a circuit can be found at https://github.com/Netflix/Hystrix/wiki/Dashboard.
Let’s see the dashboard in action. Change into the /hystrix-dashboard directory and build the project:
mvn clean package
then run the dashboard:
java -jar target/hystrix-dashboard-thorntail.jar
After the dashboard is started, open a browser and navigate to http://localhost:8090/. For the dashboard to visualize metrics data, it needs to get that data from your circuit breaker! For a single circuit, you can add the SSE stream directly by adding http://localhost:8080/hystrix.stream into the main entry box, as shown in figure 8.13. Click the Add Stream button and then click Monitor Streams. The main page will load, but until you start your microservice, no SSEs are being received in the stream, so the visualization won’t appear yet.
Figure 8.13. Hystrix Dashboard homepage

Change to the /chapter8/stock-client directory and start the microservice:
mvn thorntail:run
In another browser window, you can access http://localhost:8080/single/AAPL to request the current stock price details represented by the code AAPL. Any valid stock code could have been used in the URL path.
If you refresh the page, or make multiple requests in another manner, you can switch back to the Hystrix Dashboard and see the data on your circuit.
Your stock-client has built-in handling to showcase specific Hystrix functionality. For instance, every tenth request will throw an exception back to your consuming microservice, and every second request is put to sleep for 10 seconds to trigger a time-out. This allows you to see how failures are represented on the dashboard.
To see how request caching works, you can access http://localhost:8080/single/AAPL/4. Note in the console that only a single request was made to the external service, and each response to the browser has an identical request number.
To fully see your circuit in action, you need to hit the service many times:
curl http://localhost:8080/single/AAPL/?[1-100]
This hits your service 100 times in succession, allowing you to monitor the circuit in the dashboard as you see the requests come in. You’ll notice a point at which too many errors have occurred, causing the circuit breaker to open. Then you immediately see all remaining requests short-circuited by not calling the microservice and returning the fallback instead. If you wait a few seconds before accessing the service through a browser as before, you then see the circuit-breaker attempt the request, succeed, and revert to Closed again.
Play around with the settings in StockCommand to see how the circuit behavior changes. One example, which is present in the book’s example code, is to modify StockCommand to set the number of threads that should be available to consume the microservice.
Listing 8.7. StockCommand with thread configuration
super(Setter
    .withGroupKey(HystrixCommandGroupKey.Factory.asKey("StockGroup"))
    .andCommandPropertiesDefaults(
            HystrixCommandProperties.Setter()
                    .withCircuitBreakerRequestVolumeThreshold(10)
                    .withCircuitBreakerSleepWindowInMilliseconds(10000)
                    .withCircuitBreakerErrorThresholdPercentage(50)
    )
    .andThreadPoolPropertiesDefaults(
            HystrixThreadPoolProperties.Setter()
                    .withCoreSize(1)                1
    )
);
- 1 Specifies that a single thread must be used
With the listing 8.7 constructor for StockCommand, rerunning your tests shows requests being rejected by ThreadPool.
After taking a look at the Hystrix Dashboard, we should all appreciate how crucial such a tool is in our arsenal. Adding Hystrix to your external calls provides a level of fault tolerance to those executions, but it’s not foolproof. You need continual real-time monitoring of your microservices to track impending problems and observe failures that could be resolved with tuning of circuit-breaker settings.
If you don’t take advantage of what the Hystrix dashboard offers, particularly in terms of real-time monitoring, you won’t receive all the benefits of using a fault-tolerant library in your code.
8.4. Adding Hystrix to your Payment microservice
You’ve seen how Hystrix can be implemented and its metrics viewed from a dashboard. Your Stripe microservice isn’t super reliable, so let’s use Hystrix in Payment to make sure you’re not overly impacted by its failures or time-outs!
The previous sections have covered the various pieces Hystrix offers to help with fault mitigation. When adding Hystrix to Payment, you’ll take advantage of the full flow that Hystrix provides.
For each of the next sections, you need your Stripe microservice running, so let’s start that now. First you need to make sure that a Minishift environment is running and that you’ve logged into it with the OpenShift client. Then change to the /chapter8/stripe directory and run this:
mvn clean fabric8:deploy -Popenshift -DskipTests
8.4.1. Hystrix with the RESTEasy client
Let’s modify Payment from chapter 7 with a HystrixCommand for interacting with Stripe.
Listing 8.8. StripeCommand
public class StripeCommand extends HystrixCommand<ChargeResponse> {
    private URI serviceURI;

    private final ChargeRequest chargeRequest;

    public StripeCommand(URI serviceURI, ChargeRequest chargeRequest) {    1
        super(Setter
          .withGroupKey(HystrixCommandGroupKey.Factory.asKey("StripeGroup"))
          .andCommandPropertiesDefaults(
              HystrixCommandProperties.Setter()
                  .withCircuitBreakerRequestVolumeThreshold(10)
                  .withCircuitBreakerSleepWindowInMilliseconds(10000)
                  .withCircuitBreakerErrorThresholdPercentage(50)
          )
        );

        this.serviceURI = serviceURI;
        this.chargeRequest = chargeRequest;
    }

    public StripeCommand(URI serviceURI,                                   2
            ChargeRequest chargeRequest, HystrixCommandProperties.Setter
commandProperties) {
        super(Setter

     .withGroupKey(HystrixCommandGroupKey.Factory.asKey("StripeGroup"))
                      .andCommandPropertiesDefaults(commandProperties)
        );

        this.serviceURI = serviceURI;
        this.chargeRequest = chargeRequest;
    }

    @Override
    protected ChargeResponse run() throws Exception {                      3
        ResteasyClient client = new ResteasyClientBuilder().build();
        ResteasyWebTarget target = client.target(serviceURI);

        StripeService stripeService = target.proxy(StripeService.class);
        return stripeService.charge(chargeRequest);
    }

    @Override
    protected ChargeResponse getFallback() {
        return new ChargeResponse();                                       4
    }
}
- 1 Pass the Stripe URL and ChargeRequest into the command and set up properties.
- 2 Overloaded constructor allowing Hystrix properties to be set up by caller
- 3 Equivalent to PaymentServiceResource method in chapter 7, as call is no longer made in JAX-RS Resource
- 4 Fallback to empty ChargeResponse if there was a problem.
Now that you have your StripeCommand, how different does PaymentServiceResource from chapter 7 look?
Listing 8.9. PaymentServiceResource
@Path("/")
@ApplicationScoped
public class PaymentServiceResource {
    ....

    @POST
    @Path("/sync")
    @Consumes(MediaType.APPLICATION_JSON)
    @Produces(MediaType.APPLICATION_JSON)
    @Transactional
    public PaymentResponse chargeSync(PaymentRequest paymentRequest) throws
Exception {
        Payment payment = setupPayment(paymentRequest);
        ChargeResponse response = new ChargeResponse();

        try {
            URI url = getService("chapter8-stripe");

            StripeCommand stripeCommand = new StripeCommand(               1
                url,
                paymentRequest.getStripeRequest(),
                HystrixCommandProperties.Setter()
                    .withExecutionIsolationStrategy(
        HystrixCommandProperties.ExecutionIsolationStrategy.SEMAPHORE
                       )
                      .withExecutionIsolationSemaphoreMaxConcurrentRequests(1)
                      .withCircuitBreakerRequestVolumeThreshold(5)
            );

            response = stripeCommand.execute();                            2
            payment.chargeId(response.getChargeId());
        } catch (Exception e) {
            payment.chargeStatus(ChargeStatus.FAILED);
        }

        em.persist(payment);
        return PaymentResponse.newInstance(payment, response);
    }

    @POST
    @Path("/async")
    @Consumes(MediaType.APPLICATION_JSON)
    @Produces(MediaType.APPLICATION_JSON)
    public void chargeAsync(@Suspended final AsyncResponse asyncResponse,
            PaymentRequest paymentRequest) throws Exception {
        Payment payment = setupPayment(paymentRequest);

        URI url = getService("chapter8-stripe");
        StripeCommand stripeCommand =
            new StripeCommand(url, paymentRequest.getStripeRequest());     3

        stripeCommand
            .toObservable()                                                4
            .subscribe(                                                    5
                (result) -> {
                    payment.chargeId(result.getChargeId());
                    storePayment(payment);
                    asyncResponse.resume(PaymentResponse.newInstance(payment,
    result));
                },
                (error) -> {
                    payment.chargeStatus(ChargeStatus.FAILED);
                    storePayment(payment);
                    asyncResponse.resume(error);
                }
            );
    }
    ....
}
- 1 Instantiate command and set Hystrix properties.
- 2 Block on command execute().
- 3 Instantiate command with default Hystrix properties.
- 4 Get Observable for command.
- 5 Subscribe to the Observable, passing success and failure methods.
Your PaymentServiceResource has shown that when expecting only a single response, you’re able to easily switch between synchronous and asynchronous execution modes with the same HystrixCommand implementation.
It didn’t take much of a refactor from your chapter 7 version to this one, mostly extracting out the code that consumes the external microservice into a new method and class, StripeCommand.
Now that you’ve refactored your resources, let’s run it! Change to the /chapter8/ resteasy-client directory and run this:
mvn clean fabric8:deploy -Popenshift
If the Hystrix Dashboard is still running, head back to the homepage so you can add a new stream. If it’s not still running, start it up again as you did earlier in the chapter.
Copy the URL for chapter8-resteasy-client from the OpenShift console, paste it into the text box on the Hystrix Dashboard homepage, and add hystrix.stream as a URL suffix. Click Add Stream and then Monitor Streams.
The Hystrix Dashboard won’t show anything immediately because you haven’t made any requests yet. To exercise the Payment service, you can execute either single requests or multiple requests, with the latter being easier to see results in the dashboard, especially if their execution can be automated.
With the URL for chapter8-resteasy-client from earlier, you can access the synchronous (/sync) or asynchronous (/async) versions of the service. After starting a series of requests on either, or both, of those endpoints, the Hystrix Dashboard will show all the details of successful and failed requests that have been made.
8.4.2. Hystrix with the Ribbon client
Your RESTEasy client required a little bit of rework to add Hystrix support. Now you’ll take a look at what’s required for the Ribbon client.
First, you need to update your interface definition for the Stripe microservice so that it takes advantage of Hystrix annotations with Ribbon.
Listing 8.10. StripeService
@ResourceGroup(name = "chapter8-stripe")
public interface StripeService {

    StripeService INSTANCE = Ribbon.from(StripeService.class);

    @TemplateName("charge")
    @Http(
            method = Http.HttpMethod.POST,
            uri = "/stripe/charge",
            headers = {
                    @Http.Header(
                            name = "Content-Type",
                            value = "application/json"
                    )
            }
    )
    @Hystrix(                                                       1
            fallbackHandler = StripeServiceFallbackHandler.class
    )
    @ContentTransformerClass(ChargeTransformer.class)
    RibbonRequest<ByteBuf> charge(@Content ChargeRequest chargeRequest);
}
That was easy—only a few extra lines!
Note
Hystrix annotations are available only for use in combination with Netflix Ribbon.
Right now, the code won’t compile because you don’t have the class for the fallback handler. Let’s add that.
Listing 8.11. StripeServiceFallbackHandler
public class StripeServiceFallbackHandler implements FallbackHandler<ByteBuf> {
    @Override
    public Observable<ByteBuf> getFallback(                              1
        HystrixInvokableInfo<?> hystrixInfo,
        Map<String, Object> requestProperties) {

        ChargeResponse response = new ChargeResponse();
        byte[] bytes = new byte[0];
        try {
            bytes = new ObjectMapper().writeValueAsBytes(response);      2
        } catch (JsonProcessingException e) {
            e.printStackTrace();
        }
        ByteBuf byteBuf =
     UnpooledByteBufAllocator.DEFAULT.buffer(bytes.length);
        byteBuf.writeBytes(bytes);                                       3
        return Observable.just(byteBuf);                                 4
    }
}
- 1 Implement getFallback() to return whatever you choose in the fallback case.
- 2 Create an empty ChargeResponse to use for fallback and convert to byte[].
- 3 Write byte[] into ByteBuf that you created on the previous line.
- 4 Create an Observable that returns the ByteBuf content as a single result.
The last piece you need is to update PaymentServiceResource from chapter 7. But not so! One advantage of using Hystrix with Ribbon when using annotations is that your PaymentServiceResource from chapter 7 doesn’t need to change at all. A big advantage is that you can easily add Hystrix into an existing microservice that uses Ribbon without refactoring. Simply add an extra annotation and a fallback handler, if needed.
Time to run it! Change to the /chapter8/ribbon-client directory and run this:
mvn clean fabric8:deploy -Popenshift
As with the RESTEasy client example, you can open a browser and access /sync or /async URLs of the service, using the base URL from the OpenShift console for the service. You can then update the Hystrix Dashboard to use this new stream, execute some requests, and see how the dashboard changes.
As with other examples you’ve deployed to Minishift, after you’re finished, you need to undeploy them to free up the resources:
mvn fabric8:undeploy -Popenshift
Summary
- Latency and fault tolerance are important when considering deployments to a distributed architecture, as it can adversely affect the throughput and speed of your microservices.
- Your code that consumes microservices can be wrapped with Hystrix to incorporate fault-tolerant features such as fallback, request caching, and bulkheads.
- Hystrix alone is not a panacea for supreme fault tolerance. Real-time monitoring, through a tool such as the Hystrix Dashboard, is crucial to successfully improving overall fault tolerance.