
In this chapter we look at actual real-world case studies of AI in action; real-world problems where learning from experience of humans and machines is required. We have to balance the limitation of AI theory, the limitations of AI technology and what we can actually learn from experience practically. We are not going to go deep into the mathematics, however, because we would drift towards ML too far and lose the big picture.
The first case study is an ML problem, the second is an AI problem with an important role for ML and the final case study looks at the hard work of engineering AI technology in a company in the early, embryonic, stages of growing.
8.1 PREDICTING THE PERFORMANCE OF A WAREHOUSE
In this section, we start with an example of operational research and engineering, two of the underpinning academic disciplines that ML comes from. This first study examines the loading of a warehouse storing products that need to cool over a long period of time. It is based on a real example, and we will assiduously stick to the process of what was done. Our aim is to introduce you to what is involved, practically, in developing a project where ‘learning from experience’ is key and AI or ML can take away the heavy lifting – in this case, that of monotonous calculations.
8.1.1 Background to the problem
On a large industrial site space is precious, and building a large store able to allow products to cool is costly. Storage costs must be kept to a minimum, which drives the incentive to produce a building design that allows the products to cool naturally.
In this case study, heat from the contents was used to drive buoyant, warm air out and draw cool air in, which imposed strict limits on the total amount of heat that could be held in the store at any time. Replacing the mechanical cooling equipment was safer, better for the environment, quicker to build and easier to operate, which made the design of the naturally cooling stores a sensible option from a sustainability point of view. However, the design team were unsure of the inventory, so they needed to learn how to model these aspects of the warehouse.
As the storage vault could only hold a set maximum heat, the next question was how to represent the cooling of the vault’s contents in the model. A busy industrial site is a complex environment with lots of activity; so, should they model the movement of the products around the site and assess how they have cooled before reaching the store? Should they model the local weather and take advantage of the colder winter months?
If we are not careful, conundrums can run away with themselves and quickly turn a model into a complex system – the number of options becomes overwhelming! Is this an AI project or a ML project?
8.1.2 Is it an AI project or an ML project?
In this book, we have assumed that AI is based on the agent schematic (learning, sensors, actuators and an environment) and that ML is learning from data. In this case study there is certainly an environment that will contain lots of sensors and actuators, and we could possibly learn from these. We can make some assumptions to simplify our problem and enlist experts to give us the ‘heuristics’, or ‘rules of thumb’, that will make our learning from experience much more effective. It certainly could be an AI project, but it is a ML project – learning from data!
8.1.3 There are simply too many things to consider
At the start of a project like this, there is a temptation to build a solution that is too big and too complex; that is called a combinatorial explosion. In addition, because a computer can do lots of calculations quickly, there is also a temptation to use brute force and model every permutation. This is unworkable, in reality, because we have limited computational hardware and will somehow have to analyse all the results. For example, it is unfeasible to model every possible move in chess using brute force.
To begin work on a project, we need to understand what constitutes ‘fit for purpose’, and so need to consult the domain experts. In doing so, we can also ask what rules of thumb we could draw on to give us a starting point. In this case study, the domain experts kept the project’s goals realistic and, after significant discussions, the following concepts were developed:
- The key parameter was the total heat load in the vault.
- The heat load of products going into the store needed to be known.
- The rate that each type of product arrived at the store needed to be known.
- The rate that heat generation decayed needed to be known.
To avoid the combinatorial explosion, the human ‘learning from experience’ needed to set up a project that could be solved by machines. At this point, the team had a pretty good idea of the scope of work – the domain expert had given their best starting point and a sensible way to draw back from a combinatorial explosion.
It was clear this was a ML problem rather than AI because the environment was not being manipulated with sensors and actuators – ML was being used to design the building by:
- understanding the rate at which each type of product arrived at the store;
- modelling the decay of heat generation of the products in the store.
8.1.4 The scientific method
The scientific method, described in Chapter 1, can be used to understand the two ML parts of this project.
Note that the ML was going to learn from data about the heat generation characteristics of each product type; it was also going to be rigorous, fit for purpose and reproducible. The domain expert could quality assure it. The team avoided an intractable problem, gave themselves a good chance of success and built domain expert credibility. The plan also placed them on a good foundation for justifying the work with stakeholders.
8.1.5 Is it technically robust and trustworthy?
At the early stage of the project the team could not be absolutely sure whether the product would be technically robust and trustworthy without analysis and the results. What they could say was that the adoption of the domain expert’s heuristics, a good understanding of what ‘fit for purpose’ meant and using the scientific method pointed them in the right direction.
The two ML project activities now needed another domain expert: a product specialist who could define and provide models to predict the heat generation rate of each product and, of course, when the products were going to arrive.
8.1.6 The machine learning solution
The product specialist needed to use ML to characterise the products into six different types. In doing so, the expert also determined that the products would arrive between fixed start and end dates. The rate at which the products arrived was also uniform, which was ideal as it made the prediction of what products would be in the store at any point in time almost trivial. At this point, the ML could be considered to have done its job, but there was another task to undertake: how to model the cooling of the product.
To make this task simpler, the team made the assumption that, provided the store could safely remove heat if it was not overloaded, they only needed to know how much cooling was required at any point in time. The products generated heat because they were undergoing exothermic reaction. The heat generation was not trivial, but the domain expert was able to provide the heat generation decay curves as data points and the ML modelled them, which is best described as numerical analysis. Simple cubic splines were used to give a piece-wise continuous representation of the decay of heat generation for each product type.
A simplified model of the heat load within the store was now in place. It used the scientific method to justify its results. By working with the domain experts, the team managed to simplify the ML and avoid a runaway problem, while making sure they did not fall into the trap of using the latest buzzword ML technique. They arrived at this point using human learning from experience as well as enlisting the use of computers and ML to avoid repetitive and error prone calculations. The higher value work within this project was undertaken by the humans, and the machines did what they do best – the monotonous accurate calculations.
8.1.7 The output of the project
It took about six weeks for the project to be completed. The output was a report, not particularly long and therefore easily digestible by the stakeholders, reviewers and engineers. The report was written as the project was running, rather than at the end, and it told a story constructed using the scientific method and backed up by the results. Learning from experience was used wherever possible by both humans and machines; heuristics and assumptions allowed the problem to be simplified so that the hardware was sufficient to actually obtain ML results and the team avoided a combinatorial explosion of possible outcomes.
Of the six weeks, it took about four weeks to prepare the ML for the task; this included identifying domain experts and obtaining their input and results. The final two weeks used the ML to model the store’s performance and complete a few learning iterations to optimise the store’s design.
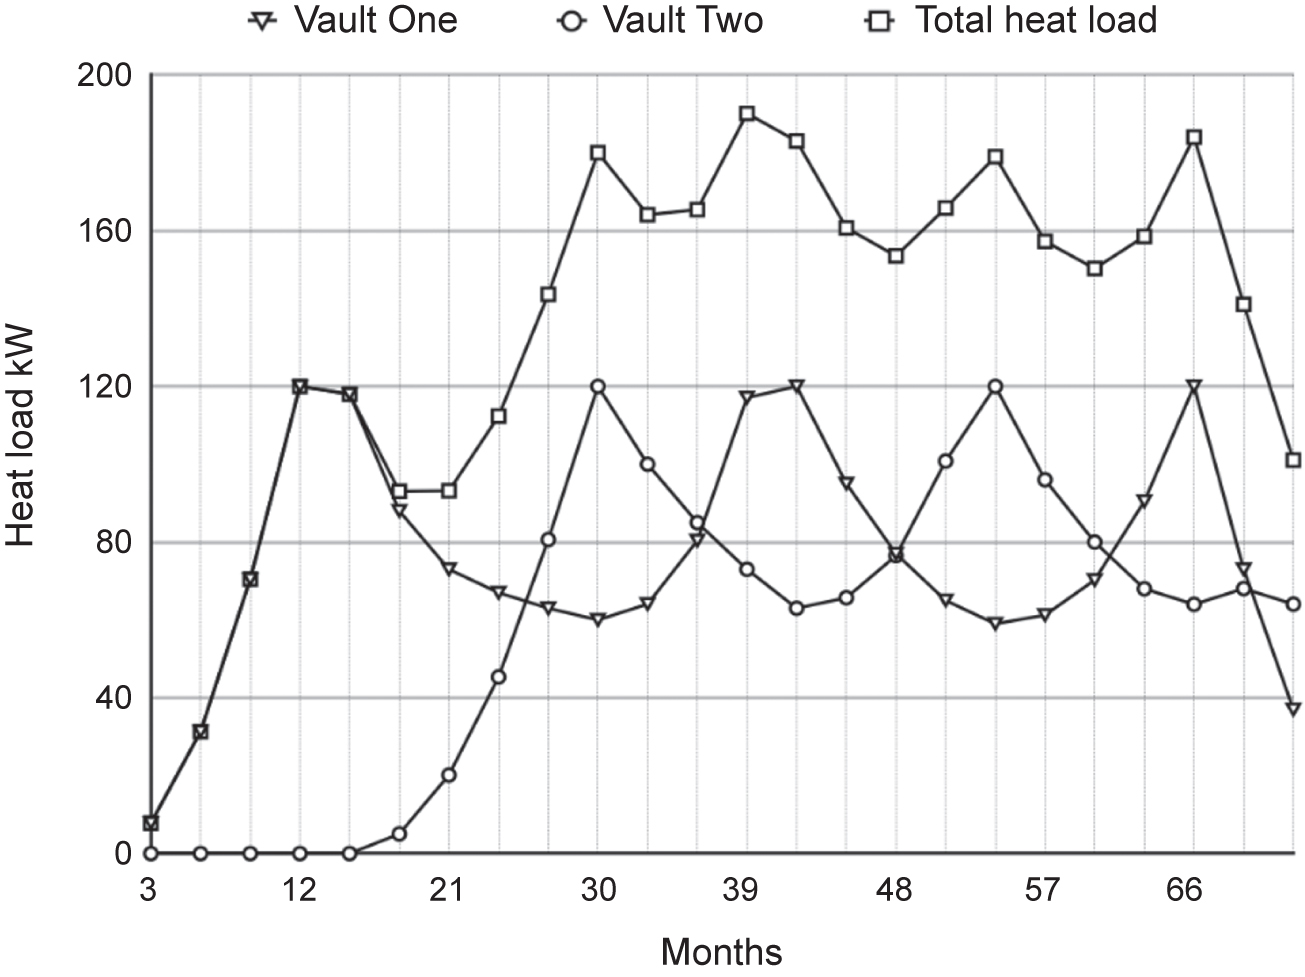
The ML clearly demonstrated with the first few sets of results that the proposed store would overheat within a short period of time and that it would take 6–12 months for it to cool to a point where further filling was an option. Engineers quickly realised that they could modify the layout of the store and provide two vaults, each with their own natural cooling. The final report showed how a single building store with two vaults could be used to accept all of the products it needed to. One vault would be filled to its heat loading limit and then the second vault would begin to be filled. While the second vault was filling, the first vault was cooling and the heat load reducing. When the second vault reached its limit, the filling reverted back to the first vault and so on.
The report included one graph within it to visualise the results. An example of the type of graph is shown schematically in Figure 8.1 (these are not the actual results from this project). We can see that Vault One hits its limit and then cools while Vault Two is loaded. Vault Two hits its limit and then Vault One is loaded again and so on. There are about four swaps from loading one vault to the other.
The review panel and engineering team were very happy with the report; it saved them having to construct two stores, and minimised the modifications to the design of the existing stores.
8.1.8 Where’s the learning from experience?
On this project the team learned something from domain experts and then constructed a ML project that was simple enough to run with existing hardware to solve it. Human learning started at the beginning of the project and didn’t stop until the report had been signed off and accepted, and the human learning both before and during the project was used to avoid an overly complex ML project. The ML was used to learn from data about the products being placed in the store. It gave insight so the team could predict the heat loading in the store and how that store would cool over time. The ML took away the monotonous and tedious calculations, leaving the humans to concentrate on the higher value aspects of the project. It also increased the accuracy of the calculations.
Figure 8.1 Store’s heat load: Vault One and Vault Two
Once the ML had given a better understanding of the product data, engineers were able to make slight modifications to the storage design and reduce the total number of buildings needed, thus reducing their footprint and saving time and cost.
At the core of this ML project were the domain experts who gave the heuristics and assumptions necessary to simplify the problem. The engineers could focus on two fundamental ML problems:
- Understanding the rate at which each type of product arrived at the store.
- Modelling the decay of heat generation of the products in the store.
It would have been easy to build a more sophisticated ML project, but that would have been likely to hit a combinatorial explosion requiring more computing power than was available.
8.2 THE WEATHER – CONCENTRATION ON DATA PREPARATION
In 2020 the European Centre for Medium Range Weather Forecasts (ECMWF) had the computing power and human resources (one of Europe’s largest supercomputers and a few hundred dedicated and talented scientists, engineers and mathematicians) to produce weather forecasts ranging from 15 to 365 days ahead.82 The UK Met Office has a similar make up.83 The knowledge base required to simulate the weather and climate requires the physical processes to be represented mathematically and solved numerically plus the knowledge of how to build the hardware to do the heavy lifting!
Both the ECMWF and the UK Met Office have to model a complex system with limited computational resources; current models of the weather have a resolution of 10km, plus both organisations monitor and obtain data from numerous weather stations and other facilities worldwide. Supercomputers are not powerful enough to process the simulations and data in a timely fashion – the sensors are not coupled together, so data does not arrive in an ordered way. The majority of the data that simulations produce is simply deleted because they cannot be stored, so it is impossible to simulate exactly the fluid movement, heat transfer, electromagnetics, chemistry and so on. To get around this forecasters have to build models and capture data from weather observations. They need to build models that capture the non-linear and random nature of the Earth’s atmosphere that can be used in simplified simulations. Not only that, they have to analyse and process more data than could ever be understood by humans in many lifetimes – and within hours, not days. They need machines to help – this is not a nicety, it is an emphatic necessity!
In this case study we are going to look at the modelling of the turbulent fluid mechanics in our atmosphere and, in particular, whether we can simplify the modelling of it. By this we mean: can we build a simple model and use less computing resource? We will always have limited machine resources. The study draws on a paper by Professor George Batchelor in 1969 where a hypothesis about turbulence was tested on a computer.84 This is an early example of machine learning in science. The hypothesis is still at the core of atmospheric fluid modelling.
8.2.1 Is this a ML or AI project?
Our brief introduction to weather modelling may have given away the answer to this question. Weather forecasting is an AI project because it uses a combination of sensor, simulation and learning from experience. ML also plays a large role in weather forecasting, though, often, lots of weather predictions are combined to build statistical understanding of the forecasts.
8.2.2 Turbulence – Leonardo da Vinci to the Red Spot on Jupiter
In this case study, the domain experts followed the same methodology as Batchelor and his postgraduate research student had used in 1969 and, around 2000, did this work again, this time generating gigabytes of data to test a hypothesis (albeit a different one), just as Batchelor had, but using one of the most powerful computers in the world. The case study is an example of using machines to do research in one of the most challenging areas of research, that of turbulent fluid flow.
Leonardo da Vinci drew sketches of the vortices generated at the bottom of a water outlet some 400 years ago. This is often used as the starting point in studies of turbulence. After 400 years we have moved further forward in our understanding, but we still require a strong and dedicated research effort to do so. Turbulence is complicated because it is random (statistical), enhances mixing, has vorticity and is non-linear. If you want to improve the mixing of cream into a cup of coffee, you stir it up and introduce some turbulence. Turbulence is ideal for chemical engineers stirring a reacting tank, but unnerving for us when we are on a flight.
If we travel on an aircraft we feel turbulence; it’s powerful. The physics of turbulence are complex, highly mathematical and studied in every university. To an engineer, it is useful for mixing or maximising the flow in a pipe, but this often comes at a price – it takes energy to do it. What this means is that kinetic energy from the main body of the flow is passed down to become heat at the molecular level. Turbulence is really good at this and we call it the inertial cascade.
An example is the best way to show this. Figure 8.2 shows Niagara Falls, on the border between the United States and Canada. Approximately 675,000 gallons per second, or about 2,547,486kg per second, of water falls 51 metres. At the base is a bowl, and the water hits the bowl at about 71mph or 31.6m/s. By the time it leaves the bowl, the potential energy that was transferred to kinetic energy has been dissipated and is now heat. It is this mechanism that was first sketched by Leonardo da Vinci, and what we see are eddies, large vortices mixing, interacting with each other and being stretched. The stretching causes them to spin quicker and the internal rubbing (or friction) of the water turns kinetic energy into heat. This is a very simplified description of turbulence. It happens very quickly.
Figure 8.2 Niagara Falls – the turbulence here dissipates enough energy to power an area the size of north Wales (reproduced from https://commons.wikimedia.org/wiki/File:Niagara_Falls_Canada_NARA-68145149.jpg under Wikimedia Commons licence)

Figure 8.3 shows an image from NASA of the movement of the oceans. Something we observe in the atmosphere and oceans of planets is that large structures persist; there is something about the atmosphere and oceans that stops the inertial cascade from happening. The famous example is the Red Spot on Jupiter; there’s also the Blue Spot on Neptune and the Earth has its own polar vortices as well. The atmosphere of the Earth is like a soap film: it is very thin and promotes the fluid only moving in two directions. This limits, in fact eliminates, the vortex stretching we described in the Niagara Falls example. Also, because the Earth is spinning, and the atmosphere and oceans are stratified, this also promotes movement of fluid in two directions. We call fluid that can only move in two directions two-dimensional fluid flow or two-dimensional turbulence. It allows large-scale structures to form and persist for long periods of time.
In 1969 George Batchelor wrote a paper for The Physics of Fluids journal proposing to test a hypothesis about the energy spectrum in two-dimensional turbulence using a computer program.84 This is a ML problem from more than 50 years ago. He asked a postgraduate student to write computer code to generate the statistical data – ML was being used within the scientific method to do world-class, leading-edge research. These techniques are being used today on the world’s fastest supercomputers. The work aims to understand physics that would be impossible to understand experimentally because of physical limitations or costs. It is an amazing example of where ML is doing the heavy lifting while the domain experts, in this case academics, are testing their hypotheses.
Figure 8.3 The movement of the Earth’s oceans (NASA’s Goddard Space Flight Center, https://svs.gsfc.nasa.gov/10841)

How can we simplify this complex problem and somehow generate data to analyse? The approach uses vector calculus equations, rewritten using linear algebra so we can solve the equations using high-performance computing. The vector calculus equation is
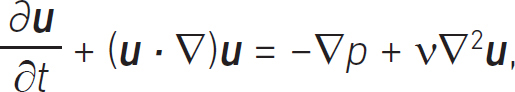
where u is a vector describing the velocity of the fluid, p is a scalar describing the pressure and the Greek letter, υ, is the kinematic viscosity. Letters in bold are vectors and letters in italic typeface are scalars. This the simplest model of fluid flow we can use. In fact, we also had to make the assumption that the fluid is a uniform density and also that it can’t be compressed. Vector calculus is short-hand notation, so we can work on the three dimensions without expanding out each term. If we expand the above equation we would have more than 20 terms to deal with. This makes the two-dimensional simplification appealing. With some algebra this equation can be written out in a form that can be solved on a computer – these equations are written such that they can be solved using linear algebra software libraries. Here, we only need to know how the domain experts generate the data we will analyse. In this case, the domain experts, working in 2000, followed the same methodology as Batchelor and his postgraduate research student to generate gigabytes of data.
8.2.3 Too many data to analyse without a machine
It took about 24 months for the domain experts to generate the data; this included building the simulation, running the simulations and writing the software. Visualisation of the data played a pivotal role in the human learning. After all, the hypothesis is developed by the humans for the humans to test.
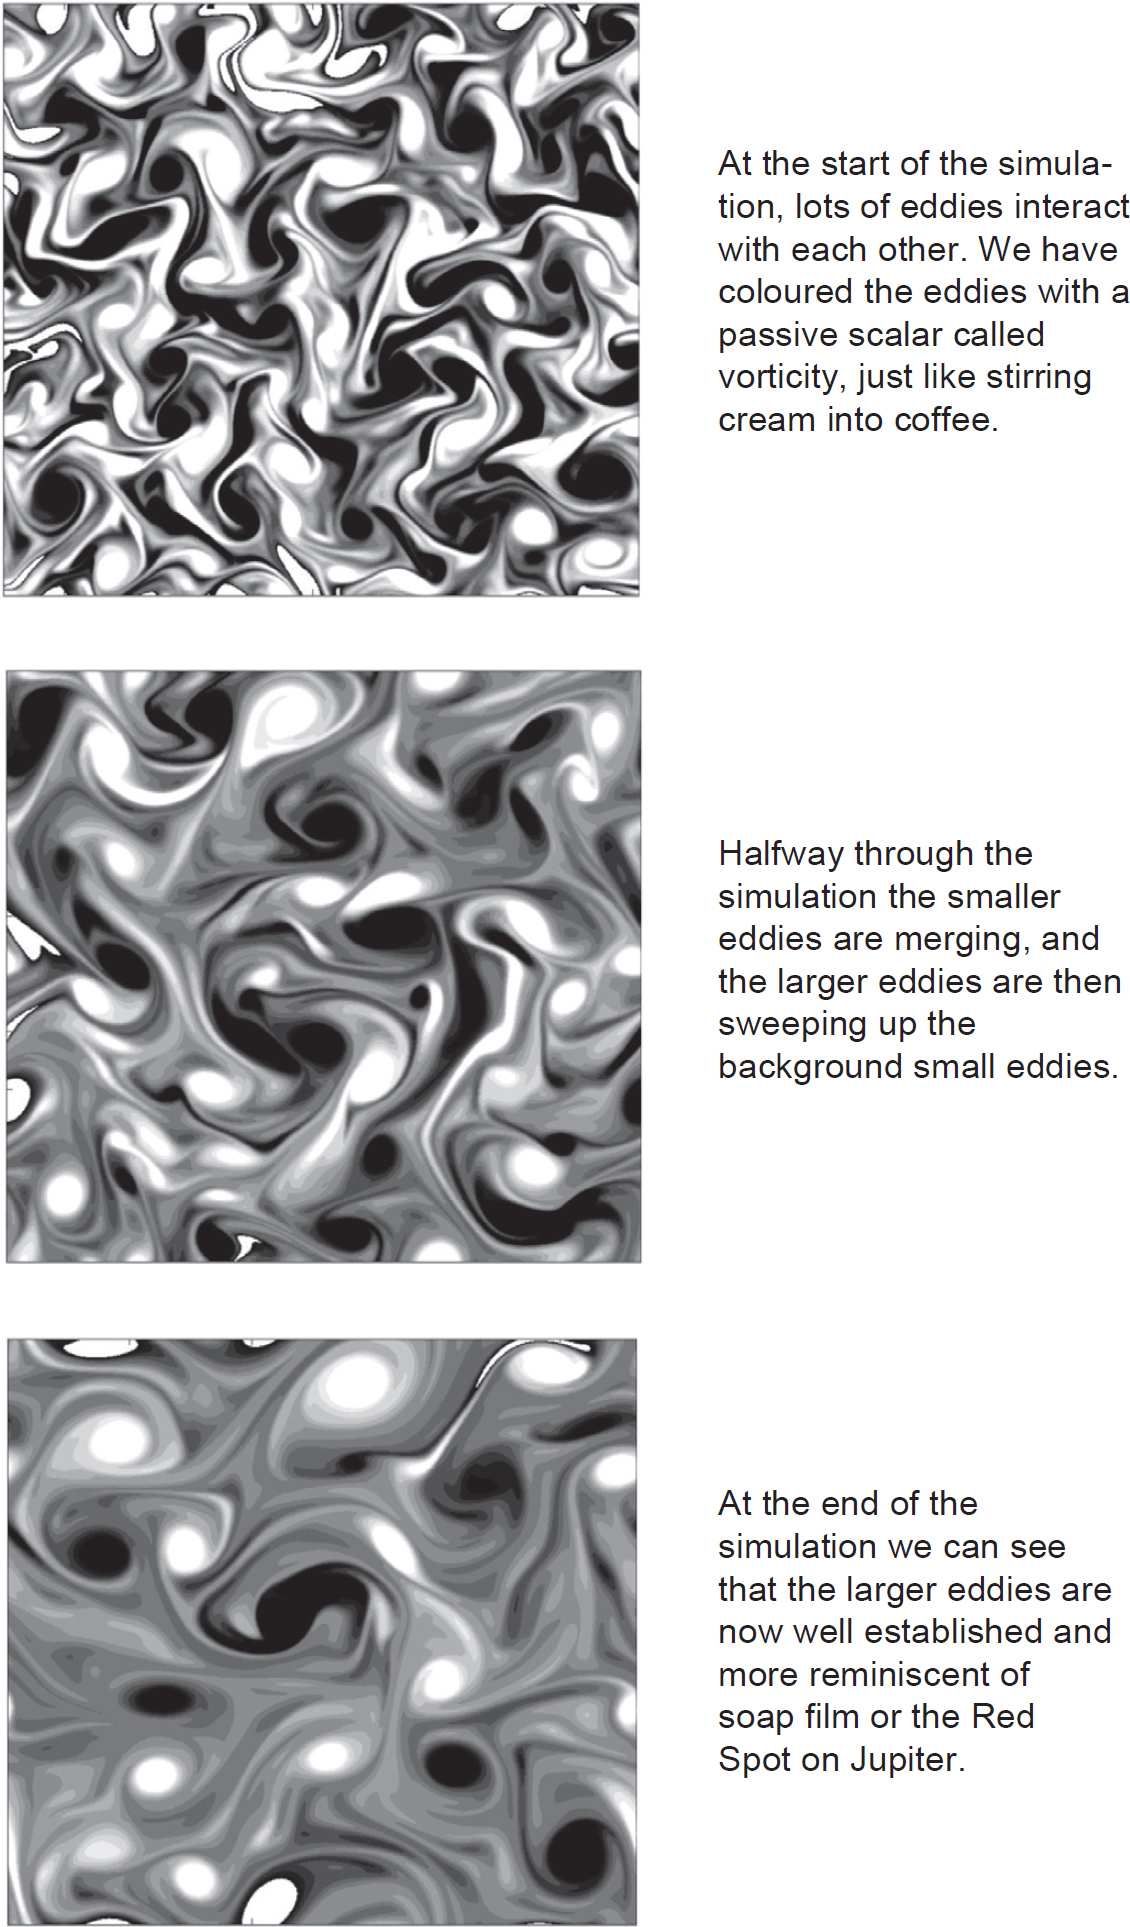
At its fundamental core, turbulence is a subject that requires a statistical understanding and therefore we need lots of data. The thesis asked the question: How many energy containing eddies do we need in our simulations to represent turbulence well? The supercomputer was used for days at a time, generating hundreds of eddies and letting them merge and interact with each until, after a long time, they had merged into a few large eddies, similar to the ones on Jupiter or the Earth’s polar vortices. Figure 8.4 shows a visualisation of one of the simulations. The large data set is visualised using a passive scaler called vorticity to pick out the vortices in the flow. It easier to think of this as watching cream being stirred into coffee. The figure shows the initial, intermediate and final stage of the simulation; and you can see large eddies form, suggesting the energy is accumulating in the large scales.
If energy does not cascade down to the smaller scales, where does it go? Well, it is passed up the scales to form larger eddies. Turbulence theory tries to predict this. It asks questions such as: How will the energy be distributed? How will the velocities in the eddies be correlated? Will the flow conserve angular momentum? Humans built these hypotheses so that we can have simple analytical models of turbulence, heuristics or rules of thumb. The simulations generated huge quantities of data so that we have the scientific information to test our hypothesis. You can see the big picture here: ML is helping us build our hypotheses. The data we need to do this are so vast that we can only use a computer to do it.
Figure 8.4 The visualisation of a large data set from a simulation of turbulence that is found in the Earth’s atmosphere or a soap film
Even with a very powerful supercomputer, we still need to be careful. The simulations are generating terabytes of data. Storage limitations mean that we cannot store it all. In this project only a small fraction of the data could be sampled – well below 0.001 per cent – and, even then, the amount of data were so big that only a machine could analyse them. At each stage of the project we need to follow the scientific method. If we get our hypothesis correct, simple and elegant models could be built that allow humans to understand complex phenomenon such as the weather.
As Stuart Russell and Peter Norvig tell us, AI is a universal subject that can help everyone.9 Machines can help us to understand long-standing and hard questions about complex systems; and we mustn’t overlook the fact that visualisation of results, taking vast amounts of data and putting them into a form that humans can use, is a very important skill for an AI practitioner to have.
8.3 A CAMBRIDGE SPIN-OUT START-UP
In the first two case studies we have seen two problems where we’ve been able to organise a system into a learning-from-experience problem that computers can help us with. These are, of course, narrow AI problems focused on data analysis. Please don’t think that these problems are simple. Far from it. The heuristics and physical understanding of the underlying physics takes dedicated domain experts with decades of experience.
Optalysys are a unique company that spun out of the University of Cambridge Department of Engineering. Their founder had the vision to build a high-tech business in his home town of Wakefield, West Yorkshire, creating high quality jobs and opportunity there. The company are pioneering a new approach to the way we think about representing mathematical operations on machines. Mechanical machines have been overtaken and enhanced by digital computation and now technologies such as optical and quantum computing are enhancing our efforts further. Rather than fitting the mathematical operations to a binary digital computer, Optalysys have gone back to basics and are building machines that do the mathematical operations on dedicated machines.
As Optalysys are an ethical purpose AI company, we should see sustainability at its core. Sustainability encourages us to build a balanced company from the pillars of economic, environmental and social metrics. It almost goes without saying that increasing supercomputing capabilities will undoubtedly be a success in financial terms, but where are the environmental and social metrics?
An example of their economic progress is the growth of the company into a double-digit high-tech employer, and being sited in Wakefield, part of the UK’s northern powerhouse, would seem to be in line with some good social metrics. The work they do is the engineering of AI hardware; their team is made up of engineers, scientists, physicists and mathematicians. The company has sponsored two PhDs and funded large sums of money in fundamental research. Sustainability probably seems like a lot of fuss when there are significant financial challenges; we’ll talk about funding later. You will see that Optalysys understood from an early stage that the sustainability metrics are a good way to sell their business when raising funds: sustainability is not a quirky subject about feeling good but really challenges us to think about our core values and what we are truly achieving.
The environment metrics fit into the product Optalysys are engineering. There are numerous mathematical operations that their technology can undertake. The one that’s useful in AI is the convolution operation. In the convolution of an image, say, with N pixels in each direction, we would need roughly N2(1+logN) floating point operations on a typical CPU. Optalysys’s technology can do this in roughly one operation. Now this seems impressive, and it is, but the power required to do this operation optically is several orders of magnitude less than a CPU or GPU. So, we now have the environmental metrics: it uses significantly less energy. If, and it’s a big if, Optalysys get their technology right, we can reduce the energy consumption of convolution NN training drastically. It’s not hard to imagine having today’s equivalent of a supercomputer in your smart watch!
8.3.1 What does this technology look like?
Optalysys are combining two techniques, taking advantage of digital computational and analogue computational hardware. In doing so, they tune the hardware to the type of mathematical operation they want to perform. This is a powerful concept. Remember, in order for a supercomputer to solve an equation we have to write it in a way our hardware can do the mathematical operations. It‘s kind of fitting a round peg into a square hole. The peg fits, but it doesn’t quite fill the hole and so spins. When we use computers that use CPUs or GPUs, the processing units rely on discrete sampling of a picture, say, usually on a regular grid or lattice. We then have to undertake lots of calculations at each grid point to obtain quantities like derivatives or integrals. Errors cause us lots of problems and making sure we conserve quantities such as energy or other invariants is easier said than done. If our data don’t fit nicely onto a regular grid or lattice, our problems worsen. If our grid is too coarse, then we will not have enough resolution to capture the details we need. If our resolution is too fine, then we will be doing lots of unnecessary calculations. A digital computer may not be the best way to do every mathematical operation that we need. Optical processing can help!
The convolution is a mathematical operation that is an intensive operation on a GPU or CPU. When done using optics or lenses, this operation is performed at the speed of light and at the resolution of the images it is convolving. So, the intensive operation, which is often simplified in a convolution NN that uses GPUs or CPUs, can be done using much less energy, at almost any resolution and at the speed of light. They still have to get the data to and from the processor, but you can see it has some pretty spectacular capability. What is amazing is that the optical processor doesn’t need more operations as the resolution increases. If you present the system with a coarse resolution image or an ultra-fine super-high definition image, it uses the same system to do the convolution, whereas a CPU or GPU would need to scale the number of operations with the resolution of the image.
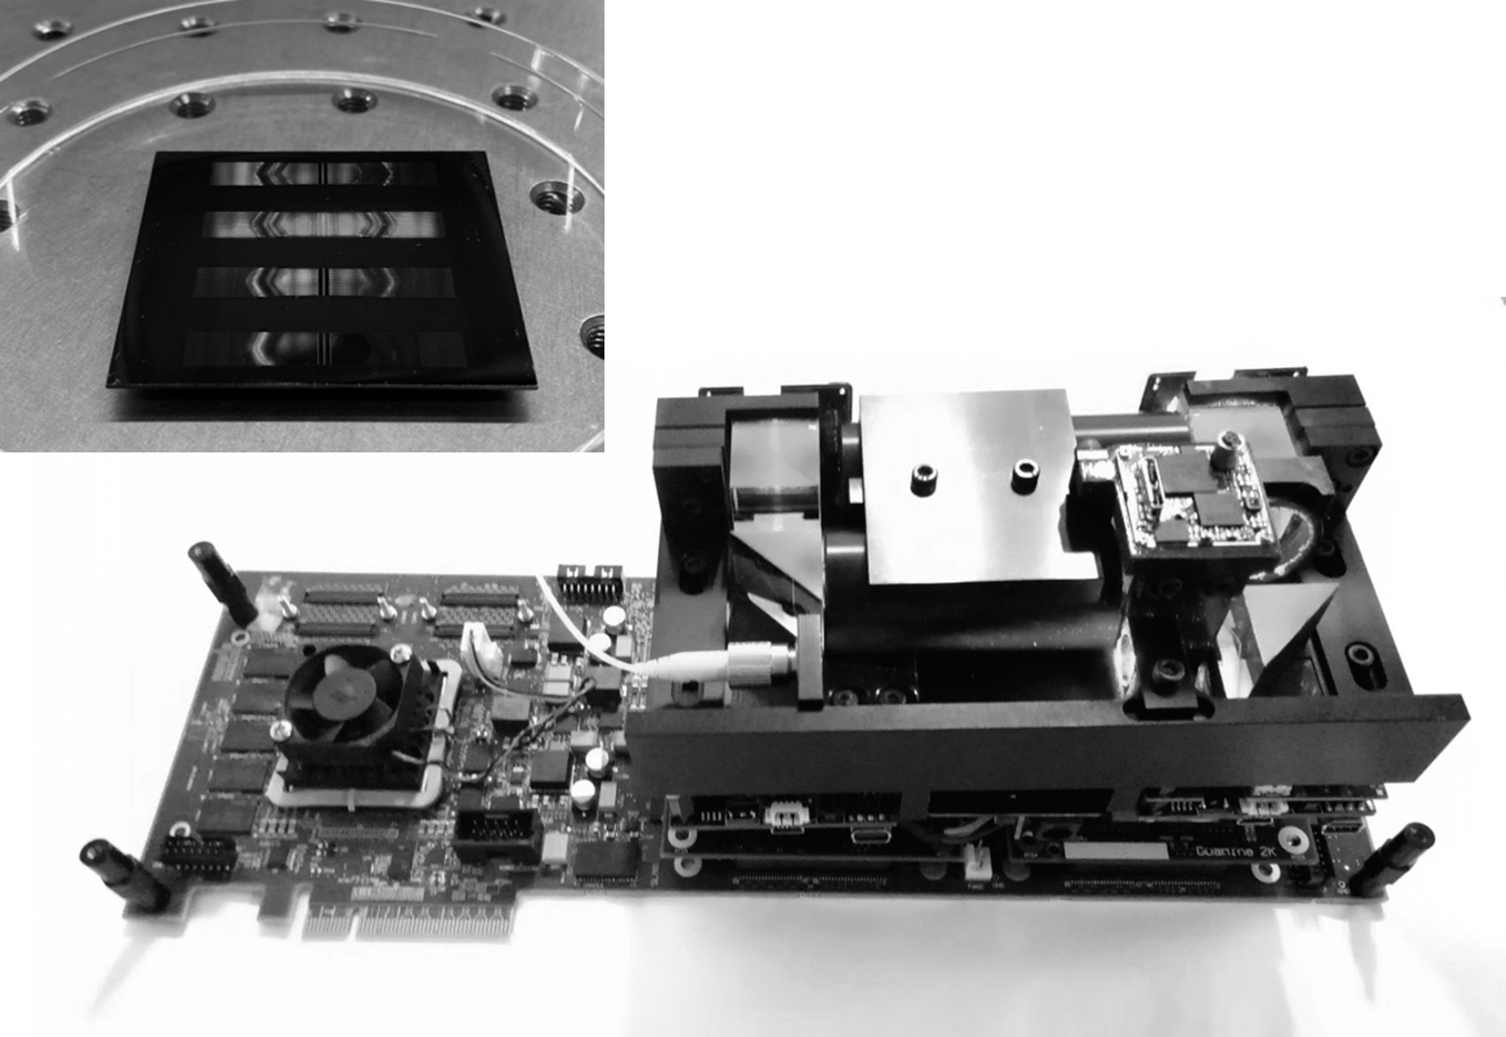
The first system Optalysys built was the mathematical derivative operator; Figure 8.5 is a photograph of that first ‘moulding clay and sticky tape’ prototype. Figure 8.6 shows the latest prototype using state of the art engineering techniques to manufacture an optical system that can fit inside a typical personal computer case. The next generation is chip sized (see the thumbnail in Figure 8.6); it is only 32mm × 32mm. The company has worked really hard to take the 250kg optical bed and over one metre-long prototype optical system down to a 32mm square wafer you can easily hold in your hand!
There is still a lot of work to do. The progress is impressive and interest from around the world is really encouraging. Their approach is brave; they aren’t rebadging algorithms that have been around for years as AI. This could be a revolution in the way we think about engineering our thinking machines. There is always the possibility of the celestial spanner in the works, but the risks appear to be worth it. Only time will tell.
Figure 8.5 Optalysys’s first optical mathematical operation was the derivative; the first prototype was built on a 250kg optical bed and was over a metre in length

Figure 8.6 Optalysys’s first commercial optical AI processor – FT:X Optical co-processor system with PCIe drive electronics. It fits onto a standard PCI card about 100mm wide by 300mm long. The thumbnail, top left, is the next generation of AI processor and measures 32mm × 32mm
8.3.2 Where’s the money?
You walk out of a world-class university, hopefully with minimal debt, and have a vision of what your company will look like. Day Two, you realise you need an office, a computer, investors, a bank account, customers, a product. This is not as easy as it sounds, and starts to feel a little daunting. Luckily, Cambridge Correlators (Optalsys were previous called Cambridge Correlators Ltd) had a simple product they could sell at a good price, and their academic background gave them some traction in selling correlators to universities and research organisations. Even large high-tech engineering companies bought them. Investors were already aware of Cambridge Correlators and provided early funding. Grants from local growth hubs gave them access to a nice office and work area. In fact, one grant allowed them to take on their first high-tech graduate.
In the early days it felt like Cambridge Correlators had the solution to an unknown problem. Some possibilities, but the huge inertia of only having early university research at TRL1 or 2 proved to be a significant challenge. The search was on to find ‘the problem’ so they could build a product to solve it. Conversation after conversation was held with numerous potential customers. The penny eventually dropped that optical technology was actually making working in Fourier or real-space really easy, moving from one space to another at the speed of light. There’s more: whole fields can be manipulated to give us access to quantities like derivatives and, not only that, but to combine and manipulate whole fields at the same time in one operation, which is important for AI correlations, convolutions or non-local operators. This glimmer of light (forgive the pun) was enough to allow Cambridge Correlators to transmogrify into Optalysys. They could attack big supercomputing problems such as genetics, modelling the weather, solving equations and, eventually, AI. It took a lot of effort to recognise their own DNA – optical engineering of machines that could effortlessly undertake mathematical operations. Remember, with AI, domain experts need the AI to help them with their heavy lifting. They weren’t finding problems; they were making it easy for domain experts to solve their problems. Once they had cracked the DNA of their business, they started writing proposal after proposal. Funding started to come, and the fun of managing cashflow began.
Investors have worked closely with the management team to smooth out the peaks and troughs in cashflow. It is not easy finding investors, especially ones who are patient. The timeline of Optalysys is decades, and this shows how long it has taken to get Optalysys up and running. In the early days a lack of cash could make an opportunity vulnerable. The credibility of Optalysys’s use of the scientific method helped in obtaining high integrity grants from worldwide funding bodies. It is what has made this company the unique and inspiring story it is today. The investors have stuck to this principle and not deviated or been fooled by moves towards quick fix whimsical funding opportunities. The scientific method is at the heart of AI technology. They have embraced the machines needed for the next generation of AI systems.
8.4 SUMMARY
These case studies have given us more explicit understanding of the breadth of AI and what is really involved in a project of this nature.