
INTRODUCTION
The development of business analysis as a professional discipline has extended the role and responsibilities of the business analyst (BA). Increasingly, BAs are engaged early in the business change lifecycle. They collaborate with a range of different stakeholders and other roles to investigate ideas and problems, formulate options and produce business cases setting out their conclusions and recommendations. As a result, in project-driven change environments, this initial analysis work will often precede the initiation of a formal project and the assignment of a project manager.
The early engagement of BAs places a critical responsibility upon them: the need to ensure that all business changes are in line with the vision, mission, objectives and strategy of the organisation. This business context is the key foundation for understanding and evaluating all ideas, proposals, issues and problems put forward. While few BAs are directly involved in analysing and developing organisational strategy, it is vital that they know about the strategy of their organisation so that they can conduct their work with a view to supporting its implementation and the achievement of the business objectives. Therefore, it could be argued that BAs have responsibility for the following areas:
- Identifying the tactical options that will address a given situation and will support the delivery of the business strategy.
- Defining the tactics that will enable the organisation to achieve its strategy.
- Supporting the implementation and operation of those tactics.
- Redefining the tactics after implementation to take account of business changes and to ensure continuing alignment with business objectives.
- Maintaining an awareness of the external business environment.
- Working with other stakeholders such as product managers and product owners to develop the medium- and long-term strategy for a product or service and aligning this with the broader organisational strategy.
Given the increasing emphasis on early-engagement business analysis, and the need for this work to align with the business strategy and objectives, an understanding of strategic analysis techniques is essential across all of the business analysis services in the BA Service Framework (BASF).
This chapter describes a range of techniques for carrying out strategic analysis and definition, plus techniques to monitor ongoing performance. The following four areas are covered:
- strategy analysis, including external environment and internal capability;
- strategy definition;
- strategy implementation;
- performance measurement.
External environment analysis (Techniques 1–2)
Organisations must assess and address changes that have arisen, or can be predicted to arise, within their operating business environment. Such changes occur constantly, and any organisation that fails to identify and respond to them runs the risk of encountering business problems or even the failure of the entire enterprise. Senior management should carry out regular monitoring of the business environment in order to identify any influences that may require action.
The techniques covered in this section are:
- PESTLE analysis;
- Porter’s five forces analysis.
Internal environment analysis (Techniques 3–6)
These techniques are used to analyse the internal capability of an organisation to gain insights into its areas of strength and its inherent weaknesses, and to identify possible strategic approaches available to the organisation.
The techniques covered in this section are:
- Ansoff’s matrix;
- growth share matrix;
- resource audit;
- VMOST analysis.
Strategy analysis (Techniques 7–11)
During strategy definition, the results of the external and internal environmental analyses are summarised and consolidated in order to examine the situation facing the organisation and identify possible courses of action. When defining the business strategy, the factors outside the management’s control are examined within the context of the organisation and its resources.
The techniques covered in this section are:
- business model canvas;
- cultural web;
- business capability model;
- information concepts model;
- SWOT analysis.
Performance measurement (Techniques 12–14)
All organisations need to monitor performance. This section explains three techniques used to identify performance measures and carry out the performance evaluation.
The techniques covered in this section are:
- balanced scorecard;
- critical success factors;
- key performance indicators.
EXTERNAL ENVIRONMENT ANALYSIS
Technique 1: PESTLE analysis
Variants/aliases
Variants: PEST (political, economic, socio-cultural, technological); STEEPLE (socio-cultural, technological, environmental (or ecological), economic, political, legal, ethical).
Alias: PESTEL (political, economic, socio-cultural, technological, environmental (or ecological), legal).
Description of the technique
PESTLE analysis provides a framework for investigating and analysing the external environment for an organisation. The framework identifies six key areas that should be considered when attempting to identify the sources of change. These six areas are shown in Table 1.1.
Using PESTLE analysis
The PESTLE analysis technique is usually used in a meeting or workshop where a variety of ideas and opinions can be sought. Representatives from a range of functions should be present so that they can provide specialist information. For example, legal representatives would be able to provide information about changes to relevant laws and regulations. It is a good idea for departmental representatives to research any aspects that may impact the organisation prior to carrying out a PESTLE analysis. This could involve obtaining reports from research providers such as Dun & Bradstreet or Gartner.
The PESTLE technique is straightforward to use. Typically, each element is considered in turn and any potential issues for that area documented. Once all of the elements have been considered, the factors listed are evaluated in order to identify those most likely to affect the organisation. This results in a list of key external influences that could cause it to take action – either to gain from an opportunity that appears to be present or to ensure that any threats are avoided.
Two criteria need to be applied when using the PESTLE technique to identify relevant factors for the organisation: first, the factors are external to the organisation and should be outside its sphere of control; second, there must be a possibility that the factors may impact upon the organisation.
A common error when using PESTLE is to identify a potential course of action for the organisation rather than highlight an external factor that is likely to have an impact upon it. These external factors are shown as opportunities and threats in a SWOT analysis (Technique 11), so when using PESTLE the focus should be on identifying external factors and not on deciding what to do about them. That analysis comes later. For example, in a retail enterprise the following might be identified:
- Environmental factors concerning the use of plastic wrapping on fresh food items threaten to damage the market perception of the company, and thus constitute a threat to the business. This would be included in a SWOT analysis.
- Having ‘plastic free aisles’ where fresh foods are available unwrapped is a possible response to the threat. This is neither an opportunity nor a threat and would not be included in a SWOT analysis.
There is a critical difference between an external factor that may affect the organisation and the possible courses of action that may be taken in response to the factor. Moving from a threat to a quick solution is not effective strategic analysis and could lead to simplistic, ineffective solutions.
The objective when using PESTLE is to identify factors that could affect the organisation. Therefore, it is of little benefit to spend time considering whether a government initiative should be filed under ‘political’ or if ‘legal’ would be preferable. The technique is invaluable in identifying factors to be considered and to be dealt with by taking action. The categorisation of these factors has little, if any, value.
Although the technique is usually seen as one where the external environment is considered, PESTLE may also be used to analyse influences operating within an organisation. This situation arises where issues or ideas concerning a particular function or department are under examination. An analysis of the external factors that may impact upon that department can help in a number of ways, from clarifying reasons for change to identifying options. For example, if a PESTLE analysis is carried out for the human resources (HR) department, there may be factors within the wider organisation that fit the two criteria – they are outside the department’s control and are likely to impact upon its work. There may have been poor company results resulting in a recommendation to senior management from the finance department that recruitment and training should cease for a six-month period. This decision will affect the work, but is outside the control of the HR department. Therefore, it is an external factor to the department but an internal factor to the business as a whole.
Technique 2: Porter’s five forces analysis
Variants/aliases
None.
Description of the technique
Porter’s five forces analysis is also used to consider the external business environment, but it has a different focus from that of PESTLE. This technique examines competition within the business domain or industry within which an organisation operates and identifies the business pressures that it may face. The analysis, derived from using the five forces framework, is usually applied to a suite of products or services delivered by an enterprise.
Michael Porter divided the potential sources of competitive pressures within an industry into five categories. These categories and the factors to consider in each case are described in Table 1.2.
The answers to these questions help to identify the factors within the industry or business domain that have the potential to impact upon the organisation, either positively or negatively.
Using Porter’s five forces analysis
The first step in using this technique is to decide which industry or business domain the organisation operates within; this is a key decision when using the technique as the results may vary considerably depending on the industry at the heart of the analysis. For example, the industry in which a company selling expensive handbags operates may be considered from two points of view:
Table 1.2 Porter’s five forces
Category | Factors to consider |
Industry competitors | What is the level of competition for the products or services in this industry? Is the organisation in a good competitive position or is it a minor player? Are there several competitors that hold the power in the industry? |
Potential entrants | Are there barriers to entry, such as the need for large amounts of money or expertise? Is it possible to start up an organisation offering these products or services without much financial support? What is the likelihood of new entrants coming into the industry? |
Substitutes | What is the range of substitutes available? What is the position of the organisation when compared to the suppliers of these substitutes? |
Buyers | How much choice do buyers have? Can they switch suppliers easily? Do they have the power in the relationship or are they locked into the supplier? |
Suppliers | How many suppliers are available? Is this a competitive situation where the organisation has a choice of suppliers? Do the suppliers have the power in the relationship because they operate in an area of limited supply? |
- The company could be considered to operate in the business of designing, marketing and selling handbags. In this case, the competitors are the other handbag companies, and the substitute products would include other products used to carry personal items – such as rucksacks and even plastic carrier bags. The industry is limited to products of a particular nature: bags.
- The company could be considered to operate in the business of providing luxury giftware. In this case the competitors still include the other handbag companies, but they also include companies selling other luxury goods such as perfume and jewellery. The list of substitutes could extend to glassware or even donations to charity. Examined this way, the industry is much larger, the potential market greater and the range of pressures that may impact upon the company more extensive.
Once the industry has been decided upon, the five categories are examined to identify the pressures that exist between the organisation and each of them. Table 1.3 gives some examples of these.
The answers to these questions help to identify the factors that have the potential to impact upon the organisation either positively or negatively. In this example, there may be pressures, or threats, from competitors and new entrants, whereas the relationships with the buyers and the suppliers are in the company’s favour – these present opportunities.
Table 1.3 Factors to consider when applying Porter’s five forces analysis
Category | Example |
Industry competitors | This is an examination of the other companies operating within the industry and the level of competition between them. Does our handbag company hold a powerful position or is it a minor player that is vulnerable to competitive moves? |
Potential entrants | Could organisations operating in other, similar industries move into this area? For example, could an existing fashion company decide to develop a range of designer handbags? How great are the barriers to entry into this industry, and do they deter potential entrants? |
Substitutes | What business pressures may arise from possible substitute products such as rucksacks? |
Buyers | This could be an interesting area to explore for the handbag industry, as some high-quality manufacturers restrict the sales outlets for their products and minimise the opportunities for buyers to shop around and compare prices. If this is a particularly desirable brand, the power of the buyer could be extremely limited. |
Suppliers | Again, this could be an interesting aspect because luxury brands tend to be exclusive and hold a lot of power over their suppliers. |
Five forces analysis requires knowledge about the industry and the different organisations or individuals that participate in its work. Areas such as substitute products can be difficult to analyse, and possible substitutes can be missed. At one time some industries had high barriers to entry because of the financial requirements, so new entrants were considered unlikely. However, the rise of businesses with access to significant funds, such as the major supermarkets, has meant that high financial requirements may not deter new entrants. Other industries with traditional high barriers to entry have seen these reduce with the increase of online technologies and platforms. A boutique clothing retailer would once have needed a bricks-and-mortar shop and would need to invest heavily in advertising; now they might not even need a website (let alone a physical shop) if they sell their clothes on an auction site or other platform.
INTERNAL ENVIRONMENT ANALYSIS
It is helpful to use a combination of techniques when analysing an organisation’s internal capability, since relying on a single technique would provide only limited information. Using a combination of the VMOST and resource audit techniques that are described in this section, with possibly the growth share matrix also, helps to provide a detailed picture of the areas where there is strong capability and those where there are weaknesses.
These techniques help the BA to identify areas that are strengths the organisation can harness, and those that are weaknesses that could undermine it. These strengths and weaknesses can later be combined with the opportunities and threats already described to build a SWOT analysis (Technique 11) for the organisation. Ansoff’s matrix (Technique 3) can help to determine possible strategic responses to strengths and weaknesses.
Variants/aliases
Aliases: Ansoff’s Box; Ansoff Product and market growth matrix.
Description of the technique
Ansoff’s matrix provides a set of strategic alternatives that may be considered by organisations when defining their business strategy. The box shown in Figure 1.1 maps new and existing markets against new and existing products, creating a 2 × 2 matrix.
Figure 1.1 Ansoff’s matrix (Source: Ansoff 1987)
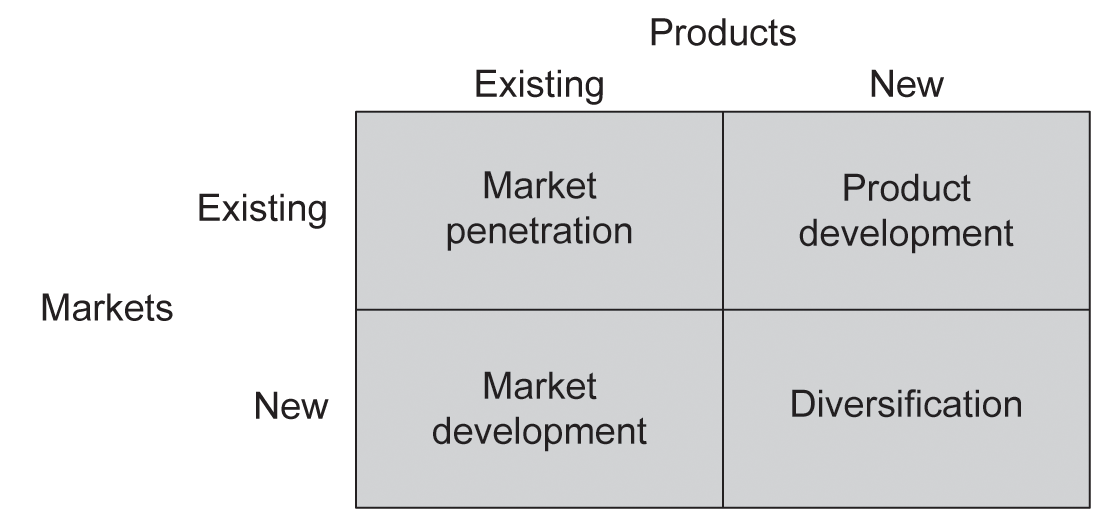
Four quadrants are created, as described in Table 1.4.
Table 1.4 Ansoff’s matrix
Quadrant | Description |
Market penetration | This situation is where existing markets are targeted for greater penetration by existing products. In this approach, organisations decide to continue with their existing products and markets but to adopt tactics such as additional promotion, increased sales efforts or revised pricing approaches in order to generate increased market share. |
Market development | In this situation the organisation adopts a strategy of exploring other markets for its products. This may mean targeting new markets in other countries or applying the products to different markets within the existing geographical areas of operation. |
Product development | This strategy involves developing new products or services, and targeting existing markets. Another approach to it would be to add further, related features to existing products and services. |
Diversification | The most radical strategic alternative is to develop new products or services and target new markets. This is a risky strategy to adopt since it does not use existing expertise or leverage the current customer base. |
Once a SWOT analysis (Technique 11) has been completed it is vital that actions are identified to address the issues raised in the SWOT analysis and determine an effective way forward. These actions may involve revisiting the organisation’s strategy, and Ansoff’s matrix provides a set of options that support this work. For example, if a weakness has been identified in the performance of the organisation’s product range, two possible options from Ansoff’s matrix may be considered: to adopt a market penetration strategy by initiating extensive promotional and sales activity, or to adopt a product development strategy by initiating the enhancement of the product portfolio.
Ansoff’s matrix provides a means of identifying and evaluating the strategic options open to the organisation in the light of the information presented in the SWOT analysis. Together these techniques are extremely powerful in ensuring that any strategic analysis is carried out in a formal, informed manner. The assessment of the advantages and disadvantages of the four options presented in Ansoff’s matrix provides a systematic approach to strategy definition. The BA can be confident that the business strategy that emerges from this work is based upon firm foundations.
The strategy derived from the options provides information that will help the senior management to develop a new VMOST analysis (Technique 6) for the organisation. While the ‘mission’ may still pertain, the business ‘objectives’ may need to be revised, the ‘strategy’ description will need to be changed and the ‘tactics’ that will enable the organisation to meet the objectives and deliver the strategy will need to be redefined.
Technique 4: Growth share matrix
Variants/aliases
Aliases: Boston Consulting Group matrix; BCG matrix; Boston Box.
Description of the technique
The growth share matrix was developed by the Boston Consulting Group (BCG) to aid portfolio management. The matrix is a 2 × 2 matrix with four quadrants, as shown in Figure 1.2. The axes represent low to high market growth and high to low relative market share. The quadrants represent the areas shown in Table 1.5.
Using the growth share matrix
The growth share matrix is used to assess an organisation’s products and services according to their relative market shares (share relative to the third ranked player) and their market growth prospects. The portfolio of products and services is examined, and each of them is placed within the most appropriate quadrant. This helps to identify strengths and weaknesses within the portfolio. For example:
- When a product has been identified as a ‘dog’ it may be time to remove it from the portfolio. Even a limited amount of investment in a ‘dog’ may be a waste of finance that could generate greater benefits if spent elsewhere. Alternatively, it may be worth considering whether there is any action that could improve the situation – perhaps enhancing the product or selling it in a different market in order to generate a higher volume of sales or greater profitability. Both courses of action would require investment, so the prospects for improvement would need to be assessed carefully.
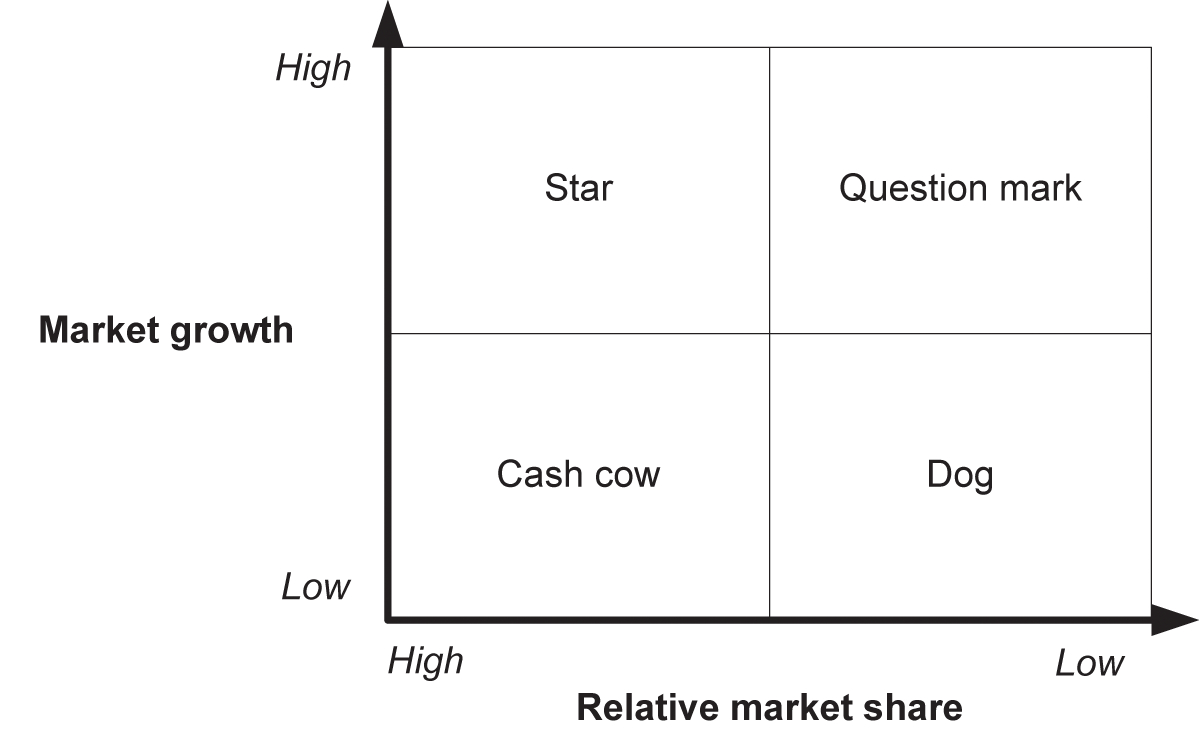
Table 1.5 Growth share matrix quadrants
Quadrant | Area |
Star | These are high-growth business units, products or services with a high percentage of market share. Over time, the market growth will slow down for these products and, if they maintain their relative market share, they will become ‘cash cows’. |
Cash cow | These are low-growth business units, products or services that have a relatively high market share. They are mature, successful products that can be sustained without large investment. They generate the income required to develop the new products (or revise the problematic products) that will hopefully become ‘stars’ in the portfolio. |
Question mark | These are business units, products or services with low market share but operating in high-growth markets. They have potential but may require substantial investment in order to develop their market share, typically at the expense of more powerful competitors. Management has to decide which ‘question marks’ to invest in, and which ones will be allowed to fail. |
Dog | These are the business units, products or services that have low relative share and are in unattractive, low-growth markets. Dogs may generate enough cash to break even, but they do not have good prospects for growth, and so are rarely, if ever, worth investing in. |
- Where a product has been identified as a ‘question mark’, action to rectify the situation needs to be considered; with careful development it may be possible to move the product into a ‘star’ position. For example, it may be possible to change the approach to marketing the product in order to enhance the market’s perception of it and thus increase sales.
As well as individual products and services, the growth share matrix may be used on market-facing business units where those business units address specific needs in the market and where the products or services that the business units offer are broadly similar. For example, an insurance company might use the growth share matrix to consider its entire offering of direct-to-consumer motor insurance products rather than considering each specific type of policy separately.
One of the issues with the growth share matrix is the level of granularity of the product assessment. There may be some products that do not fit neatly into a particular quadrant but are on the cusp between two. A pragmatic approach should be adopted in these situations, and other factors should be considered. For example, if a product is assessed as having medium market share and low growth this might not be because of an inherent problem with the product. It could instead be a question of timing and market conditions. The action that would improve the situation might just be to manage the product carefully until the market conditions change.
Technique 5: Resource audit
Variants/aliases
Alias: resource analysis.
Description of the technique
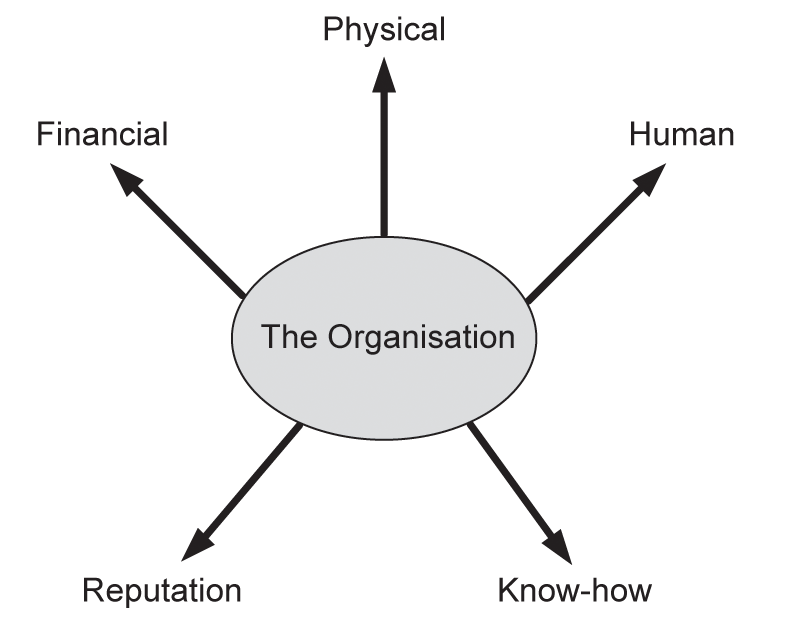
The resource audit is used to analyse key areas of internal capability in order to identify the resources that enable business operations and business change, and those that may undermine or prevent such efforts. Figure 1.3 shows the areas analysed as part of the resource audit, and the five areas of resource to examine within a resource audit are described in Table 1.6.
Figure 1.3 Resource audit (Source: ©Assist Knowledge Development)
Category | Description |
Financial | The financial resources available, which may be the organisation’s financial assets but could include the possibility of loans and credit. The organisation’s financial stability, and whether it has access to funds for investment and development, should be considered. |
Physical | The land, buildings and equipment available for use by the organisation, whether owned or leased. |
Human | The people employed by the organisation, whether on a permanent or a temporary basis. |
Reputation | The marketplace perception of the organisation and the amount of goodwill or, alternatively, antipathy generated by this reputation. |
Know-how | The information held within the organisation, and the way it is stored and used to support the organisation’s work. |
Using the resource audit
The resource audit is used to identify areas of strength and weakness within an organisation. Whether or not the organisation has access to resources that enable it to develop and grow should be investigated for each of the following areas:
- Does the organisation have access to financial resources that enable the development of new products or services or is it in financial difficulty, lacking the ability to invest in new products or services?
- Does the organisation have access to land and buildings that provide a basis for the development of new products or services, or is there a poor, underfunded infrastructure?
- Are the people working within the organisation motivated to deliver excellent products and services, or are they demotivated or complacent?
- Does the organisation have a reputation that supports the development of the market for its products and services, or is the brand devalued in a way that could hinder these efforts?
- Is the information held within the organisation used to inform decisions and operations? Is this information used to build a knowledge base that supports the organisation, or is information used poorly, and accessed with difficulty?
Table 1.7 provides a resource audit example for a consultancy company.
The resource audit provides well-defined areas to investigate and can result in a clear assessment of an organisation’s resources. However, each area of investigation may require significant time and effort to conduct thoroughly.
This technique may be used to examine internal resources at many different levels, ranging from an entire organisation to a localised team. The technique can be equally valuable when considering issues and problems right across an organisation or looking at those that exist within a particular department or function. Either way, a resource audit highlights where there are strengths that enable the introduction of business improvement and where there are weaknesses that could undermine the new working practices.
Table 1.7 Example of a resource audit
Category | Resources |
Financial | Good financial control and stability. Ratios: profit on sales 30%; liquidity £1.5 current assets to £1 current liabilities; gearing ratio 90%. |
Physical | Land: no land owned; buildings: no buildings owned – offices leased in Oxford and Bath; equipment: each employee has a company laptop and a personal mobile; supporting equipment: two printers and two projectors are available for use when necessary. |
Human | Staff of 25, including 18 consultants; two joint managing directors; all staff very motivated and committed to the company; all consultants highly qualified and skilled. |
Reputation | Good reputation in local area and has won local awards; not known outside customer base and areas of operation. |
Know-how | Company makes extensive use of ad hoc information systems, but these are not well integrated. |
Technique 6: VMOST analysis
Variants/aliases
Variant: MOST (mission, objectives, strategy, tactics).
Description of the technique
VMOST analysis is used to analyse what an organisation has set out to achieve (the vision, mission and objectives) and how it aims to achieve this (the strategy and tactics). Furthermore, the vision and mission often hint at why the organisation exists in the first place. An organisation’s VMOST provides a statement of its intent and is usually created following an appropriate set of strategic analysis activities. It is also useful during strategic analysis since it can demonstrate strength within the organisation or expose inherent weaknesses.
VMOST stands for:
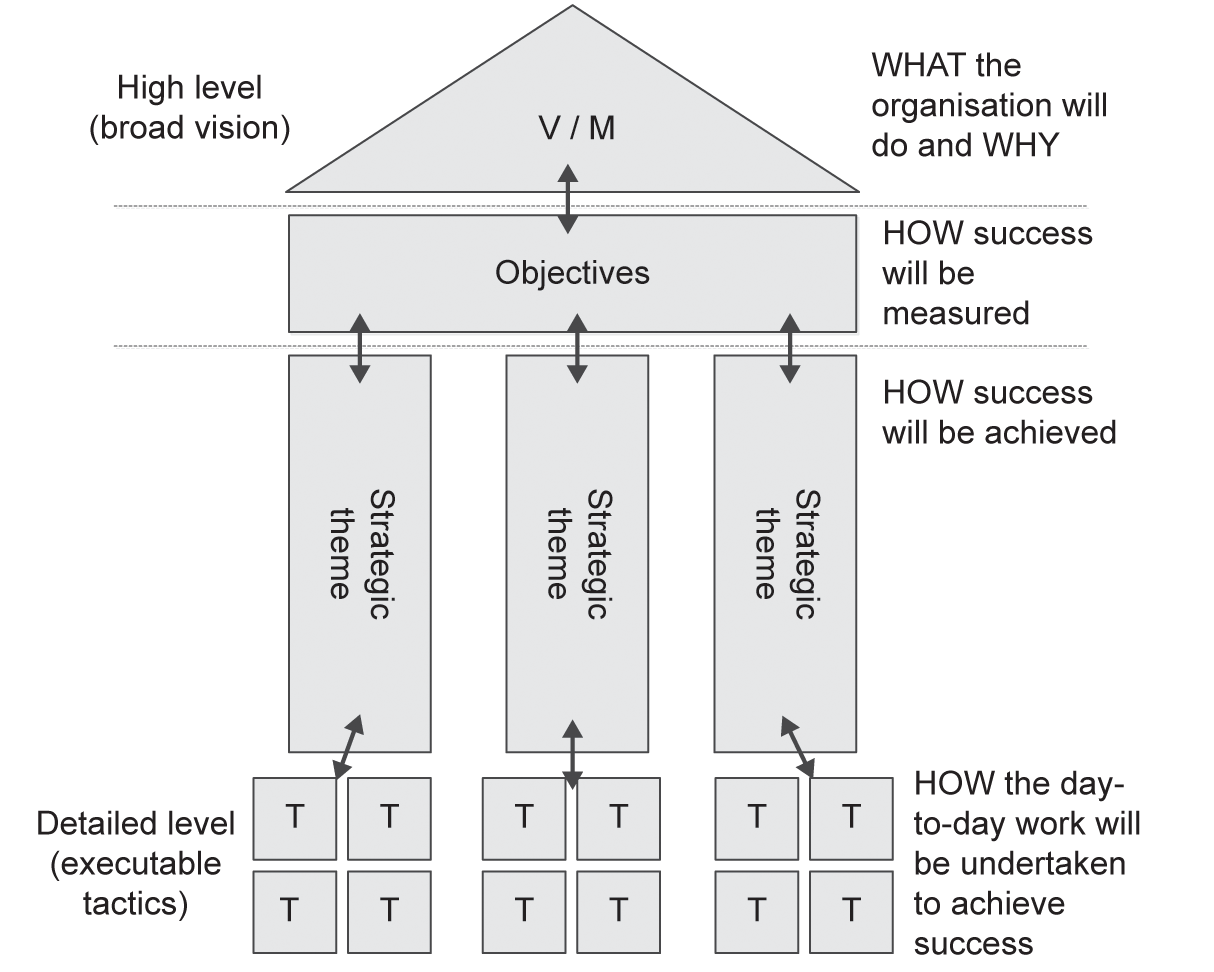
- Vision: A long-term aspirational future state set out for the organisation.
- Mission: A broad description of what the organisation will do in order to achieve the vision.
- Objectives: A set of goals that are aligned to the mission and vision that can be used to measure the organisation’s progress towards its vision. Objectives should adhere to the SMART criteria (specific, measurable, achievable, relevant and time-based).
- Strategy: A set of long-term strategic themes that provide direction on how the organisation will achieve its objectives, mission and vision.
- Tactics: The detailed, short-term plans, projects and actions that will deliver the strategy. Tactics should be articulated at a sufficient level of detail to be executable. It is not necessary to execute every tactic at once; it is normal to go through a process of prioritisation.
There should be clear alignment between the different VMOST elements. Each tactic should contribute to one or more strategies; each strategy should be directly linked to one or more objectives; all objectives should be aligned with the mission; achieving the mission should have a clear link to achieving the vision. This is summarised in the diagram shown in Figure 1.4.
Figure 1.4 Simplified VMOST diagram (Source: © Blackmetric Business Solutions Ltd, used with permission)
Using VMOST analysis
An example partial VMOST analysis for a social enterprise that focuses on providing internet access to excluded groups is shown in Table 1.8.
The VMOST technique can be used to identify strengths and weaknesses of an organisation. Some potential areas for consideration are shown in Table 1.9.
If the answer to any of these questions is ‘no’, then there is a potential weakness in the organisation. For example, the senior management may have defined the VMOST, but the staff might not agree with the direction and objectives, and as a result might not be motivated to deliver them.
Table 1.8 Example of a VMOST analysis
VMOST element | Description |
Vision | A society where internet access is available to all. |
Mission | To enable residents of all backgrounds to learn about and access the internet, irrespective of their ability to pay. |
Objectives | Open one new community internet hub by the end of the financial year. Operate a twice-weekly training schedule at each community hub. Obtain £100,000 of additional funding so that the service can continue to operate. |
Strategy | Recruit and retain volunteers who are passionate about the cause. Build ongoing relationships with sponsors who can provide funding and equipment. Collaborate with other local not-for-profits so that the cost of premises can be shared. Build partnerships with local colleges who may provide tutors. |
Tactics | Create a volunteer referral scheme. Communicate regularly with sponsors through newsletters, one-to-one phone calls and virtual events. Send regular press releases to the local paper to attract new sponsors. Form a fortnightly forum with leaders from other non-profits to learn lessons and identify collaboration opportunities. Approach colleges at the beginning of each academic year to build and maintain relationships. |
If the answer to any of these questions is ‘yes’, there are potential strengths in the organisation. For example, the clear definition and planning as encapsulated in the VMOST can help to motivate the staff to work towards an agreed set of objectives.
VMOST analysis can be a tricky technique to use when assessing internal capability. Merely defining and displaying a coherent VMOST does not necessarily result in staff commitment and motivation. The real strength is gained when the VMOST provides a clear focus and direction for the organisation. Where there is no clarity or agreement, the VMOST may mask some fundamental weaknesses.
Table 1.9 Factors to consider when applying VMOST analysis
Area | Considerations |
Definition | Is there a defined VMOST for the organisation? Is it complete and consistent, with no elements missing or out of alignment with each other? |
Context | Is the VMOST sensible and achievable given the internal resources and external constraints? Techniques such as PESTLE (Technique 1) and the resource audit (Technique 5) may be referred to in order to determine this. |
Clarity | Does the VMOST set out a clear direction and plan that will enable the organisation’s development and provide a focus for the work carried out? |
Coherence | Are the elements of the VMOST coherent? Will achieving the tactics contribute towards achieving the strategy? Will achieving the strategy contribute towards the objectives, mission and vision? |
Communication | Are staff members of the organisation aware of the VMOST, and is it available to guide the work they do? |
Commitment | Do the staff members work to deliver the VMOST? Do they agree with the content of the VMOST and are they supportive of its intent? |
STRATEGY ANALYSIS
Technique 7: Business model canvas
Variants/aliases
None.
Description of the technique
The business model canvas is a technique for documenting an organisation’s existing or desired business model. Gassmann et al. (2020) provide a useful definition of the term business model:
A business model defines which customers are addressed, what is made available for purchase, how products and services are created and how profits are generated.
While this definition sets out what a business model is, it can be challenging to actually visualise or articulate an organisation’s business model. The business model canvas is a tool that does this; it helps to foster a shared understanding of what products and services customers value and how those products and services are delivered. It breaks an organisation’s business model down into nine key components, as shown in Table 1.10.
These nine components are arranged as shown in Figure 1.5.
Table 1.10 Components of the business model canvas (Source: adapted from Osterwalder and Pigneur 2010)
Component | Definition |
Customer segments | The key recipients and beneficiaries of the services that the organisation provides. |
Value proposition | ‘A clear statement of the value that an organisation offers customers through the delivery of a product or service’ (Paul and Cadle 2020). |
Channels | The ways in which the value proposition reaches a customer segment; for example, online, in person, by phone, by post. |
Customer relationships | The nature of the relationships that the organisation fosters and maintains with its customers. |
Revenue streams | The ways in which the organisation will make money. |
Key resources | The physical, financial, human, know-how or reputational resources that are required to efficiently operate the business model. |
Key activities | The activities that utilise the key resources which enable the value proposition to be delivered to the customer segments via the chosen channels. |
Key partners | Describes where external organisations are providing necessary resources. |
Cost structure | The key areas where costs are incurred in operating the business model. |
Figure 1.5 The business model canvas (Source: adapted from Strategyzer AG (n.d.). This work is licensed under the Creative Commons Attribution-Share Alike 3.0 Unported Licence (CC BY-SA 3.0; http://creativecommons.org/licenses/by-sa/3.0/))

Using the business model canvas
Each portion of the canvas is populated so that the canvas provides an end-to-end overview of the organisation’s business model. A worked example based on the business model of a fictional 24-hour gym is shown in Figure 1.6, which illustrates that the gym offers low-cost flexible memberships, but accepts that by doing so its membership base will churn, meaning it needs to constantly advertise to attract new members.
Figure 1.6 Example business model canvas (Source: template from Strategyzer AG (n.d.). This work is licensed under the Creative Commons Attribution-Share Alike 3.0 Unported License (CC BY-SA 3.0; http://creativecommons.org/licenses/by-sa/3.0/))
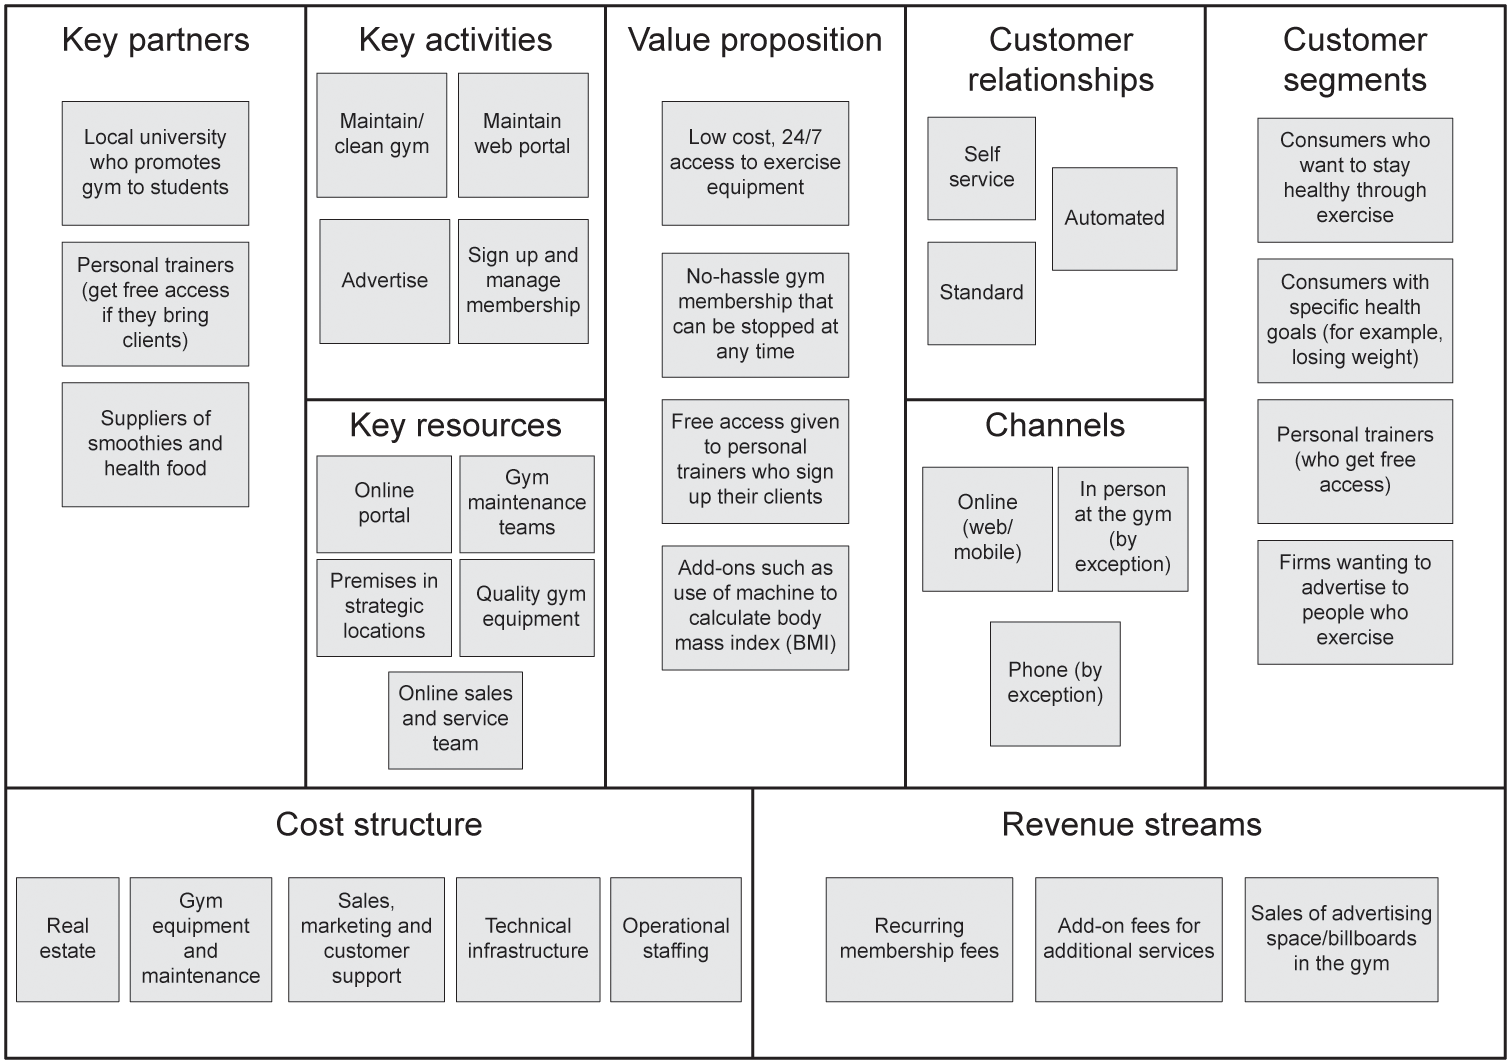
There is a logical flow around the canvas. The customer segments engage with a value proposition via one or many channels; this builds a customer relationship and generates a revenue stream. However, in order for the business model to operate, certain key activities need to take place, with the support of key resources and key partners. All of this contributes to the cost structure.
It is good practice to work collaboratively with a range of stakeholders to co-create the business model canvas. This will help to uncover any different business perspectives that may exist, and will also provide the opportunity for the resolution of any conflict. Where different perspectives emerge, techniques such as CATWOE (Technique 119) or principled negotiation and BATNA (Technique 122) may be used.
The business model canvas has several uses. One is to articulate an existing business model, which can be used to communicate to others how the organisation makes its money. However, it is more likely to be used to examine different types of business model innovations. The canvas can also be used as a prototype for the discussion of potential changes to an organisation’s business model, or to determine the knock-on impact of a change in one area.
Technique 8: Cultural web
Variants/aliases
None.
Description of the technique
The role of the BA is such that consideration needs to be given to the less tangible cultural characteristics that differentiate organisations from each other. These characteristics are often overlooked, but the success of any proposed business change is often dependent on understanding these differences and adapting the business analysis approach to them. Guidance in this area focuses on techniques related to the study of organisational and corporate culture. While sometimes these two areas are seen as interchangeable, organisational culture is in fact wider in scope than corporate culture and focuses on the social glue that binds the organisation together; it is sometimes described as a company’s ‘DNA’. Corporate culture, which may be ‘imported’ (perhaps by bringing in external specialists with their own inherent culture), is more holistic, usually historically determined and difficult to change. Corporate culture may be subdivided into two main areas: subjective aspects, based on understanding heroes, myths and rituals, are often unique to a specific organisation; objective aspects, based on elements such as office decor, location and amenities, are rarely company specific.
A study of the various cultural aspects, both corporate and organisational, leads to an understanding of the identity of the organisation, and helps when deciding what needs to go and what needs to stay for the organisation to achieve its strategic goals. There are many empirical studies on this topic, and they offer excellent guidance to support their use in practice.
Johnson et al. (2013) defined the ‘cultural web’, which provides a useful summary of characteristics for BAs to use when considering the cultural aspects of the organisation they are working with. The ideas demonstrated by the cultural web are particularly useful when aligning an organisation’s culture with its strategy in order to provide support in the planning of business change. The cultural web shown in Figure 1.7 identifies seven interrelated elements that together constitute an organisation’s culture.
The elements of the cultural web are described in Table 1.11, using examples based on an airline.
This example uses the cultural web to identify and analyse some aspects of an airline. It reveals a set of values and beliefs that affect the ways of working. While this particular culture creates many advantages for the organisation, it is possible that bringing a new company into the group would cause major culture clashes, and that any such integration would need to focus carefully on resolving these in order to ensure success. Additionally, external factors uncovered in PESTLE (Technique 1) may threaten the ongoing viability of certain norms and practices. For example, the increased expectation of home-working following the COVID-19 pandemic of the early 2020s may have a direct impact on the power structure of organisations that previously relied on strict ‘command and control’ and direct observation of staff by middle managers. This may lead to a necessary change emerging in its culture, but it will likely be a change that some middle managers will resist.
Figure 1.7 Johnson and Scholes’s cultural web (Source: Johnson et al. 2013)
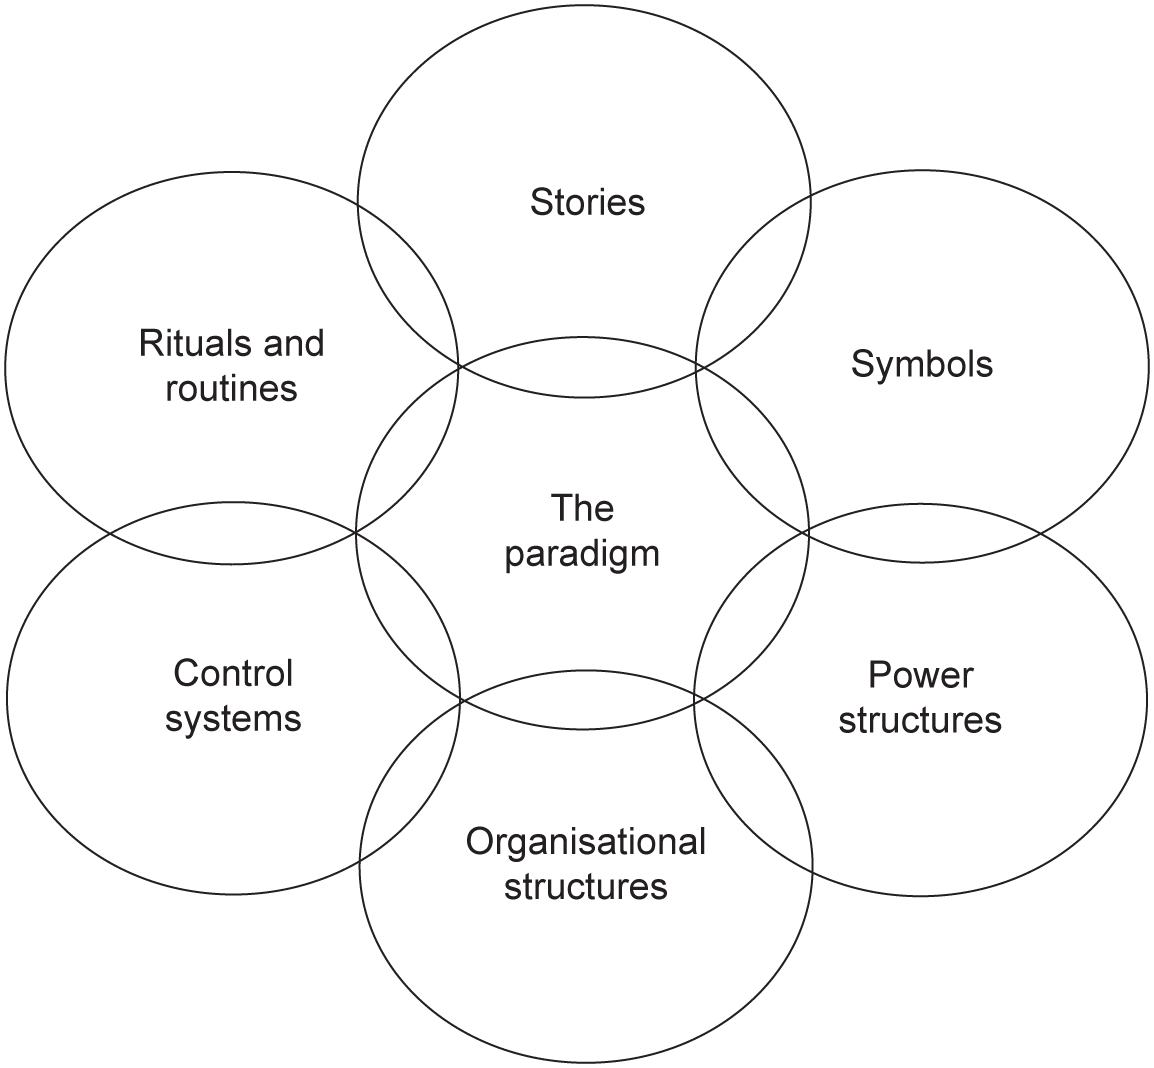
Table 1.11 Example cultural web analysis
Element | Example |
The paradigm | At the heart of the culture of any organisation are some assumptions about why it exists and what it is for. Ideally this paradigm would be reflected in its vision and mission statement. In the case of the example airline, the mission is: to be recognised as the highest quality airline |
Stories | These are past events and personalities that are talked about both inside and outside the organisation. Stories relate to instances where the airline provided additional gifts to passengers with children. |
Rituals and routines | These are the daily actions of individuals that are seen as acceptable behaviour within the organisation and are valued by management. The airline has spacious offices with a pleasant working environment, an impression that is felt by staff and visitors to the organisation. The airline holds staff competitions and awards free flights as prizes. |
These are visual representations of the organisation, including in areas such as logos, the office fixtures and fittings and the organisational dress code. The airline operates an informal dress code for office-based staff and a uniform for cabin staff. | |
Organisational structures | These reflect the ways the organisation is managed and controlled, and the informal lines of power and influence. The airline’s structure is based around small, focused teams that work on particular services and products. This creates a sense of a series of small companies operating within a large company. |
Control systems | These are the ways in which the organisation is controlled, including governance, financial systems and performance rewards. Data relating to key performance areas, such as customer satisfaction and flight punctuality, are collected and publicised across the company. |
Power structures | This reflects where the power lies regarding decisions, operations and strategic direction. The airline’s staff members are encouraged to be empowered and innovative, but key decision-making powers are vested in a small group of senior executives. |
Using the cultural web
Examining the individual cultural web elements and their interrelationships helps the BA to explore the cultural gap between where the organisation is now (by studying the culture as it is) and where it needs to be (by considering it as they would like it to be), and to support any proposed changes to processes and systems. The holistic nature of the BA’s role is enhanced by the application of the ideas gained from the cultural web and similar concepts. By taking time to understand these various elements the BA can avoid a situation in which aspects of the existing culture are likely to restrict progress, which, if not addressed, would potentially lead to such impacts as low morale, absenteeism and high employee turnover.
Even a relatively limited (in scope) business analysis project is likely to be impacted by and have an impact on at least some of the seven elements of the cultural web. For example, if a BA recommends changes to the organisational structures (by merging swim-lanes to improve processes), effective negotiation of the power structures will be needed in order to ensure ideas are accepted. Also, the changes to the business processes may well affect the control systems.
Technique 9: Business capability model
Variants/aliases
Alias: capability model.
Description of the technique
A business capability model provides a representation, at a high level of abstraction, of the capabilities possessed by an organisation. These capabilities enable the organisation to deliver products and services, each of which offers value to customers. A capability is defined as ‘a particular ability of the business to achieve an outcome that creates a value for a customer’ (Ulrich and McWhorter 2010).
In effect, a capability is a container for the business processes, people and technology that enables the co-creation of value for the organisation and its customers.
A business capability model shows what the organisation is able to do, not how, who or where this is done. It provides a static view and does not show movement of work, materials or data. In principle, there should be only one business capability model for an organisation (or business domain under study) with each capability rationalised into a unique definition. The model covers the entire scope of the organisation. Where an organisation works with external suppliers and partners to deliver its products or services, the business capability model represents the capabilities that are available across the entire ecosystem.
Organisations that define and maintain a model of their business capabilities are able to leverage the information contained within the model. As a result, they are able to respond to changes in the business environment effectively and rapidly, in contrast to those that do not take this approach. In addition, they are able to assess more accurately the impact and difficulty level of any proposed changes earlier and before too many resources have been expended.
Guidelines when producing a business capability model include:
- Capabilities must always be defined in business terms.
- Capabilities must be at a higher level of abstraction than the actual end-to-end business processes that support them.
- Capabilities should always be named using a noun/noun structure (for example, ‘complaint management’ rather than ‘manage complaint’).
- Capabilities are stable, whereas value streams (Technique 50) demonstrate movement.
- Capabilities must be unique across the entire capability model.
- Capabilities are enabled via value streams.
A business capability model should be represented as a hierarchical taxonomy, typically showing the following levels of decomposition:
- Strata (level 0): The three strata used to classify the capabilities are:
- Strategic or direction setting capabilities. These capabilities enable the strategic analysis and design for the organisation.
- Core or customer-facing capabilities. These capabilities enable the delivery of the organisation’s products or services.
- Support capabilities. These capabilities provide support to the core capabilities and enable the operation of the organisation.
In addition to the three strata, capabilities are decomposed to the following levels:
- Foundation (level 1): These are overview logical containers for grouping levels 2 and 3 capabilities. Foundation capabilities usually represent a high level of abstraction and are usually represented in two categories:
- Operational capabilities: those that are available within the physical boundary of the business itself.
- Environmental capabilities: the capabilities that are outside the physical boundary of the business but are available through engaging with other organisations and individuals within the business ecosystem.
- Capability groups (level 2): Capability groups are sets of related capabilities. Each capability group must contain at least two capabilities. This is the level where service levels and constraints can be identified and defined. Capability groups are analysed and decomposed to uncover business capabilities or, possibly, nested capability groups.
- Business capabilities (level 3/4): The business capabilities are the lowest level elements within a business capability model and are mapped to value streams, processes and business units. This is often the level where gaps are identified that need to be bridged in order for the organisation to function or offer a product or service. Business capabilities can be identified within a capability group or can be standalone.
Using a business capability model
A business capability model is developed using the following approach:
- Foundation level capabilities are identified within each of the three main strata.
- The foundation level capabilities are expanded as the lower-level capability groups they contain are identified.
- The re-usable standalone business capabilities within the capability groups emerge and are added to the model.
Figure 1.8 shows an example of a partial business capability model for an organisation that offers food delivery services. The diagram includes examples of capabilities shown within the three strata and at each level of decomposition. The decomposition of the capability group ‘HR management’ incorporates a capability group ‘Performance management’. This is an example of a nested capability group.
Figure 1.8 Business capability model showing strata and level 1–3 capabilities (Source: ©Assist Knowledge Development)

Figure 1.8 shows that the level 1 capability ‘HR management’ may be decomposed into the level 2 capability group ‘performance management’, and the business capability ‘staff recruitment’. The capability group ‘performance management’ is further decomposed into the level 3 capabilities ‘performance review’ and ‘training delivery’.
Irrespective of the level of definition for capabilities, the acronym SUAVE helps to ensure that they are described well and consistently:
- Stable: The capability should represent the essence of the business, which does not change significantly over time.
- Unique: The capability should be distinctive and not duplicated across the organisation. Each capability must occur once in the model; this encourages a standard implementation of the capability across the organisation.
- Abstracted: The capability should not be concerned with the detailed process, people and technology required to conduct the work.
- Value driven: The capability should be focused on delivery of service to the end customer.
- Executive: The capability should be of interest to the organisation’s management.
The definition and grouping of capabilities offer a basis for effective communication with business stakeholders when discussing their needs or considering proposed change initiatives. It also enables the BA to identify opportunities for capability leverage and re-use, and minimises duplication of effort across the organisation. Each subsequent decomposition of a capability provides a more granular view of what a business is able to do. This helps the BA to appreciate where there are gaps and to identify which changes may not be feasible.
The business capability model provides a blueprint for a common understanding of the organisation. Where linked to other blueprints – for example, the information concepts model (Technique 10) or value streams (Technique 50) – it can provide a rich source of organisational knowledge. When applied effectively, it can be a key enabler of both strategic and tactical decision making.
Technique 10: Information concepts model
Variants/aliases
Alias: concept model.
Description of the technique
It is common to find a wide range of terminology and jargon being used within an organisation. There may be cases where different stakeholders use the same term to mean different things entirely. An information concepts model seeks to address this ambiguity by identifying and documenting the key concepts that are of relevance to the organisation, as well as the relationships between them. This enables clarity and precision in communication and is also an effective way for the BA to become acquainted with the terminology of the domain.
There are several conventions used to document an information concepts model. A typical model includes:
- A diagram that provides a visual representation of the concepts and their relationships.
- Textual definitions that specify the preferred term for each concept, along with an explanation of the concept and a list of any synonyms that are used within the business.
It should be noted that an information concepts model is technologically agnostic and does not directly represent data entities or classes stored on a database. It models concepts that are important to the business whether or not there is any intention to store data about them in an information system.
Using an information concepts model
Information about the domain and business situation will be gained through a range of elicitation and investigation techniques. Interviews and workshops may be used to elicit information and construct the model collaboratively. Legislation, regulation, policies, intranets, forms, industry papers and other documents often provide useful hints that can be elaborated on through further interactions with stakeholders.
When reading a business document or listening to a stakeholder, it is particularly helpful to identify nouns/noun phrases and verbs/verb phrases. Table 1.12 provides some examples from an insurance company.
Table 1.12 Noun and verb phrases
Type | Relates to | Example |
noun | concept | policy, policyholder, claim |
verb | relationship | covers, claims under, reports |
Information concepts will typically be elaborated on with a textural definition, along with any synonyms, as set out in Table 1.13. This helps to disambiguate terms that have different meanings to different stakeholders. For example, in an insurance company:
- Sales team members use the term ‘customer’ to mean someone who is enquiring about a policy.
- Other business actors only consider an individual to be a ‘customer’ if they have actually bought a policy.
Table 1.13 Example textural description of information concepts
Information concept (agreed term) | Definition | Business synonyms (other terms used in the business) |
Prospect | An individual who enquires about purchasing an insurance policy via an external insurance agent | Customer |
Policyholder | An individual who holds, or has previously held, an insurance policy | Customer |
Knowing that ‘customer’ has multiple meanings will prompt the BA to seek clarification when the term is used. Having an agreed set of terms and definitions makes formal written communication (such as writing a requirements document or user stories) much easier as each term is defined once and can be centrally maintained.
The textural description alone is rarely sufficient as it cannot easily display the relationships between concepts. It is also difficult to spot missing concepts, and it may be tricky to identify duplicate or overlapping concepts. For this reason, a diagram is often used. An example partial information concepts model for a fictional insurance company is shown in Figure 1.9.
Figure 1.9 illustrates various concepts shown as rectangles, relationships shown as lines and relationship descriptions added as text. The concepts relate to the noun/noun phrases mentioned earlier, and the relationships to the verb/verb phrases. In this example the diagram shows that a policyholder holds a policy, the policy provides cover against perils. If the policyholder experiences an incident, they can report it and if it is valid it will result in a claim being logged. The diagram also shows that an agent provides advice and sells the policy.
Figure 1.9 Example partial information concepts model (Source: ©Assist Knowledge Development)
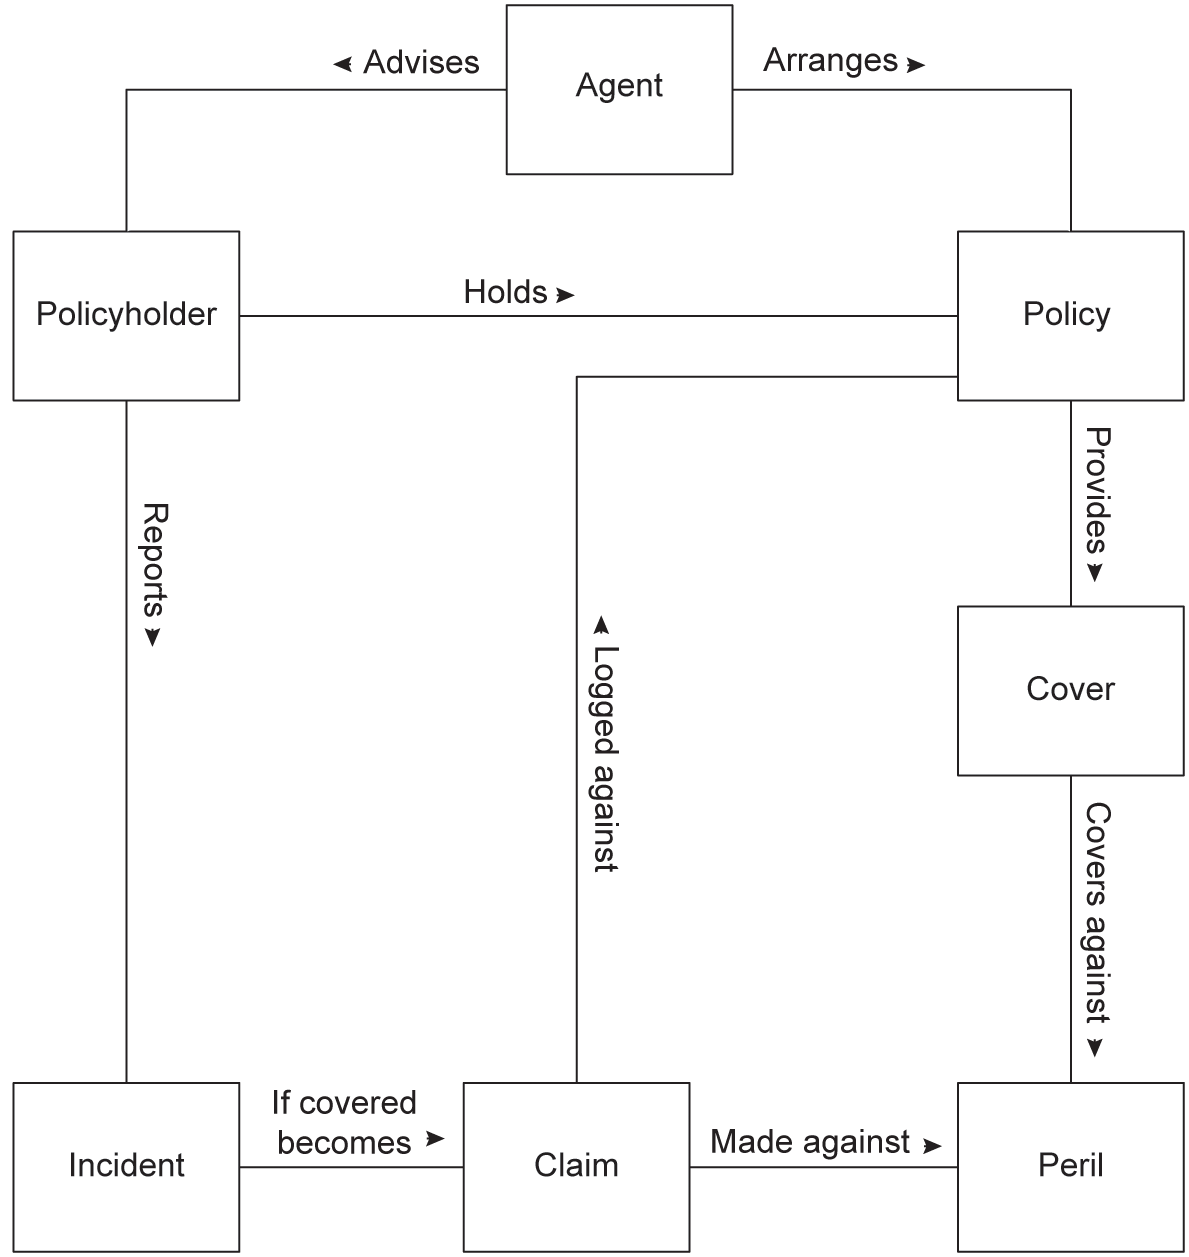
Information concepts models can also drive useful conversations about scope. For example, ‘prospect’ is not shown on the diagram. Further enquiries may determine that this is because prospects liaise via insurance agents/brokers so are considered outside the situation being examined. The modeller may then choose to omit them from the diagram for the sake of brevity while retaining the textural description shown in Table 1.13.
Additionally, an information concepts model can uncover information about business rules. Figure 1.9 shows that an ‘incident’ that occurs in the real world may become a ‘claim’. There would likely be a detailed set of rules behind this (one example might be: a claim is only valid if the date of the incident is after the inception and before the date of expiry of the policy). These rules are best expressed elsewhere rather than adding them to the diagram. This diagram does not show whether a specific concept can be associated with multiple instances of another. For example, it does not show if a policyholder can have more than policy, or whether a policy can have more than one policyholder. Instead, distinctions such as this would be found on a data model such as a class model (Technique 72).
Technique 11: SWOT analysis
Variants/aliases
Variant: TOWS analysis (threats, opportunities, weaknesses and strengths).
Description of the technique
SWOT analysis is used to consolidate the results from the external and internal business environment analysis. A SWOT analysis represents the areas shown in Figure 1.10 and described in Table 1.14.
Figure 1.10 SWOT analysis
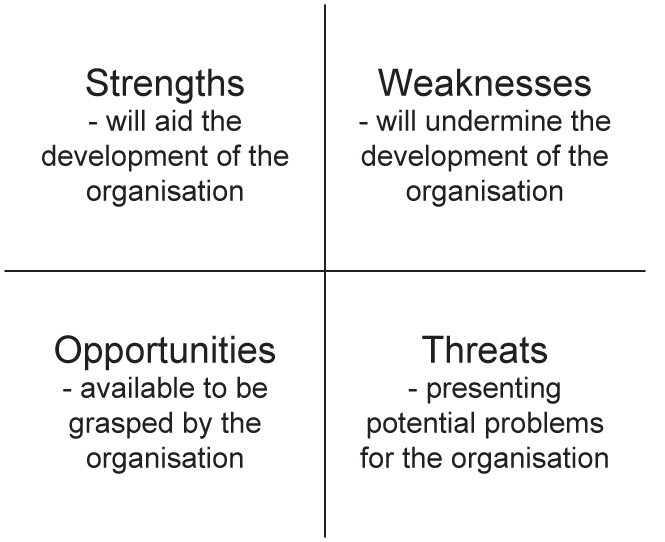
Table 1.14 SWOT analysis
Area | Description |
Strengths | The internal positive capabilities of the organisation; for example, financial resources, motivated staff or good market reputation. |
Weaknesses | The internal negative aspects of the organisation that are likely to diminish the chances of success; for example, out-of-date equipment and systems, unskilled staff or poor management information. |
Opportunities | The external factors that present opportunities for success; for example, social changes that increase demand for the organisation’s services, or the development of technology to provide new service delivery channels. |
Threats | The external factors that have the potential to harm the organisation; for example, a technological development that could enable new competitors to enter the market, or economic difficulties leading to a reduction in market demand. |
SWOT is used to summarise and consolidate the key issues identified when analysing an organisation and its business environment. It follows the use of techniques such as PESTLE (external, Technique 1) and the resource audit (internal, Technique 5).
Once the SWOT has been developed it is then used as a means of evaluating the organisation’s business situation and identifying potential strategies for the future. A standard approach is:
- Identify the new business improvements made possible by the opportunities defined in the SWOT.
- Identify the business issues that may arise from the threats defined in the SWOT.
- Consider the actions required to grasp the opportunities and address the threats.
- Identify the areas of strength that will enable the organisation to carry out these actions.
- Identify the areas of weakness that could undermine any action taken.
- Develop and evaluate strategic options for delivering success based on the previous steps.
SWOT analysis is often employed in workshops, where techniques such as brainstorming are used to identify the elements in each of the four areas. However, this approach is not rigorous and can be too informal to produce a comprehensive SWOT – there is the risk of missing significant factors, such as a looming threat or a major area of organisational weakness. A better approach is to use formal techniques such as those mentioned in this section to derive the SWOT, which helps to ensure that all relevant areas are considered and the key issues identified. Once the SWOT has been produced, the key issues must be distinguished since there may be a large set of entries, some of which are unlikely to yield more than minor changes. It is the key SWOT issues that should be examined in detail. These should form the basis for the strategy definition.
The implementation of business change is widely regarded as an extremely difficult activity, and success is often limited. Techniques such as the McKinsey 7S (Technique 102) and the POPIT model (Technique 16) provide a firm basis for identifying the aspects to be considered when implementing business change. These techniques may be used separately or in conjunction with each other. They are used to support two aspects of strategy implementation: identifying the areas that need to change and the range of actions to be taken within these areas; cross-checking all of the changes to ensure consistency, completeness and alignment.
Performance measurement
Technique 12: Balanced scorecard
Variants/aliases
Variant: organisations may employ variants of the balanced scorecard that reflect aspects relevant to the organisation; for example, a financial services provider might monitor the risk perspective in addition to the standard balanced scorecard dimensions.
Alias: balanced business scorecard.
The balanced scorecard (BSC) was developed by Robert S. Kaplan and David P. Norton as a means of defining a framework of performance measures that would support the achievement of the vision for an organisation, and the execution of its business strategy (Kaplan and Norton 1996). Historically, many organisations and external stakeholders, such as shareholders, have focused on their financial performance. However, financial measures have typically related to past performance, and the decline of financially stable organisations can be attributed to a lack of attention to areas of performance that will generate success in the future. The BSC identifies four aspects of performance to consider, as shown in Figure 1.11 and described in Table 1.15.
Figure 1.11 Balanced scorecard (Source: adapted from Kaplan and Norton 1996)
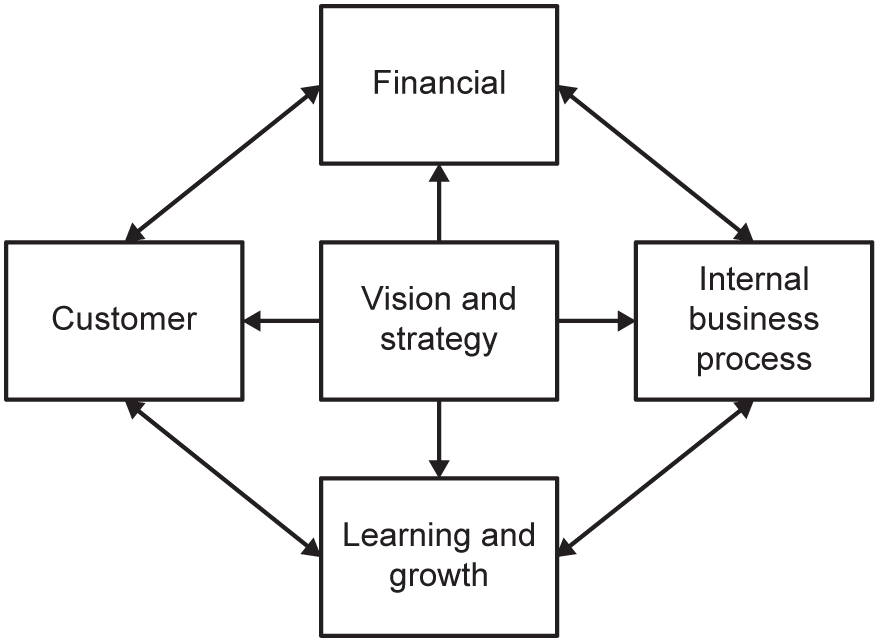
Table 1.15 Balanced scorecard (Source: adapted from Kaplan and Norton 1996)
Aspect | Description |
Financial | This aspect considers the financial performance of the organisation; for example, the profit generated by sales, the returns generated by the assets invested in the organisation and its liquidity. |
Customer | This aspect considers the customer perspective regarding the organisation; for example, the level of customer satisfaction and the reputation the organisation has in the marketplace are considered. |
Internal business process | This aspect considers the internal processes and procedures that are used to operate the organisation; for example, are the processes focused on reducing costs, to the detriment of customer service? Is the technology used well to support the organisation in delivering its products and services? |
Learning and growth (also known as innovation) | This aspect considers the future development of the organisation; for example, the development of new products and services, the level of creative activity in the organisation and the extent to which this is encouraged. |
The approach to identifying CSFs and KPIs (Techniques 13 and 14) is usually used in conjunction with the BSC. The mission and objectives of the organisation – from VMOST (Technique 6) – are used as the context in which to define the BSC areas. For example, if the mission is to deliver good value, high quality and up-to-date services to customers, then the four BSC areas could measure performance as follows:
- financial – level of supplier costs;
- customer – prices charged in comparison with competitor prices;
- internal business processes – quality checking processes;
- innovation – introduction of new products.
The BSC helps to ensure that organisations do not focus solely on financial results but consider both their current performance and the factors that will enable continued success. The BSC is used to ensure that a complete view of the organisation’s performance is measured and monitored. It is vital that all four areas are considered, not just one or two; omitting any of the areas is to risk undermining the performance of the organisation and to increase the chance of business problems arising in the future.
Techniques 13 and 14: Critical success factors and key performance indicators
Variants/aliases
None.
Description of the techniques
Critical success factors (CSFs) and key performance indicators (KPIs) are used to determine measures of organisational performance. CSFs are identified first, since they are the areas of performance that the organisation considers vital to its success. They are typically broad-brush statements such as ‘customer service’ or ‘low costs’. Two types of CSF should be considered:
- Industry-wide CSFs: The areas of effective performance that are necessary for any organisation operating within a particular business domain or market sector. For example, all restaurant chains will need to consider ‘hygiene’ as a CSF – no restaurant that disregards hygiene is likely to operate for very long. These CSFs do not differentiate between organisations, but they allow them to continue operating.
- Organisation-specific CSFs: The areas of performance that enable an organisation to outperform its competition. These are the areas that it focuses upon as key differentiators. For example, a fast-food chain might claim low cost of operation and a consistent customer service as two of the company’s CSFs. This is in contrast to a luxury restaurant that offers bespoke (but high cost) dining to its clients.
KPIs are related to the CSFs and define the specific areas to be monitored in order to determine whether the required level of performance has been achieved. If an organisation has defined ‘excellent customer service’ as a CSF, the KPIs could include the volume of complaints received over a defined time period, and the percentage of customers rating the organisation ‘very good’ or ‘excellent’ in a customer perception survey. To ensure they are measurable, KPIs should adhere to the SMART criteria: specific, measurable, achievable, relevant and time-based. It is usual practice to assign a performance target against each KPI.
Since KPIs are related to CSFs, they need to be defined for both the industry-wide and the organisation-specific areas.
Using the CSF/KPI techniques
Once an organisation has defined its VMOST (Technique 6), the performance measures that will provide a detailed means of monitoring progress need to be determined. The CSFs are identified first, and the KPIs and associated performance targets are defined in support of the CSFs.
The VMOST for the organisation should help to identify how it is positioned within the market; this should be underpinned by a set of organisational beliefs and priorities. The beliefs are those that the senior management feels are essential to its successful operation. CATWOE (Technique 119) is helpful when considering the core beliefs of the senior management team. This information helps in identification of the CSFs, which then leads on to defining the KPIs and the corresponding targets. This three-part approach is described in the following example.
If an organisation is positioned as a high-quality provider of services, the CSFs might include ‘excellent customer service’ and ‘high-quality services’. Several KPIs may be defined to monitor the areas of operation that relate to achieving these CSFs. For example, the KPIs would need to monitor aspects such as the percentage of customer complaints and the percentage of repeat purchases. For each of these KPIs, a target and a timeframe would need to be set. Two examples of these are: when asked during the quarterly customer satisfaction survey, fewer than 2 per cent of customers complain about the service received; within 12 months of their initial purchase, more than 60 per cent of customers purchase further services.