
In Chapter 5, Development Best Practices, we learned about performance-related development best practices. Throughout the book, we learned many best practices to improve the performance of Liferay-Portal-based solutions. Even after applying those best practices, it is very important to verify whether the system meets performance expectations under the anticipated peak load. This can be done by performing load testing. We also talked about many dynamic configurations as well, which can be further tuned during load testing to meet performance expectations. In this chapter, we will learn load testing and performance tuning best practices for a Liferay-Portal-based solution.
In this chapter, we will cover the following topics:
- Getting ready for load testing
- Capturing load testing requirements
- Selecting a load testing tool
- Writing load testing scripts
- Setting up the load testing environment
- Conducting load tests
- Resource monitoring and performance tuning
- Liferay Portal server – monitoring and tuning
- Apache web server – monitoring and tuning
- Monitoring the database server
- Monitoring logfiles
Load testing is an exercise to validate the system's capability to handle expected peak load. The maximum number of concurrent requests that the system is expected to handle is known as the peak load. Load testing is performed by artificially generating a number of concurrent requests on the system using load testing tools. To begin with the load testing exercise, the first step would be to capture that load testing requirements.
To perform load testing, we need to design load testing scenarios, set up load testing environments, and so on. Load testing scenarios heavily depend on load testing or performance-related requirements. Also, depending on the performance requirements, a load testing environment has to be set up. Here is a brief checklist to capture all load-testing-related requirements:
- Concurrent users: It is very important to know the maximum amount of load that is expected on the system. It is measured by the number of users accessing the system at the same time. This is the most important requirement to be captured to conduct load testing. Sometimes concurrent user requirements are more specific, such as X number of concurrent users who will access page Y. If such requirements are available, load testing scenarios can be designed realistically. This requirement acts as an input for a load testing exercise.
- Response time: It is also very important to measure the response time of every request when the system is heavily loaded. Every system has accepted the response time limit. Here is some examples of response time requirements:
- The response time for all pages except the home page should be less than or equal to 4 seconds. The home page response time should be less than or equal to 8 seconds.
- It is impossible to make sure that the response time of all requests stays within the expected limits. Hence, most of the time the response time is referred to as the average response time. Sometimes requirements specifically state that an X percentage of requests must have a response time in the given range. It is very important to capture such details to design load testing scenarios and acceptance criteria accordingly. Response time requirement acts as an acceptance criteria for the load testing exercise.
- Transactions per second (throughput): In transaction centric portals, it is important to measure the number of transactions executed per second. This is called TPS or throughput. It is very important to capture the expected throughput under pick load. Again, throughput-related requirements act as acceptance criteria for the load testing exercise.
Load testing requires generating artificial user requests. This can be done by load testing tools. There are many proprietary and open source load testing tools available in the market. It is very important to choose the right tool for the load testing exercise. In this section, we will briefly talk about some of the open source or cloud-based load testing tools.
Apache JMeter is the most popular open source tool for conducting load testing. It is shipped as a desktop application and provides a user-friendly GUI for creating load testing scripts. Apache JMeter is highly extensible and supports external plugins. It comes with many built-in plugins. It has many plugins to generate user-friendly output reports. It also comes up with many plugins that allow the exporting of load testing reports to various formats such as CSV, XLS, and so on. Apache JMeter supports load testing of the following type of requests:
- HTTP or HTTPS
- SOAP
- LDAP
- JMS
- Database via JDBC
- SMTP, POP3, or IMAP
- Shell scripts
BlazeMeter is a cloud-based load testing tool. Internally, it runs a cluster of JMeter instances. Hence, it supports generating a huge amount of load. Similar to JMeter, it supports similar types of requests. It provides good interactive reporting. It supports generating load from different geographic locations to perform realistic load tests. It also supports scheduling load tests.
Apache Benchmark is a command-line load testing tool to perform simple load tests for HTTP requests. It uses a single operating system thread for generating load. Hence, it is not advisable to use it for a large number of concurrent requests. It generates load on the server by requesting the given URL concurrently. It does not download subsequent resources such as CSS, JS, Images, and so on. It does not provide user-friendly reporting as well. Also, it doesn't support testing multiple URLs at the same time.
Other than these three tools, there are many popular and powerful proprietary tools available in the market. Some of the popular tools include HP LoadRunner and IBM Rational Performance Tester. If we are looking for powerful open source load testing tools, JMeter is the best option. In this chapter, we will consider JMeter as the load testing tool.
As discussed earlier, load testing is conducted using load testing tools. Irrespective of any load testing tool, load testing scripts are required to run specific load testing scenarios. The syntax for writing load testing scripts will vary from one tool to the other but the concept remains the same. In this section, we will talk about some of the best practices for writing load testing scripts. We will consider JMeter as the load testing tool for understanding the concepts and best practices.
Load testing scripts are written with a sequence of operations that are performed by multiple concurrent threads. Here are some of the key parameters for JMeter load testing scripts that should be configured correctly to make load testing more realistic:
- Concurrent threads: This parameter controls how many concurrent executions of the load testing operations should be performed. This parameter should be configured carefully. This parameter also depends upon the machine from which we are running the load test. If it is configured to a very high value, the JMeter instance may go out of memory or it may not give accurate load testing results. To test a very high amount of concurrent threads, it is advisable to run load tests through multiple machines.
- Loop count / duration: This parameter defines how many times or for how much time concurrent executions should happen. In order to get accurate results, load tests should be executed for a longer duration. It should not be less than 30 minutes unless there is a specific need.
- The ramp-up period: This parameter controls the period within which the load testing tool will create a maximum number of concurrent threads configured in the script. For example, if a portal is expected to have 2000 concurrent users during pick time, all 2000 users will not start accessing the portal at the same time. They will start accessing the portal one by one and at a certain point in time all 2000 users will be accessing the Portal. So, here the time interval within which the number concurrent users reach from zero to 2000 is the ramp-up period. If it is configured incorrectly, it may give unrealistic load test results.
- The think time: This parameter controls the wait time between two operations of the load testing script. Let's take an example of a user accessing a portal. He/she will first log in to the portal, then access page X and then access page Y, and so on. The user will take some time after logging in and before accessing page X. This time is called the think time. This parameter should be configured properly to generate a realistic load on the system. If it is configured to a very low value, the portal will be flooded with a number of requests. And it will not be a realistic scenario.
Apart from the aforementioned parameters, there are some of the Liferay-specific best practices that should be followed while writing test scripts. They are as follows:
- Login is one of the costliest operations in Liferay Portal. It is recommended to write realistic test scenarios where the user first signs in and then performs various operations and finally signs out.
- JMeter provides a way to read CSV- or XLS-based inputs to perform any operations. It is recommended to create a number of dummy users in Liferay Portal and perform a load test with those dummy users. If load tests are performed with a single user, it will not generate a realistic load.
- JMeter instances should be configured on the machine that is in the same network as Portal. If JMeter instances are not part of same network as Portal, the load test may give inaccurate results because of varying Internet speed. The purpose of load testing is not to determine the bottleneck of a network between the user and server. Hence, it is recommended to run load tests from the same network.
Load testing is normally performed after functional testing is done. Once we are ready with load testing scripts, the next step is to set up the load testing environment. The load testing environment should be of one that is in production such as hardware and deployment configuration. As the purpose of load testing is to verify if the system passes performance expectation with the pick time load, load testing and tuning should be done on a production-like environment. All necessary resource monitoring tools should be installed and configured. Enough space should be allocated for storing various monitoring logfiles.
JMeter should be set up on separate machines with enough memory and CPU capacity. If the number of concurrent users is too high, it is recommended to run load tests from multiple machines. In general, we can run load tests with around 300 concurrent users from a machine with 2 GB RAM allocated to the JMeter application.
Load testing is an iterative exercise. It is highly integrated with the resource monitoring and performance tuning exercise. The following diagram explains the iterative process of conducting load tests:
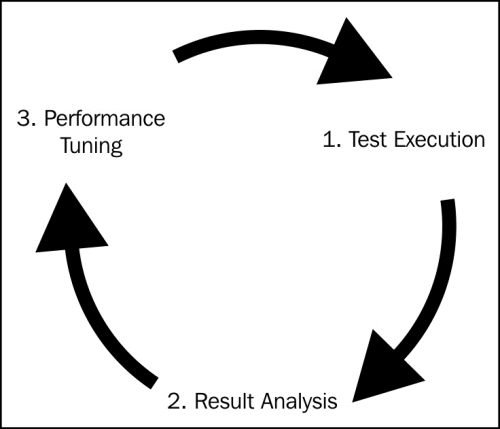
As shown in the diagram, the first step is to execute the load test and monitor resources. The second step is to analyze the load test results and the resource monitoring data. Based on the analysis, necessary changes in the environment, source code or load testing scripts should be produced and then again the same cycle should be followed until expected performance targets are achieved.
As mentioned earlier, JMeter provides good GUI-based reporting plugins. Using many reporting plugins can slow down JMeter. Hence, it is recommended to use only those reports that are necessary. Most of the time, we would like to capture average response time, response time of 90 percent requests, throughput, error percentage, and so on. These results can be captured using the aggregate report of JMeter.
In the next section we will talk about the resource monitoring and performance tuning steps in detail.