Installing Impala with Cloudera Manager will not only help in installing and upgrading Impala, but it will also be very helpful in Impala management and troubleshooting.
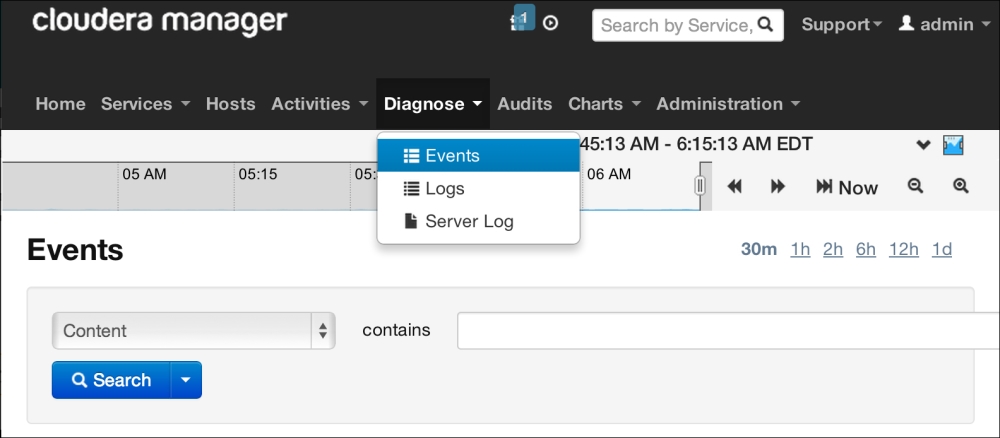
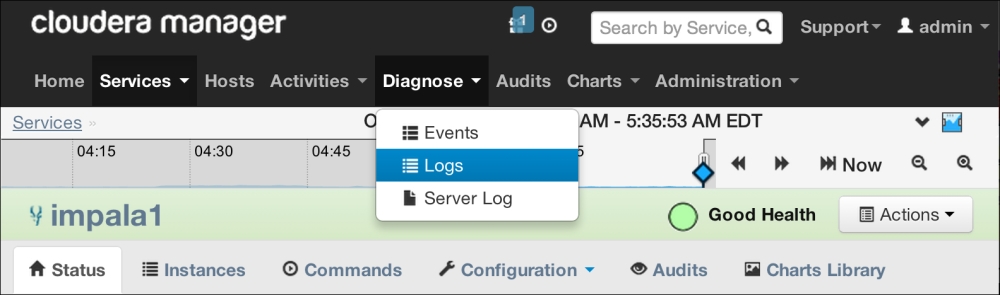
In Cloudera Manager, you can navigate to the Diagnose | Logs option to select Impala-specific log configurations, as shown in the following screenshot:
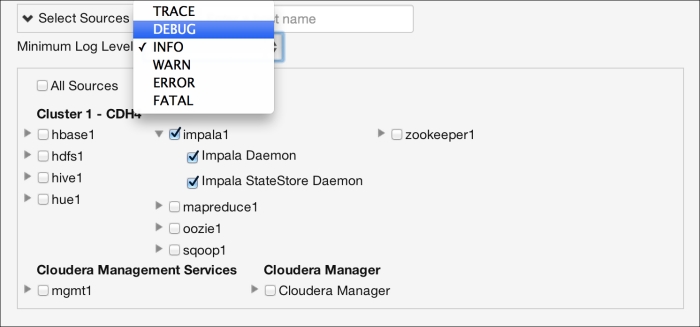
In the log configuration page, you can select Impala daemon, statestore, and log types such as INFO, DEBUG, WARN, ERROR, TRACE, or FATAL. This is shown in the following screenshot:
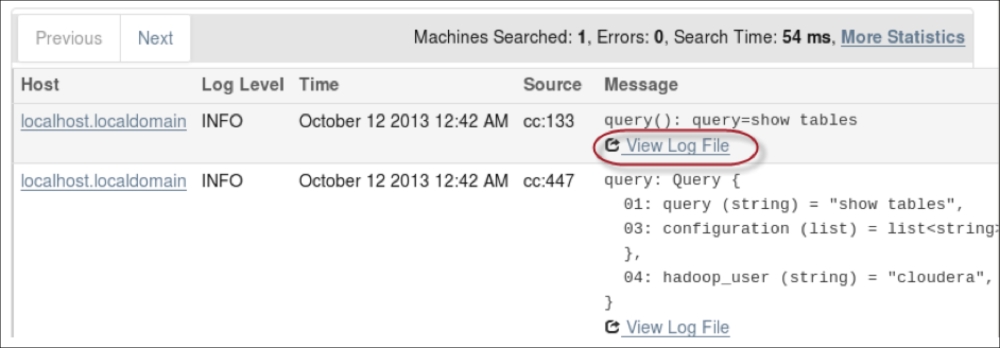
After Impala-specific log configuration is completed, you can see the Impala log files on the same page along with log snippets. You can view the whole log files by just performing one-click operation, as shown in the following screenshot:
Besides this, you can view the Impala log files at console windows by visiting the /var/log/impala or /var/log/impalad folders. These are the folders where Impala stores logs by default in each node where impalad is running. The entire log files are generated at the restart of the impalad process with a timestamp. In these directories, the Impala log files are as follows:
|
Log file name |
The information stored in the log file |
|---|---|
|
|
Impala daemon-specific configuration settings |
|
|
Information about all kinds of warnings generated by Impala |
|
|
All kinds of errors and potential problems encountered by Impala |
|
|
A |
|
|
Statestore-specific errors |
Impala logs contain detailed information about the Impala daemon and statestore processes, along with each query processed by Impala. Some of the info, such as process and machine info, is logged once. However, when queries are processed, all query details are logged. This is described in the following table:
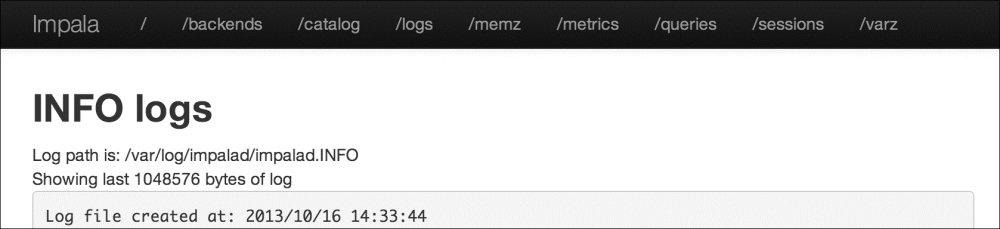
Impala provides the web interface for the Impala process at the 25000 port, as shown in the following screenshot. This is to check various information, such as configuration, logs, metrics, queries details, and memory:
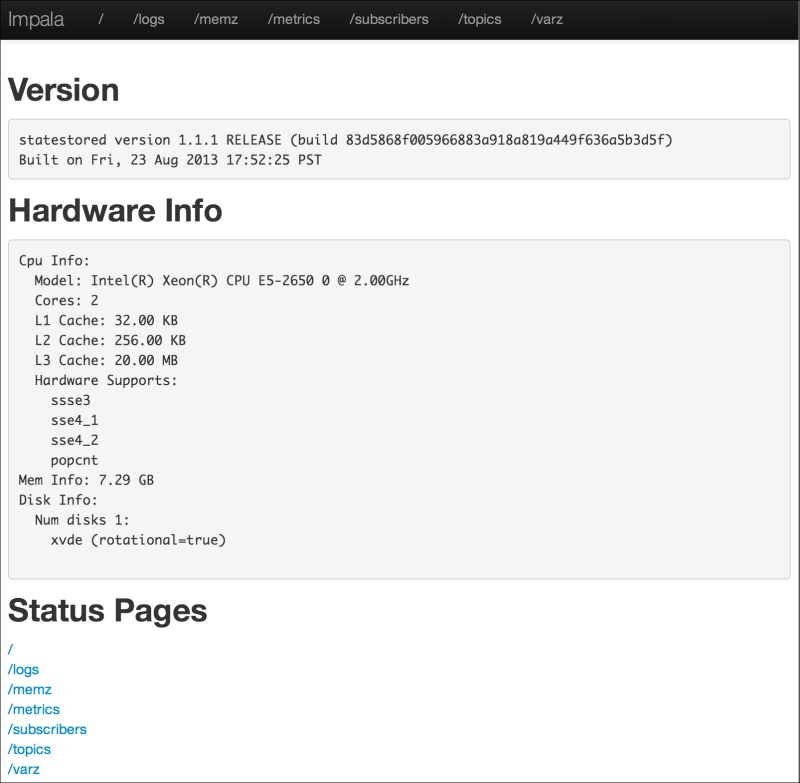
Same as the last section, the statestore web interface is available at the 25010 port with the same info as the last section. This is shown in the following screenshot:
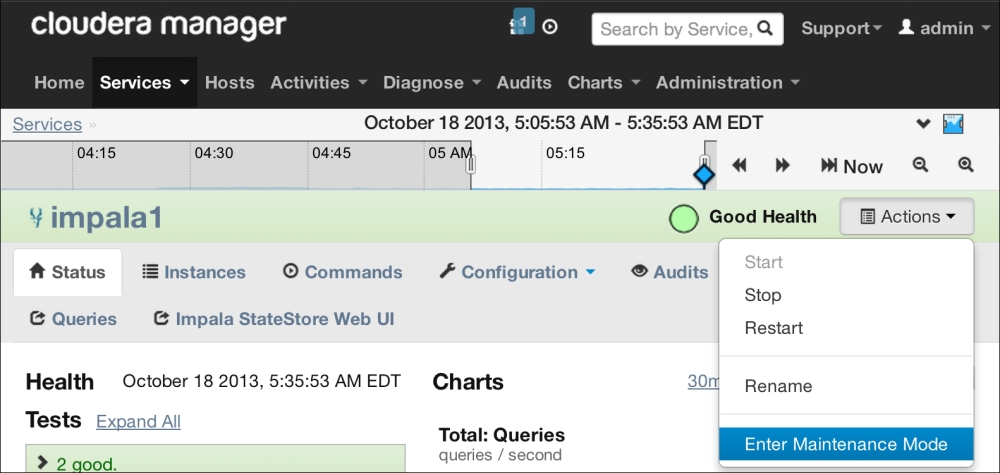
Cloudera Manager provides a configuration named Maintenance Mode that can help you monitor the whole Impala cluster effectively. With Cloudera Manager, Maintenance Mode can be set for a service, a role, a host, or a whole cluster. Using Maintenance Mode as an administrator, you can suppress alerts for the host, role, service, or full cluster. While in Maintenance Mode, logging still works as it is. Therefore, even when there are no alerts, all the logs are still saved, so that anyone can check those logs to meet any specific requirement later. When making specific changes to the cluster or any specific component, Maintenance Mode helps to reduce unnecessary change notifications to all users and keeps the noise due to maintenance very low. The following screenshot shows how you can set your Cloudera Hadoop cluster into Maintenance Mode: