
Traceability is extremely important in the modern information systems. It is a delicate matter in microservices that is gracefully solved in Seneca, making the requests easy to follow around our system so that we can audit the failure.
Seneca is pretty good with the logging. There are so many options that can be configured in Seneca in order to get the required information about how everything is working (if it is working).
Let's see how logging works with a small application:
var seneca = require("seneca")();

seneca.add({cmd: "greeter"}, function(args, callback){
  callback(null, {message: "Hello " + args.name});
});

seneca.act({cmd: "greeter", name: "David"}, function(err, result) {
  console.log(result);
});
This is the simplest Seneca application that can be written. Let's run it as follows:
seneca  node index.js
2016-02-01T09:55:40.962Z 3rhomq69cbe0/1454579740947/84217/- INFO hello Seneca/1.0.0/3rhomq69cbe0/1454579740947/84217/-
{ message: 'Hello David' }
This is the result of running the app with the default logging configuration. Aside from the console.log() method that we have used in the code, there is some internal information about Seneca being logged. Sometimes, you might want to only log what your application is producing so that you can debug the application without all the noise. In this case, just run the following command:
seneca  node index.js --seneca.log.quiet
{ message: 'Hello David' }
However, sometimes, there are weird behaviors in the system (or even a bug in the frameworks used) and you want to get all the information about what is happening. Seneca supports that as well, as shown in the following command:
seneca node index.js --seneca.log.print
The preceding command will print an endless amount of information that might not be helpful.
In order to reduce the amount of logging produced by Seneca, there is a fine-grain control in what gets logged into the output. Let's take a look at the following lines:
2016-02-01T10:00:07.191Z dyy9ixcavqu4/1454580006885/85010/- DEBUG register install transport {exports:[transport/utils]} seneca-8t1dup
2016-02-01T10:00:07.305Z dyy9ixcavqu4/1454580006885/85010/- DEBUG register init seneca-y9os9j
2016-02-01T10:00:07.305Z dyy9ixcavqu4/1454580006885/85010/- DEBUG plugin seneca-y9os9j DEFINE {}
2016-02-01T10:00:07.330Z dyy9ixcavqu4/1454580006885/85010/- DEBUG act root$       IN o5onzziv9i7a/b7dtf6v1u9sq cmd:greeter {cmd:greeter,name:David} ENTRY (mnb89) - - -
They are random lines from a log output on the preceding code example, but it will give us useful information: these entries are debug-level log lines for different actions (such as plugin, register, and act) on the Seneca framework. In order to filter them, Seneca provides a control over what levels or actions do we want to see. Consider the following for example:
node index.js --seneca.log=level:INFO
This will only output the logs related to the INFO level:
seneca  node index.js --seneca.log=level:INFO
2016-02-04T10:39:04.685Z q6wnh8qmm1l3/1454582344670/91823/- INFO hello Seneca/1.0.0/q6wnh8qmm1l3/1454582344670/91823/-
{ message: 'Hello David' }
You can also filter by action type, which is quite interesting. When you are working with microservices, knowing the chain of events that happened in a flow is one of the first things that you need to look into in order to audit a failure. With this control over the logging that Seneca gives us, it is as easy as executing the following command:
node index.js --seneca.log=type:act
This will produce the following output:
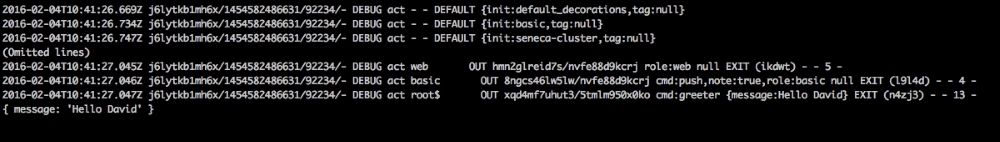
As you can see, all the preceding lines correspond to the act type, and even more, if we follow the output of the command from top to bottom, we exactly know the sequence of events to which Seneca reacted and their order.
Tracing requests is also a very important activity, and sometimes, it is even a legal requirement, especially if you work in the world of finance. Again, Seneca is fantastic at tracing requests. For every call, Seneca generates a unique identifier. This identifier can be traced across all the paths to where the call is going to, as follows:
var seneca = require("seneca")();

seneca.add({cmd: "greeter"}, function(args, callback){
  console.log(this.fixedargs['tx$']);
  callback(null, {message: "Hello " + args.name});
});
seneca.act({cmd: "greeter", name: "David"}, function(err, result) {
  console.log(this.fixedargs['tx$']);
});
Here, we are logging a dictionary that contains the transaction ID in Seneca to the terminal. So, if we execute it, we will get the following output:
2016-02-04T10:58:07.570Z zl0u7hj3hbeg/1454583487555/95159/- INFO hello Seneca/1.0.0/zl0u7hj3hbeg/1454583487555/95159/-
3jlroj2n91da
3jlroj2n91da
You can see how all the requests in Seneca are traced: the framework assigns an ID and it gets propagated across endpoints. In this case, all our endpoints are in the local machine, but if we distribute them in different machines, the ID will still be the same.
With this unique ID, we will be able to reconstruct the journey of the customer data in our system, and ordering the requests with the associated timestamp, we can get an accurate picture of what the user was doing, how much time did every action take, what are the possible problems associated with delays, and so on. Usually, the logging combined with circuit breakers output information allows the engineers to solve issues within a very reduced time frame.
Up till now, we have been using console.log() to output the data into the logs. This is a bad practice. It breaks the format of the logs and throws the content to the standard output.
Again, Seneca comes to the rescue:
var seneca = require("seneca")();

seneca.add({cmd: "greeter"}, function(args, callback){
  this.log.warn(this.fixedargs['tx$']);
  callback(null, {message: "Hello " + args.name});
});

seneca.act({cmd: "greeter", name: "David"}, function(err, result) {
  this.log.warn(this.fixedargs['tx$']);
});
Let's see what Seneca produces as output:
seneca  node index.js
2016-02-04T11:17:28.772Z wo10oa299tub/1454584648758/98550/- INFO hello Seneca/1.0.0/wo10oa299tub/1454584648758/98550/-
2016-02-04T11:17:29.156Z wo10oa299tub/1454584648758/98550/- WARN - - ACT 02jlpyiux70s/9ca086d19x7n cmd:greeter 9ca086d19x7n
2016-02-04T11:17:29.157Z wo10oa299tub/1454584648758/98550/- WARN - - ACT 02jlpyiux70s/9ca086d19x7n cmd:greeter 9ca086d19x7n
As you can see, we are now outputting the transaction ID using the logger. We have produced a WARN message instead of a simple console dump. From now on, we can use Seneca log filters to hide the output of our actions in order to focus on what we are trying to find.
Seneca provides the following five levels of logging:
- DEBUG: This is used to debug applications when you are developing them and also trace problems in production systems.
- INFO: This log level is used to produce important messages about events such as a transaction has started or completed.
- WARN: This is the warning level. We use it when something bad happens in the system, but it is not critical, the user usually does not get affected; however, it is an indication that something is going in the wrong way.
- ERROR: This is used to log errors. Generally, the user gets affected by it and it also interrupts the flow.
- FATAL: This is the most catastrophic level. It is only used when a non-recoverable error has occurred and the system won't be able to function normally.
A way to produce logs in different levels is to use the associated functions. As we have seen earlier, we called this.log.warn() to log a warning. If we call the this.log.fatal() method, we will be logging a fatal error, and same with the other levels.
In general, INFO, DEBUG, and WARN will be the most used log levels.
HTTP codes are often ignored, but they are a really important mechanism to standardize responses from remote servers.
When a program (or user) issues a request to a server, there are a few things that could happen, as follows:
- It could be successful
- It could fail validation
- It could produce a server error
As you can see, the possibilities are endless. The problem that we now have is that HTTP was created for the communication between machines. How do we handle the fact that machines will be reading these codes?
HTTP solved this problem in a very elegant way: every single request has to be resolved with an HTTP code and these codes have ranges that indicate the nature of the code.
The codes in the 100-199 range are purely informational. The most interesting code in this range is the 102 code. This code is used to specify that an operation is happening in the background and might take some time to complete.
Success codes are used to indicate a certain level of success in the HTTP request. It is the most common (and desired) codes.
The most common codes in this range are as follows:
200: Success: This code indicates a full success. Nothing went wrong even remotely.201: Created: This code is used mainly for REST APIs when the client requests to create a new entity in the server.203: Non-authoritative information: This code is intended to be used when, while routing the request through a transforming proxy, the origin responds with a 200.204: No Content: This is a successful code, but there is no content coming back from the server. Sometimes, APIs returns 200, even if there is no content.206: Partial Content: This code is used for paginated responses. A header is sent, specifying a range (and an offset) that the client will accept. If the response is bigger than the range, the server will reply with 206, indicating that there is more data to follow.
The codes in the 300 to 399 range indicate that the client must take some additional actions to complete the request.
The most common codes in this range are described as follows:
301: Moved permanently: This status code is indicating that the resource that the client was trying to get has been moved permanently to another location.302: Found: This code indicates that the user is required to perform a temporary redirect for some reason, but the browsers started implementing this code as303 See Other. This lead to the introduction of the 303 and307 Temporary redirectcodes to disambiguate the overlap of behavior.308 Permanent Redirect: This code, as the name indicates, is used to specify a permanent redirect for a resource. It could be confused with 301, but there is a small difference, the 308 code does not allow the HTTP method to change.
The codes in the 400 to 499 range represent errors generated by the client. They indicate that there is a problem with the request. This range is particularly important as it is the way that HTTP servers have to indicate the clients that something is wrong with their request.
The common codes in this range are as follows:
400 Bad Request: This code indicates that the request from the user is syntactically incorrect. There could be parameters missing or some of the values didn't pass validation.401 Unauthorized: This code represents a lack of authentication of the client. Usually, a valid login will fix this problem.403 Forbidden: This is similar to 401, but in this case, it is indicating that the user does not have enough privileges.404 Not Found: This means that the resource is not found in the server. This is the error that you get when you navigate to a page that does not exist.
This range indicates that there has been a processing error in the server. When a 5xx code is issued, it means that there was some sort of problem in the server and it cannot be fixed from the client.
Some of the codes in this range are as follows:
500 Internal Server Error: This means that an error has occurred in the software in the server. There is no more information disclosed.501 Not Implemented: This error occurs when a client hits an endpoint that has not been implemented yet.503 Service unavailable: This code is issued when the server is not available for some reason, either an excess of the load or the server is down.
The popular saying don't reinvent the wheel is one of my favorite principles when building software. HTTP codes are a standard, so everybody understands the consequences of the different codes.
When building microservices, you always need to keep in mind that your system will be interacting with proxies, caches, and other services that already speak HTTP so that they can react according to the response from the servers.
The best example of this is the circuit-breaker pattern. No matter how you implement it and what software you use, a circuit breaker has to understand that an HTTP request with 500 code is an error, so it can open the circuit accordingly.
In general, it is good practice to keep the codes of your application as accurate as possible as it will benefit your system in the long run.