
As you develop and operate applications with RethinkDB, you may need to analyze the performance of the application and its database. Usually, when you encounter degraded performance, it is often due to incorrect database access strategies or poorly-written queries.
RethinkDB provides a tool called a database profiler that shows performance characteristics of queries executed on the database. This tool is accessible from the database web interface. Once enabled, the profiler will present you with a breakdown of all operations performed on the database during the execution of a query, including the time it took to run each operation.
Probably, the most useful piece of information provided by the database profiler is the server time, which represents the total execution time of a query on the database server. This doesn't include the additional overhead caused by the network round trip; however, if you are interested in the total time, including the time it took to send the query over the network and receive a response, the profiler will also give you this information.
Now that we know how the query profiler works, let's try using it. For testing purposes, we will run the query that we wrote in the previous section and use the profiler to see how long it takes for the database to run it.
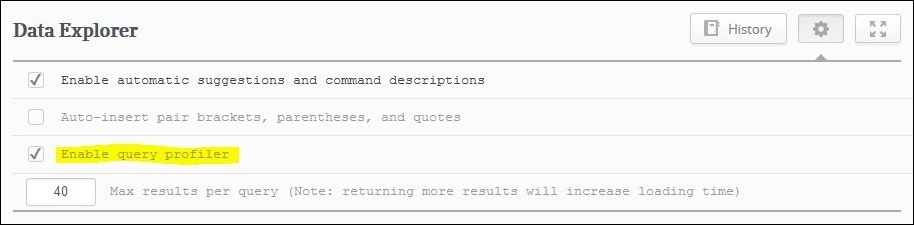
The first step is to enable the query profiler. You can do this from the Data Explorer section of the web interface by clicking on the Options icon and checking the Enable query profiler checkbox, as you can see from the following screenshot:
Now that it is enabled, we can run the query once again to see the profiler in action:
r.db('test').table('people').filter(r.row('name').eq('Alex'))The output you get will be very similar to this:
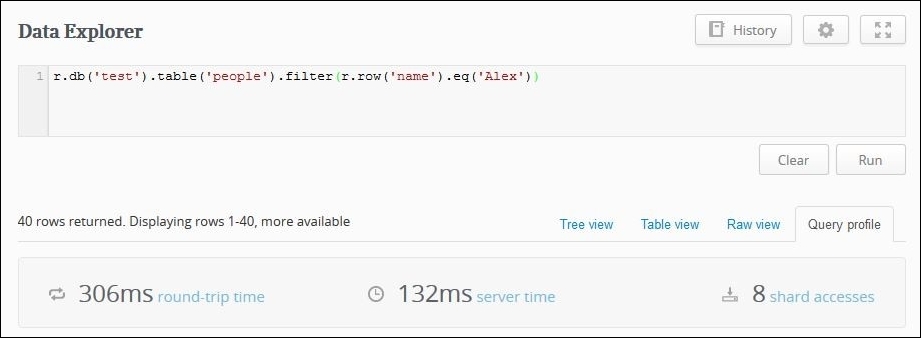
As you can see, the query profiler gives us quite a bit of information on the query execution. Probably, the most useful piece of data is the server-time; on my system is took 132 milliseconds for RethinkDB to run the query.
Although, this may seem a very short time, an average query usually takes less than 10 milliseconds to present a result. The reason why this query takes such a long time is because, as we said in the previous section, this query performs a full table scan.
In the following section, we will look at how to use an index to optimize this query and then use the query profiler to test its performance.