Humans are very social creatures, and our ability to find connections – with each other and with other things in our lives – is one of our strongest impulses. We naturally love to connect with others, we distinguish our connections with different names or levels (friend, spouse, acquaintance, lover, enemy, BFF, frenemy, boss, employee, stranger, co-worker, neighbor), and we sometimes keep these connections for years or decades. We are fascinated by seeing people from our network appearing in other, seemingly unconnected networks. We love the notion that there might be only six (or four, or three) degrees of separation between any two people on Earth. The small world phenomenon reminds us that we are more closely connected to each other than it may appear.
So far in this book, we have experimented a lot with finding connections between things, first by finding items that are commonly associated, and then by finding entities that appear different but are really the same. In this chapter, we will continue to explore how things are connected, but we will focus on data that can be represented as a network. We will learn:
- The basics of network theory, including how to measure a network
- Why the different shapes that we find in a network are interesting
- How to organize some real-world data into a structure that will let us analyze it as a network
- How to find and interpret patterns in this real-world data using Python and NetworkX
- How to compare multiple versions of a network to see how the network has changed over time
Networks are all around us. We use the word network to refer to many different types of connected things: multiple computers hooked together, a system of cities connected by small roads and large highways, a group of people who all work in the same industry, a series of television stations that broadcast common programming. In common usage, the word network can refer to almost any set of interconnected entities.
From a data mining perspective, however, our use of the word network is more precise. We use the word network to refer to a system that can be represented by a graph made up of nodes and links. In our specialized vocabulary, nodes are the things being connected, and the links are the relationships between the nodes. The collection of all the nodes and links is called a graph. Note that we are using the word graph in its mathematical sense, not in the sense of a visualization, like a bar graph or a line graph. In graph theory vocabulary, nodes are also called vertices, and links are also called edges. Figure 1 shows some of these terms we use for a graph or network:
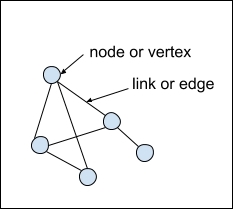
Figure 1. The parts of a network
Many times we describe the network in terms of the direction of the edges. A network can be either directed or undirected. An undirected network is one in which all the links are symmetrical, and the relationship between nodes goes in both directions. A common example of an undirected social network is Facebook. Both nodes in a Facebook friend relationship must confirm the link. Directed networks are when the links are not symmetrical. An example of a directed social network is Twitter. You can follow someone on Twitter but not have that person follow you back. Figure 2 shows the difference between an undirected and directed graph:
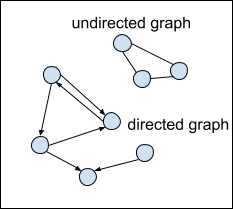
Figure 2. Directed and undirected graphs
In network mining, we may sometimes be interested in the attributes of the nodes. For instance, in the cities-and-roads network, we might keep track of how many people live in each city, or who the current mayor of the city is. But unlike in traditional entity-oriented data mining, in network mining we are also very interested in the attributes of the edges. How many people drove from Smallville to Anytown using Highway 1? How many people went the other way, from Anytown to Smallville? What is the minimum number of roads we would need to take to get from Anytown to Big City?
A weighted network is where one of the attributes of the links is expressed as a number. For example, in a network of airports, where the links are direct flights between airports, one weight could be how many flights there are per day. Another weight for this network could be number of passengers that fly between those airports per day. An unweighted network simply shows the relationship or link between the nodes, with no additional information about how heavy that link is. Figure 3 shows different combinations of weighted, unweighted, directed, and undirected graphs:
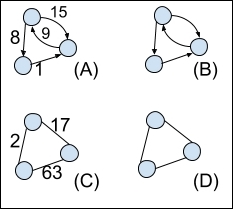
Figure 3. Graph (A) is directed, weighted. (B) is directed, unweighted. (C) is undirected, weighted. (D) is undirected, unweighted.
Here are some ways of expressing real-world networks as graphs:
- An e-mail network: The nodes could be people, and the links could represent sent an e-mail to. This would be a directed graph, since there is no rule that if Person A e-mails Person B, that e-mail will be answered. This graph could be weighted with the number of e-mails sent in that direction.
- The Web: The vertices could be web pages, and the edges could represent includes a URL to. This would be a directed graph. It could be weighted, if we were interested in how many links Page A included for Page B. If we did not include this information, it would be an unweighted, directed graph.
- Facebook likes: The nodes could be people, and the edges could be clicked like on something posted by. This could be a directed, weighted graph.
- Facebook friends: The nodes could be people, and the edges could be are friends with. Since Facebook friendship is a two-way street, this could be an undirected, unweighted graph. If we wanted to weight it, we could add a value to the link, such as number of friends in common.
- Shopping basket items: The nodes could be the items, and the edges could be shared a shopping basket with. This could be an undirected graph and the number of times these items appeared in the basket together could be the weight.
Note
You might think that the last example of shopping baskets sounds awfully familiar to what we did with frequent itemsets and association rules in Chapter 2, Association Rule Mining. Should we go back and revise that chapter now that we have another way to find frequent itemsets? Maybe, but we still have a lot to learn first. First, we would need to express the entire set of items and transactions as a weighted graph. Then we will need to learn how to find the frequent subgraphs, which would be the equivalent of our frequent itemset mining.. Doing this requires that we learn how to measure the network and traverse, or walk, the graph. So let's learn those things next.