14
A Method of Big Data Collection and Normalization for Electronic Engineering Applications
Data collection and storage have become the greatest challenges and tedious processes in data science engineering. Data from various nodes (sensors, bridges, switches, hubs, etc.) in the environment or in a particular system is collected at the nodes from which they arrive at the storage point. These types of operations need a separate workforce to monitor the whole process of data handling. This proposed work mainly focuses on the data analytics of creating normalized data from unprocessed data. This reduces the manipulation of data when it is of a different form. The data may be realistic depending on the system which produces it. The normal distribution applies to the collected data to create a dataset that is distributed over the continuous probability density function. It extends up to infinity in both directions of the axes. The proposed work provides an easy storage and data retrieval method in the case of large data volumes. The proposed data recovery is compliant with the conventional data collection methods. This type of data interpretation provides security and confidentiality of the user’s data.
14.1. Introduction
Data science has long been prevalent in all areas of science in this digital era. Data science is an interdisciplinary field that fuses science and technologies by using algorithms, tasks and devices to extract usable data from raw unstructured data. The extracted data is applied to various domains to gain insights from the data acquired to refine the required data through efficient searches. George and Groza (2019) introduced a concept of the extract-transform-load (ETL) that used graduate attributes in the common form of places and details. Separate attention was given to the transformation procedures that helped to get two different reports as final results. The reports were the graduate attribute report per cohort (GAR/C) and course progression report per cohort (CPR/C). The GAR/C accessed each attribute based on the average and the CPR/C showed the tracking information based on the achievement made by the students in their program. The reports were generated synchronously at the same time to enhance the ETL efficiency. The model paved the way for the integrated assessment of the database based on the granularity of the ETL. Sulaiman et al. (2019) came up with incorporating information and communication technologies (ICT) in the power industry by applying modernization concepts to it. That field is the smart power grid, which integrates all the smart meters used in that grid. It collects an enormous amount of data from these smart meters and processes the huge data in the centralized servers to control the entire grid, making it easier to control and observe from a remote location. In this work, the smart meters act as a backbone of this smart grid. The data science is used to process this huge data, thereby benefitting the user and also the energy supplier in that domain of engineering.
Ghosh and Grolinger (2019) investigated the merging of cloud and edge computing for IoT data analytics and came up with a deep learning (DL)-based system to define the data processing along with ML concepts. The encoder is widely used in all the nodes to reduce data congestion while reading data from the sensors. These kinds of reduced data from the devices make the big data feasible to the application. This data has been used directly by the ML algorithm to expand the original features with the help of a decoder present in the auto-encoder module. McHann (2013) developed a strategy of collecting data from all the nodes at present and processing it further at a later stage. But this method involves data to be stored in lot of storage devices. The large volumes of data have to be stored in the cloud to perform ML at later stages. As the data storage capacity increases, the need for technology infrastructure increases, skill sets to work in that infrastructure increase and it is also expensive in terms of time and budget (Bhuiyan et al. 2017). This chapter has been organized as follows. Section 14.2 elaborates on the machine learning models in materials science and its application in Electronic Engineering. It also discusses data acquisition by supervised learning and outlines accessing data repositories and the data storage, respectively. This section describes the comparison of the predicted and the actual values. Section 14.3 illustrates the application of machine learning in electronic engineering. Finally, Section 14.4 concludes the work and recommends the future aspects.
14.2. Machine learning (ML) in electronic engineering
Machine learning (ML) has a wide range of applications in the semiconductor industry. ML in this industry has two different phases of application such as:
- –training phase – algorithm to get results;
- –inference phase – response to stimuli.
The application of ML in semiconductors includes learning from the data. The data has been acquired from the databases or clouds called repositories. Numerous researchers around the globe perform their simulations and experiments and provide their valuable results in the common cloud to prove their integrated research (Karmawijaya et al. 2019; Naveen Balaji et al. 2019; Balaji et al. 2020; Malini et al. 2020). By accessing the data repositories, the ML user can retrieve usable data by using efficient algorithms and refining the model. The model can be trained in this environment by undergoing several searches and improved by the feedback given (Malini et al. 2020).
The various procedural steps in ML are as follows:
- –acquiring data from the repository;
- –handling acquired data by algorithms;
- –supervised learning by predictive models;
- –unsupervised learning through patterns that exist between I/O;
- –experimental procedures design for materials science;
- –cyberinfrastructure – data platforms.
Data acquisition is the initial step in ML where data has been extracted from the data repositories based on the user’s search (Malini et al. 2019). The next step is learning from the data based on mathematical applications such as correlation and regression. Supervised learning (SL) is the method of backtracking the inputs from the outputs, thereby establishing the relationship between the input and output pairs (Casula et al. 2019; Gowthaman and Srivastava 2021a, 2021b; https://www.wolframalpha.com). SL has been the most prevalent research area in the ML platform to refine the model created. Unsupervised learning (UL) is the method of creating the algorithm to study the pattern behaviors that exist between the input and output. The UL is the most time-consuming process that needs a revision of the pattern and creates the model (Kampker et al. 2018). The design of experimental procedures plays a major role in the design of the ML model. This needs a lot of procedures and algorithms to be used in the ML model (Moradi et al. 2020). Hence, cyberinfrastructure comes into existence. The famous cyberinfrastructures are Citrine, The Materials Project, Wolfram Alpha, KIM and Materials Data Facility (MDF) for materials science research (Karpatne et al. 2017; Tanifuji et al. 2019; Liu and Shur 2020; Gowthaman and Srivastava 2021c).
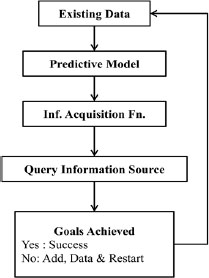
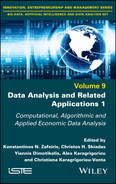
Figure 14.1. The flow of machine learning platform for materials science (Karmawijaya et al. 2019)
The flow of the ML platform for the materials science project has been illustrated in Figure 14.1. The existing data is present in the data repositories submitted by researchers around the globe. The predictive model suggests the test run of the search of the properties of the particular material (Kampker et al. 2018). The search results have been shared with the information acquisition system for further processing. The information acquisition system collects the search results from above and sends the data packets for verification based on the query made on the web front of the cyberinfrastructure (Liu and Shur 2020). The query has been recorded in the database of the query information source register. The next step of this process is the verification of the goals given to the results obtained (Karpatne et al. 2017).
14.2.1. Data acquisition
Data acquisition is the most important aspect of data analytics in the materials science domain. The individual researcher has to devise a platform to make sure the data acquired is legit and correct as per the requirement (Casula et al. 2019). Every individual researcher has to collaborate with researchers around the world to make an integrated search based on the big data (McHann 2013; Moradi et al. 2020). The next step is the extraction of the result with the publication metric from the open repositories. The cyberinfrastructures are the larger databases of information from many researchers. ML has been used to extract the data required efficiently.
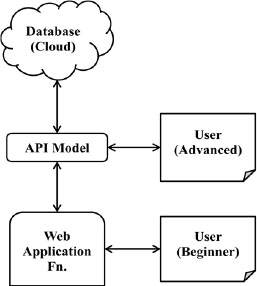
Figure 14.2. Data acquisition process in ML (Gowthaman and Srivastava 2021b)
The application program interface (API) is a set of rules or even algorithms to extract the required data from larger datasets (Hack and Papka 2015). The API is widely used by advanced ML users. Beginners always uses a web application function before the API to train the model. The efficient API model is supported by the web function created to enhance the search.
14.2.2. Accessing the data repositories
The high-ƙ dielectrics have to be chosen for the double-gate (DG) MOSFET designs. The selection of the high-ƙ dielectric material plays a major role in the operation of the MOSFET with negligible short channel effects (SCEs) (Hack and Papka 2015; Feng et al. 2019; Gowthaman and Srivastava 2021d). The dielectric properties of the material compounds are derived from the periodic table for analysis. This work concentrates the web front Wolfram Alpha to predict the values of high-ƙ dielectric for the suitable inclusion in the DG MOSFET design (Gowthaman and Srivastava 2021d). A computational intelligence platform like Wolfram Alpha uses ML procedures to select particular required properties of the chemical compounds. The dielectric compounds discussed are Al2O3, HfO2, ZrO2, La2O3, SiO2, etc. (He et al. 2018; Ghosh and Grolinger 2019). The advantages of the data repository are that it is easy to use and predict results using an Internet platform. But this has become labor-intensive in case of frequently used materials as they have many combinations of compounds. Examples of application programming interfaces (APIs) are the databases – ACK, Citrine Informatics, OQMD, Wolfram Alpha, etc. (Chen et al. 2018).
14.2.3. Data storage and management
Data storage is done in any one of the following formats: .csv (comma separated values), Numpy arrays, Matlab, pandas. The .csv files are simple and good for storage in programs like MS Excel (https://www.wolframalpha.com).
Table 14.1. Dataset based on electronic simulation
| Electronic simulation dataset (× 1017) | ||||||||
| Set 1 | Set 2 | Set 3 | Set 4 | Set 5 | Set 6 | Set 7 | Set 8 | Set 9 |
| 2.70 | 1.65 | 1.65 | 3.29 | 1.36 | 1.36 | 3.30 | 1.35 | 1.35 |
| 2.70 | 1.65 | 1.65 | 3.29 | 1.36 | 1.36 | 3.30 | 1.35 | 1.35 |
| 2.70 | 1.65 | 1.65 | 3.29 | 1.36 | 1.36 | 3.30 | 1.35 | 1.35 |
| 2.70 | 1.65 | 1.65 | 3.29 | 1.36 | 1.36 | 3.30 | 1.35 | 1.35 |
| 2.70 | 1.65 | 1.65 | 3.28 | 1.35 | 1.35 | 3.30 | 1.35 | 1.35 |
| 2.70 | 1.66 | 1.66 | 3.28 | 1.35 | 1.35 | 3.30 | 1.35 | 1.35 |
| 2.70 | 1.66 | 1.66 | 3.28 | 1.35 | 1.35 | 3.29 | 1.35 | 1.35 |
| 2.70 | 1.66 | 1.66 | 3.27 | 1.34 | 1.34 | 3.29 | 1.35 | 1.35 |
| 2.70 | 1.65 | 1.65 | 3.27 | 1.32 | 1.32 | 3.29 | 1.34 | 1.34 |
| 2.70 | 1.66 | 1.66 | 3.25 | 1.30 | 1.30 | 3.29 | 1.34 | 1.34 |
Table 14.2. Consolidated dataset after normalization
| Normalized dataset (× 1017) based on Table 14.1 | ||||||||
| Set 1 | Set 2 | Set 3 | Set 4 | Set 5 | Set 6 | Set 7 | Set 8 | Set 9 |
| 0.9992 | 0.9337 | 0.9337 | 0.9999 | 0.8486 | 0.8486 | 0.9999 | 0.8475 | 0.8475 |
| 0.9992 | 0.9337 | 0.9337 | 0.9999 | 0.8486 | 0.8486 | 0.9999 | 0.8475 | 0.8475 |
| 0.9992 | 0.9337 | 0.9337 | 0.9999 | 0.8484 | 0.8484 | 0.9999 | 0.8474 | 0.8472 |
| 0.9992 | 0.9337 | 0.9337 | 0.9999 | 0.8480 | 0.8805 | 0.9999 | 0.8472 | 0.8475 |
| 0.9992 | 0.9338 | 0.9338 | 0.9999 | 0.8473 | 0.8473 | 0.9999 | 0.8469 | 0.8464 |
| 0.9992 | 0.9345 | 0.9345 | 0.9999 | 0.8462 | 0.8462 | 0.9999 | 0.8464 | 0.8466 |
| 0.9992 | 0.9346 | 0.9346 | 0.9999 | 0.8443 | 0.8443 | 0.9999 | 0.8456 | 0.8469 |
| 0.9992 | 0.9346 | 0.9346 | 0.9999 | 0.8409 | 0.8409 | 0.9999 | 0.8445 | 0.8444 |
| 0.9992 | 0.9337 | 0.9337 | 0.9999 | 0.8359 | 0.8359 | 0.9999 | 0.8428 | 0.8428 |
| 0.9992 | 0.9346 | 0.9346 | 0.9999 | 0.8280 | 0.8280 | 0.9999 | 0.8407 | 0.8407 |
The Numpy arrays are good for mathematical operations and processing. Sometimes, MATLAB data files can be used but this involves a large amount of computation and system memory. The pandas file type has been used in sorting, parsing and storage (also called the excel of python). These data formats remove data based on logic operations and plot the values accurately (Malini et al. 2019, 2020). The data stored in the system can be used for further processing based on the needs of the user. The dataset based on the electronic simulation, which shows the electron density in the valley, has been tabulated in Table 14.1. The normalized data after statistical processing performed in the raw data has been illustrated in Table 14.2.
14.3. Electronic engineering applications – data science
The physical vapor deposition method to create the elemental compounds using various elements has been illustrated in Figure 14.3. The marked items are the compounds which have been used in electronic engineering and applied to the DG MOSFETs to get rid of SCEs. The compounds are as follows lanthanum, gallium, aluminum and hafnium (Mohammadi et al. 2018). Their properties have been analyzed for effective usage in electronic applications. The inkjet method of forming the same compounds has been portrayed in Figure 14.4 for further analysis. These elements have been displayed for the number of material level analyses to create/deposit the material (Singh et al. 2017; Singh and Srivastava 2018; Gowthaman and Srivastava 2021e).
Figure 14.3(a). Dataset derived from the physical vapor deposition device for various high-ƙ dielctric and semiconductor materials. For a color version of this figure, see www.iste.co.uk/zafeiris/data1.zip
These methods highly depend on the ionic packaging value of the particular material. Using ML, the time taken to create the material has been reduced drastically (Chen et al. 2018; Gowthaman and Srivastava 2021e).
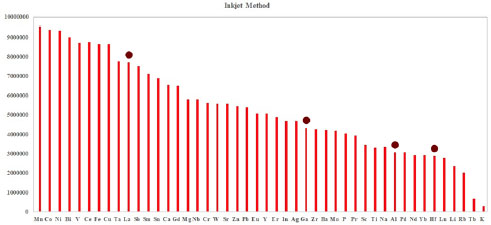
Figure 14.3(b). Dataset derived from the inkjet method for various high-ƙ dielctric and semiconductor materials. For a color version of this figure, see www.iste.co.uk/zafeiris/data1.zip
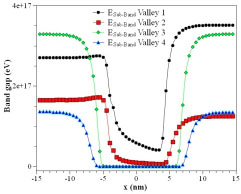
Figure 14.4. Simulation data for energy sub-bands for valleys of the DG MOSFET. For a color version of this figure, see www.iste.co.uk/zafeiris/data1.zip
This work mainly focuses on the easy storage of the data and its efficient retrieval on demand. This concentrates on the large data volumes of databases called cyber infrastructures (Feng et al. 2019). The data recovery projected in this work had been submissive to the conventional method of data retrieval. The comparison of the previous researches results in good agreement with the novel data retrieval technique. The confidentiality and the security of the user’s data was ensured by normalization of the raw data. The unauthorized user cannot determine the type of data they visualize since it is in a normalized form. Hence, normalizations of the data had given enormous capability of security and confidentiality in the cloud-based data query. The electronic engineering field has been enhanced by the usage of normalization and other statistic modeling of the raw data in order to process it. ML reduces the data processing and data storage compared to non-ML-based statistical models.
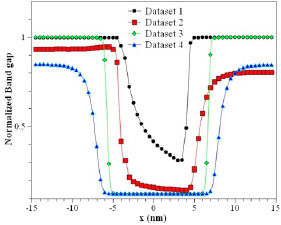
Figure 14.5. Normalized dataset for energy sub-bands attained for the same. For a color version of this figure, see www.iste.co.uk/zafeiris/data1.zip
14.4. Conclusion and future work
The enhanced database architecture and the data storage facilities facilitate the access of databases through larger query and its assessment. The big data was introduced in this work to reduce human work and data analysis. The normalization of the data helps the user to create a detailed analysis in terms of the processed data. The idea of ML can be further improved in theoretical form to apply statistics models in the raw data to perform quicker processing. Training is not required at the data user end since it uses automated processing of raw data and reporting of the additional queries.
14.5. References
Balaji, N., Sethupathi, M., Sivaramakrishnan, N., Theeijitha, S. (2020). EDF-VD scheduling- based mixed-criticality cyber-physical systems in smart city paradigm. Inventive Communication and Computational Technologies, Lecture Notes in Networks and Systems, 89, 931–946.
Bhuiyan, S.M.A., Khan, J.F., Murphy, G.V. (2017). Big data analysis of the electric power PMU data from the smart grid. SoutheastCon 2017, Concord, NC, USA, 30 March– 2 April 2017, pp. 1–5.
Casula, L., D’Amico, G., Masala, G., Petroni, F., Sobolewski, R.A. (2019). Performance estimation of a wind farm with a copula dependence structure. 18th Applied Stochastic Models and Data Analysis International Conference with Demographics Workshop, Florence, Italy, 11–14, June 2019.
Chen, K., He, Z., Wang, S.X., Hu, J., Li, L., He, J. (2018). Learning-based data analytics: Moving towards transparent power grids. CSEE Journal of Power and Energy Systems, 4(1), 67–82.
Feng, M., Zheng, J., Ren, J., Hussain, A., Li, X., Xi, Y., Liu, Q. (2019). Big data analytics and mining for effective visualization and trends forecasting of crime data. IEEE Access, 7, 106111–106123.
George, A. and Groza, V. (2019). Information analytics system database for uniform approach to continuous engineering program improvement. 15th International Conference on Engineering of Modern Electric Systems (EMES), Oradea, Romania, 13–14, June 2019, 185–188.
Ghosh, A.M. and Grolinger, K. (2019). Deep learning: Edge-cloud data analytics for IoT. IEEE Canadian Conference of Electrical and Computer Engineering (CCECE), Edmonton, AB, Canada, 5–8 May 2019, pp. 1–7.
Gowthaman, N. and Srivastava, V.M. (2021a). Analysis of n-type double-gate MOSFET (at nanometer scale) using high-K dielectrics for high-speed applications. 44th International Spring Seminar on Electronics Technology, Advancements in Microelectronics Packaging for Harsh Environment, Dresden, Germany, 6–7, May 2021, 130–131.
Gowthaman, N. and Srivastava, V.M. (2021b). Analysis of InN/La2O3 twosome for double-gate MOSFETs for radio frequency applications. Third International Conference on Materials Science and Manufacturing Technology (ICMSMT 2021), Coimbatore, India, 8–9 April 2021, 1–10.
Gowthaman, N. and Srivastava, V.M. (2021c). Dual gate material (Au and Pt) based double-gate MOSFET for high-speed devices. IEEE Latin America Electron Devices Conference (LAEDC), Mexico, 19–21 April 2021, 1–4.
Gowthaman, N. and Srivastava, V.M. (2021d). Design of hafnium oxide (HfO2) sidewall in InGaAs/InP for high-speed electronic devices. International Conference on Materials Sciences and Nanomaterials, London, UK, 12–14 July 2021, 1–6.
Gowthaman, N. and Srivastava, V.M. (2021e). Capacitive modeling of cylindrical surrounding double-gate MOSFETs for hybrid RF applications. IEEE Access, 9, 89234–89242.
Hack, J.J. and Papka, M.E. (2015). Big data: Next-generation machines for big science. Computing in Science & Engineering, 17(4), 63–65.
He, X., Chu, L., Qiu, R.C., Ai, Q., Ling, Z. (2018). A novel data-driven situation awareness approach for future grids – Using large random matrices for big data modeling. IEEE Access, 6, 13855–13865.
Kampker, A., Kreisköther, K., Büning, M.K., Möller, T., Windau, S. (2018). Exhaustive data- and problem-driven use case identification and implementation for electric drive production. 8th International Electric Drives Production Conference (EDPC), Schweinfurt, Germany, 4–5 December 2018, 1–8.
Karmawijaya, M.I., Nashirul Haq, I., Leksono, E., Widyotriatmo, A. (2019). Development of big data analytics platform for electric vehicle battery management system. 6th International Conference on Electric Vehicular Technology (ICEVT), Bali, Indonesia, 18–21, November 2019, 151–155.
Karpatne, A., Atluri, G., Faghmous, J.H., Steinbach, M., Banerjee, A., Ganguly, A., Shekhar, S., Samatova, N., Kumar, V. (2017). Theory-guided data science: A new paradigm for scientific discovery from data. IEEE Transactions on Knowledge and Data Engineering, 29(10), 2318–2331, 1 October 2017.
Liu, X. and Shur, M.S. (2020). TCAD model for TeraFET detectors operating in a large dynamic range. IEEE Transactions on Terahertz Science and Technology, 10(1), 15–20.
Malini, P., Poovika, T., Shanmugavadivu, P., Priya, I.R.P., Balaji, G.N., Rajotiya, R.N., Kumar, A., Mashette, G. (2019). 22nm 0.8V strained silicon-based programmable MISR under various temperature ranges. American Institute of Physics – CF, 2087(020004), 020004-1–020004-12.
Malini, P., Kokila, S., Karthiga, M., Naveen Balaji, G. (2020). Design of hybrid full adder using full swing and non-full swing XOR XNOR gates. TEST Engineering and Management, January–February 2020, 2778–2787.
McHann, S.E. (2013). Grid analytics: How much data do you really need? IEEE Rural Electric Power Conference (REPC), Stone Mountain, GA, USA, 28 April–1 May 2013, C3–1–C3–4.
Mohammadi, M., Al-Fuqaha, A., Sorour, S., Guizani, M. (2018). Deep learning for IoT big data and streaming analytics: A survey. IEEE Communications Surveys & Tutorials, 20(4), 2923–2960.
Moradi, J., Shahinzadeh, H., Nafisi, H., Marzband, M., Gharehpetian, G.B. (2020). Attributes of big data analytics for data-driven decision making in cyber-physical power systems. 14th International Conference on Protection and Automation of Power Systems (IPAPS), Tehran, Iran, 83–92.
Naveen Balaji, G., Karthiga, M., Swetha, D., Suchitra, M. (2019). Low power design of 0.8V based 8 bit content addressable memory using MSML implemented in 22nm technology for aeronautical applications. International Journal of Recent Technology and Engineering, 8(2S11), 2688–2694.
Singh, M. and Srivastava, V.M. (2018). An analysis of key challenges for adopting the cloud computing in the Indian education sector. Communications in Computer and Information Science, 905(1), 439–448, Chapter 44, Springer, Singapore.
Singh, M., Srivastava, V.M., Gaurav, K., Gupta, P.K. (2017). Automatic test data generation based on multi-objective ANT LION optimization algorithm. 28th Annual Symposium of the Pattern Recognition Association of South Africa and 10th Robotics and Mechatronics International Conference of South Africa (PRASA-RobMech-2017), Bloemfontein, South Africa, 30 November–1 December 2017, 168–174.
Sulaiman, S.M., Jeyanthy, P.A., Devaraj, D. (2019). Smart meter data analysis issues: A data analytics perspective. IEEE International Conference on Intelligent Techniques in Control, Optimization and Signal Processing (INCOS), Tamilnadu, India, 11–13, April 2019, 1–5.
Tanifuji, M., Matsuda, A., Yoshikawa, H. (2019). Materials data platform – A FAIR system for data-driven materials science. 8th International Congress on Advanced Applied Informatics (IIAI-AAI), 7–11 July 2019, 1021–1022.
Chapter written by Naveenbalaji GOWTHAMAN and Viranjay M. SRIVASTAVA.