In the previous chapters, you were introduced to Azure Synapse Analytics and Synapse Studio. Azure Synapse Analytics offers a lot of features that are flexible and highly scalable. Some of the extensibility features of Azure Synapse Analytics are the ability to use the modern data warehouse approach to serve meaningful reports and a data source for machine learning.
There are many ways to process and visualize data using Azure and the wider set of tools offered by Microsoft. This book will focus on using Power BI as a tool to create reports and dashboards. Power BI offers a wide range of products and services. This chapter will take a look at using Power BI Desktop on Windows to create meaningful dashboards as well as using Power BI workspaces to host and share published reports.
This book will also give you an introduction to the artificial intelligence and machine learning ecosystem within Azure and Microsoft. We will tackle a specific machine learning platform in later sections using Azure Machine Learning.
These technologies work seamlessly with Azure Synapse Analytics as a default approach to visualizing and gaining insights from a unified data warehouse.
Power BI
Power BI is a suite of tools that enables users to visualize data and share insights across teams and organizations, or embed dashboard analytics in their websites or applications. It supports different data sources (both structured and unstructured data types) and helps analysts and end users create live dashboards and reports about business data on-demand. An example of this is visualizing company sales for recent months and determining the city that sold the most items.
What makes Power BI different from spreadsheet software such as Microsoft Excel is that it is designed to be a hosted user interface, often a live dashboard, where users don't need to frequently store a file in their local machine and open it. With Power BI, you can leverage the power of the cloud to harness complex data and present it through rich graphs or charts, letting the server run all the computations rather than your own machine. Imagine a scenario where your data size was to grow from 500 megabytes to several gigabytes. Most general-purpose machines, such as personal computers with a limited amount of memory, would struggle to load such an Excel file; however, with Power BI, it is just like opening a web page as it is a hosted service:

Figure 3.1: Power BI architecture
As seen in Figure 3.1, Power BI is composed of different components that can perform different functions:
- Power BI Desktop: This is a Windows desktop-based application that is often referred to as an authoring tool, where you primarily design and publish reports to the service.
- Power BI Service: This is the managed platform to deploy your reports on the web for your organization to access. It is a Software as a Service (SaaS) application and has evolved from being Power BI for Office 365 to just Power BI.
- Power BI Mobile Apps: These are native mobile applications that can access reports from a workspace that is hosted in Power BI. It is available on the Apple iOS App Store and Google Play Store.
- Power BI Gateways: A Gateway is a mechanism to sync external data into Power BI. For enterprise scenarios with on-premises storage, a Power BI Gateway acts as a mechanism to query against the data source without the need to transfer databases to the cloud. However, the data that is hosted in Power BI reports lives within the Azure Cloud.
- Power BI Report Server: In an on-premises scenario, Power BI Report Server allows you to host Power BI reports within your own data center. These reports are still shareable across different members, as long as they have the right network access.
- Power BI Embedded: Embedded allows you to white label Power BI in your own custom applications. It is often strategically integrated into existing dashboards and back-office systems where only a single set of users can access the reports.
Features and benefits
At a high level, Power BI offers the following benefits:
- Personalized dashboards that allow analysts to brand the look and feel of the graphs, charts, and tables
- Collaboration across different users
- Governance and security that ensures that only authorized users can access dashboards
- No memory or speed constraints, as it is a cloud-hosted service. It is as if the user is just loading a web page
- Seamless integration with existing applications to create rich and bespoke dashboard analytics
- No specialized technical support is required, as reports are meant to be easy to interact with
- Support for advanced data services, such as the "Ask a Question" feature, integration with R, segmentation, and cohort analysis
Power BI is an intuitive tool that often just requires clicking or dragging-and-dropping in order to quickly access and visualize data. The authoring tool, Power BI Desktop, is equipped with many built-in features to derive analytics. It is smart enough to suggest a visualization model based on the fields of your choice.
Power BI dashboards and reports are highly customizable and allow you to personalize your experience depending on your branding. You can select themes, use custom charts, create labels, insert drawings and images, and a lot more.
Compared to sending an email with a PowerPoint file attached, Power BI allows an open collaboration between analysts and other members of the company just by sharing a centralized dashboard. You can access reports using major web browsers or by means of mobile applications that you can download from the Apple App Store and Google Play Store. People can send comments and annotations about the reports, creating a faster feedback loop with the use of alerts and notifications.
Power BI is secure in different facets and areas. For one, when authoring a report, it is ensured that you can only access data sources that you have been granted access to. This is backed by Row-Level Security (RLS). For example, analysts can only access data that is local to their region, making sure they don't have access to another city or country's data. Once you are ready to share the report, you can quickly save it to your personal workspace. You can select whomever you want to share the report with across your organization, or invite users from external tenants.
If you wish to start small while learning Power BI, you can start by just using Excel files as your data source. There are scenarios where analysts receive a CSV file from data engineers because the size of the dataset is not too large.
In an enterprise scenario, engineers and analysts have to deal with various data sources and platforms to create a unified dashboard. This is often a challenge, especially when data is not available for analysts to perform their exploration. This is where a combination of Power BI and Azure Synapse Analytics can be very useful.
Power BI and Azure Synapse Analytics
Power BI is a very flexible platform that can work with multiple data sources. It could be a source as simple as an Excel file, a database on-premises or in the cloud, or a data warehouse. One of the best practices for having a modern data warehouse is separating the duty of processing data from data visualization. That is where Azure Synapse Analytics comes in.
Azure Synapse Analytics, with the use of a dedicated SQL Pool, can perform complex queries for all data sources and create a semantic model for Power BI. A semantic data model is a structured data format that Power BI can easily interpret for data visualization. This approach is scalable and eases a lot of the complexities of managing data across various teams.
Features and benefits
There are a lot of benefits to combining Power BI and Azure Synapse Analytics. Although there is no one-size that fits all, nor one tool to solve all of your data problems, the combination of Azure Synapse Analytics and Power BI can bring robust, elastic, and more maintainable data operations and lifecycles to your team:
- Unified data model: Treating Azure Synapse Analytics as the single source of truth will bring a unified data model for all consumer services of data, including Power BI. With this approach, everyone will be confident that data that is stored in the data warehouse (the Synapse workspace) has already been validated and pre-processed. This is very useful, especially for Power BI developers and analysts, meaning that they can focus on generating meaningful reports instead of wrangling disparate data sources.
- Scalable queries and data transformations: Power BI offers data querying capabilities by means of DirectQuery. This is very useful for small datasets. However, when datasets become massive, you will encounter some scalability problems and it will affect your reporting performance if you perform these operations directly in Power BI. Azure Synapse Analytics helps in this scenario by doing performance optimizations on large-scale queries by means of materialized views and result set caching. These sets of heavy compute operations are performed in an elastic cluster of SQL Pools to cater to scaling demand. With this approach, Power BI can focus on performing data visualization-related functions instead of worrying about the data preparation to serve for the reports.
- Centralized governance and security: Power BI comes with security features to protect the files and reports generated, such as the use of Azure Active Directory (Azure AD) to make sure that only specific workspaces and reports are shared to a group or users. With the help of Azure Synapse Analytics, data access can be further secured by implementing row-level and column-level security on a data tier rather than in data models. In a practical scenario, the database operations team can easily provision and restrict access to various data sources for Power BI consumption.
- Collaborative workspace: One of the challenges in running a business intelligence capability, especially in a large company, is the disparity between tools, teams, and policies. In a traditional scenario, these teams have a communication barrier but want to achieve the same goal, which is to leverage the power of data. Azure Synapse Analytics creates a collaborative experience for these teams wherein they all access the same web portal—Azure Synapse Studio. In a large organization, some teams might only need access to the Develop section of Synapse Studio, while others only access the Monitor section. Synapse Studio provides a unified look and feel to all members of the organization regardless of roles and responsibilities.
In this book, we will use Power BI to generate reports from the queries performed by the SQL Pool in a Synapse workspace. This chapter will focus on how you can leverage Power BI datasets in Synapse Studio.
There are different approaches to performing robust data visualization, but the main reason for using this approach (Power BI and Azure Synapse Analytics) is elasticity and the separation of duties. This combination facilitates a streamlined reporting capability at scale, even if you have billions of rows in your databases.
To understand further how Azure Synapse Analytics and Power BI work hand in hand, let's start with a simple quick start guide.
Quick start guide (Data modeling and visualization)
In this quick start guide, we will explore how we can use Azure Synapse Analytics with the use of an SQL Pool to capture COVID-19 data from Bing and display relevant reports to Power BI.
In order to perform this activity, you need the following:
- An active Azure subscription
- Power BI Desktop (Windows only)
- Power BI Pro License
- An Azure Synapse Analytics workspace
Let's get started.
Integrating Power BI with Azure Synapse Analytics
This activity will act as a step-by-step guide to integrating Azure Synapse Analytics with Power BI. We will be using the power of Azure Synapse Analytics to perform queries that will allow Power BI to visualize data without the need to perform complex transformations within your Power BI environment:
- The first thing we will do is to establish a connection between your Azure Synapse Analytics workspace and your Power BI workspace. To do this, go to Synapse Studio and go to the Manage section. Click on Linked services and then click on the + New button. Search for Power BI just like in Figure 3.2. Click on the Power BI option and click on Continue:
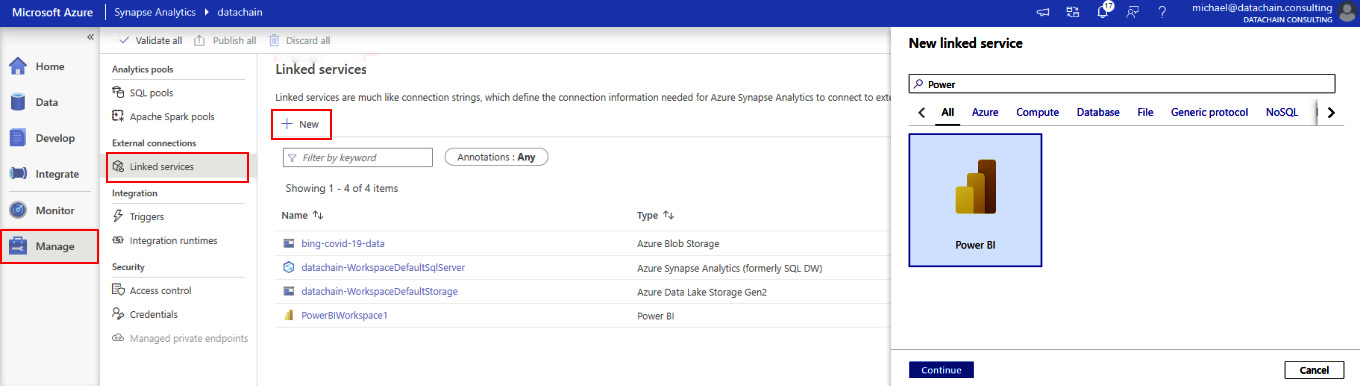
Figure 3.2: Integrating Power BI with Azure Synapse Analytics
- Fill in Name, Description, Tenant, and Workspace name for this linked service. Click on Create:
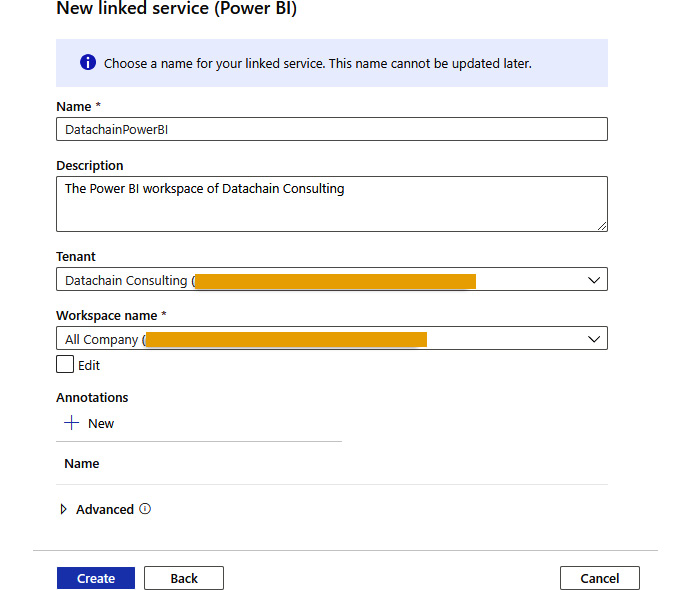
Figure 3.3: Creating a linked service
Follow these steps to create a database for storing data:
- After setting up the linked service with Power BI, it's time to create a database in order to store the sample data that we will capture in the next section. Go to the Data section of Synapse Studio and choose the Workspace tab. Click on the + button and then choose SQL database:
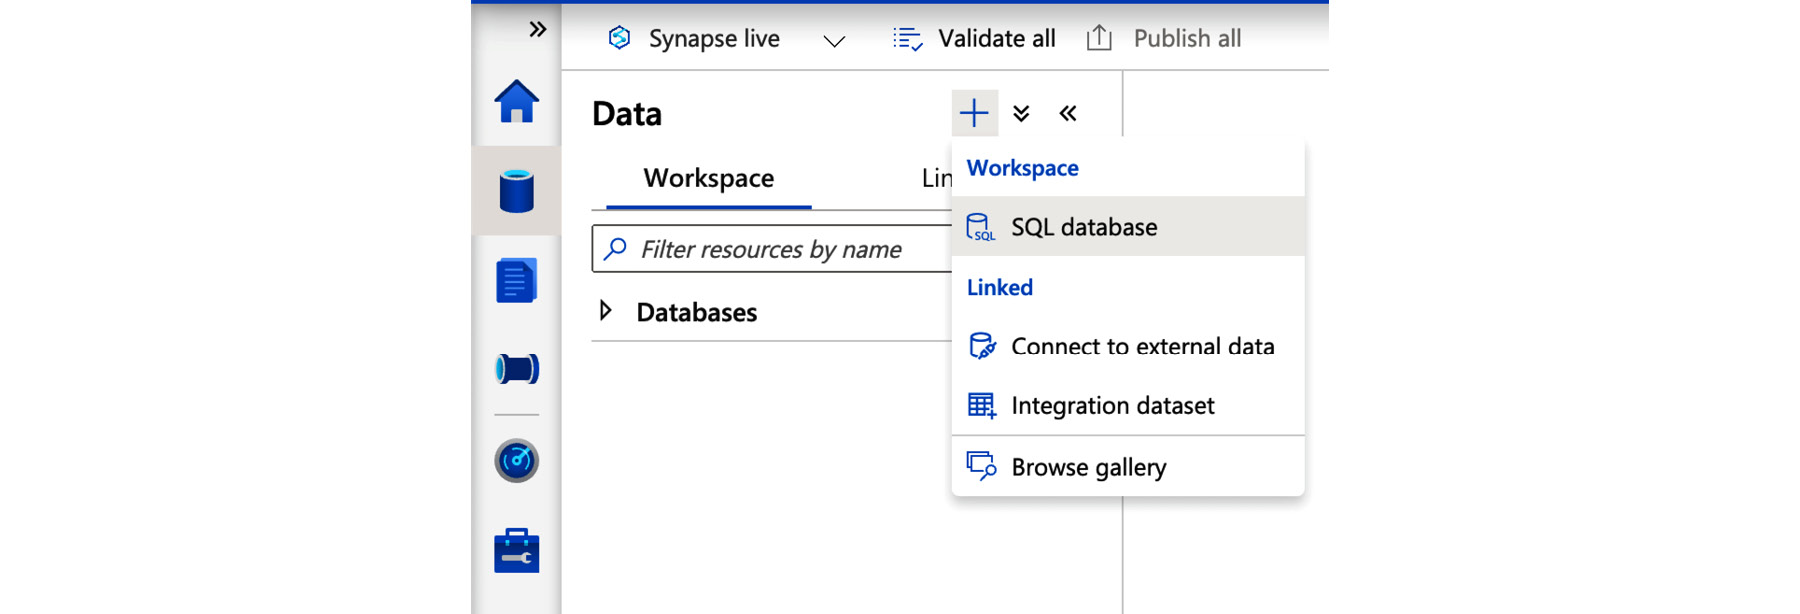
Figure 3.4: Creating an SQL database in Synapse Studio
- Choose the Serverless option and enter a database name. Click on Create:

Figure 3.5: Choosing an SQL pool type
Note
When setting up your Azure Synapse Analytics workspace, it comes with a built-in serverless SQL pool for you.
Upon the successful creation of the database, it should now appear in your workspace's list of databases.
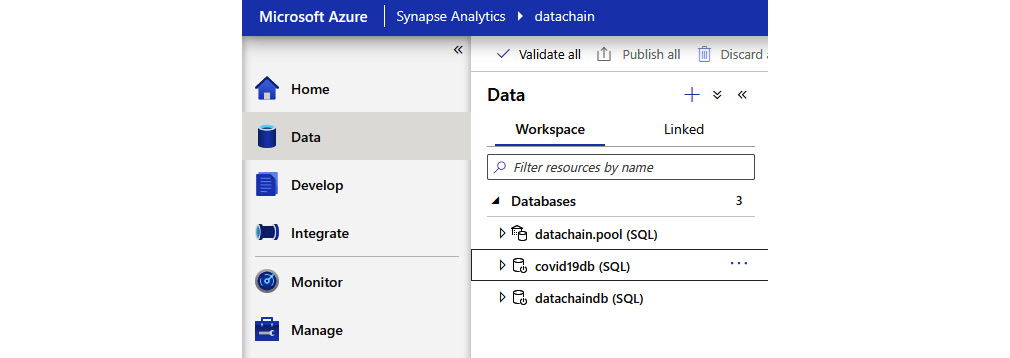
Figure 3.6: List of created databases in the Synapse workspace
Follow these steps for linking a dataset:
- The next part is capturing the COVID-19 data from Bing. On the same page (in the Data pane) where you created a database, click again on + and choose Browse gallery.
- Choose Bing COVID-19 Data from the Datasets tab and click on Continue:

Figure 3.7: Datasets gallery
You will then be brought to the terms and conditions page. Please read the licensing agreements to make sure you follow the fair use of these datasets. It will also show you a preview of some of the rows of that file. Click on Add dataset.
The dataset should now appear in your Linked data tab under Azure Blob Storage | Sample Datasets.

Figure 3.8: Adding the dataset to Azure Synapse Analytics using Azure Blob Storage
Transferring data to your database and running a query
After getting the sample dataset, it's now time to transfer that data to the SQL database that you created earlier:
- Right-click on the bing-covid-19-data folder followed by New SQL script and then choose Select TOP 100 rows:
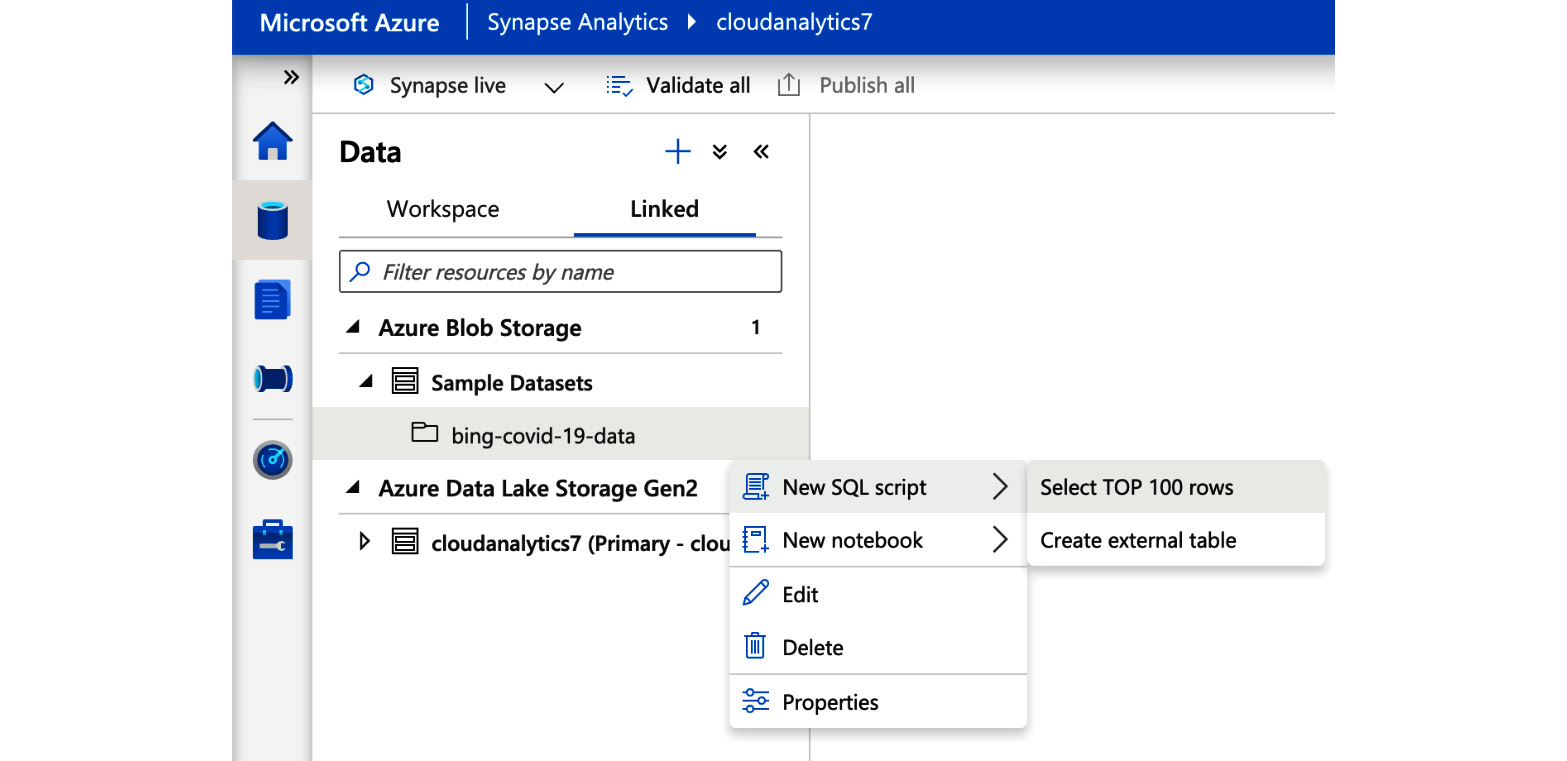
Figure 3.9: Creating a new query for selecting top100 rows
This will prompt you to a pre-filled SQL script development workspace. There are a couple of things that we will modify in this query.
- Make sure an SQL pool is selected as Built-in and the proper database is chosen in the Use database drop-down menu. The Azure Synapse Analytics workspace comes with a built-in SQL pool upon resource creation:

Figure 3.10: Choosing an SQL pool and database
We will modify the query to create a view based on a select statement from the Bing COVID-19 dataset:
-- Drop existing "Covid19View"
DROP VIEW IF EXISTS Covid19View;
GO
-- Create a View named "Covid19View"
CREATE VIEW Covid19View
AS
-- Select ALL data from the dataset however for this specific report.
-- we only want country level reports and excluding "Worldwide" and country regions.
SELECT
*
FROM
OPENROWSET(
BULK 'https://pandemicdatalake.blob.core.windows.net/public/curated/covid-19/bing_covid-19_data/latest/bing_covid-19_data.parquet',
FORMAT = 'parquet'
)
AS [result]
WHERE [country_region] != 'Worldwide'
And ( [admin_region_1] is NULL
Or [admin_region_1] = '' )
Note
In the actual report later in Power BI, you might see that other countries are missing. This is intended to simplify the exercise.
- In the Properties section, choose a good query name with an optional description. It's important that you choose the All rows option:
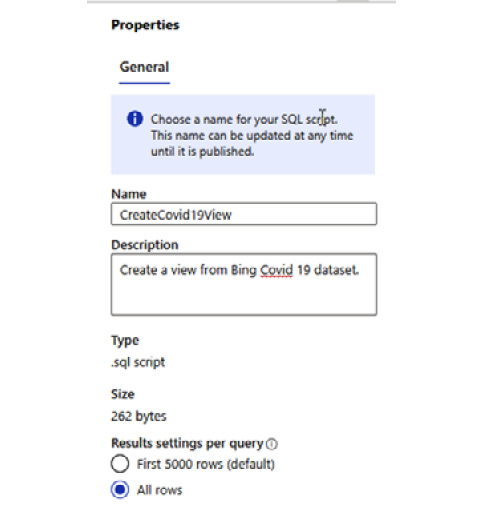
Figure 3.11: SQL script properties
- Save your script by clicking on the Publish button. On Windows, you can also achieve this by pressing Ctrl + S.
- It's now time to run your query. Click on Run.
Once the query is finished, it should display the following message:

Figure 3.12: Query execution status
Let's check whether the view has been created in the database:
- Go to the Workspace tab of the Data section of Synapse Studio. Drill down on your database and views and check whether the view was created:

Figure 3.13: View created for the COVID-19 dataset
- Right-click on the view that was created, click on New SQL script, and click Select TOP 100 rows:
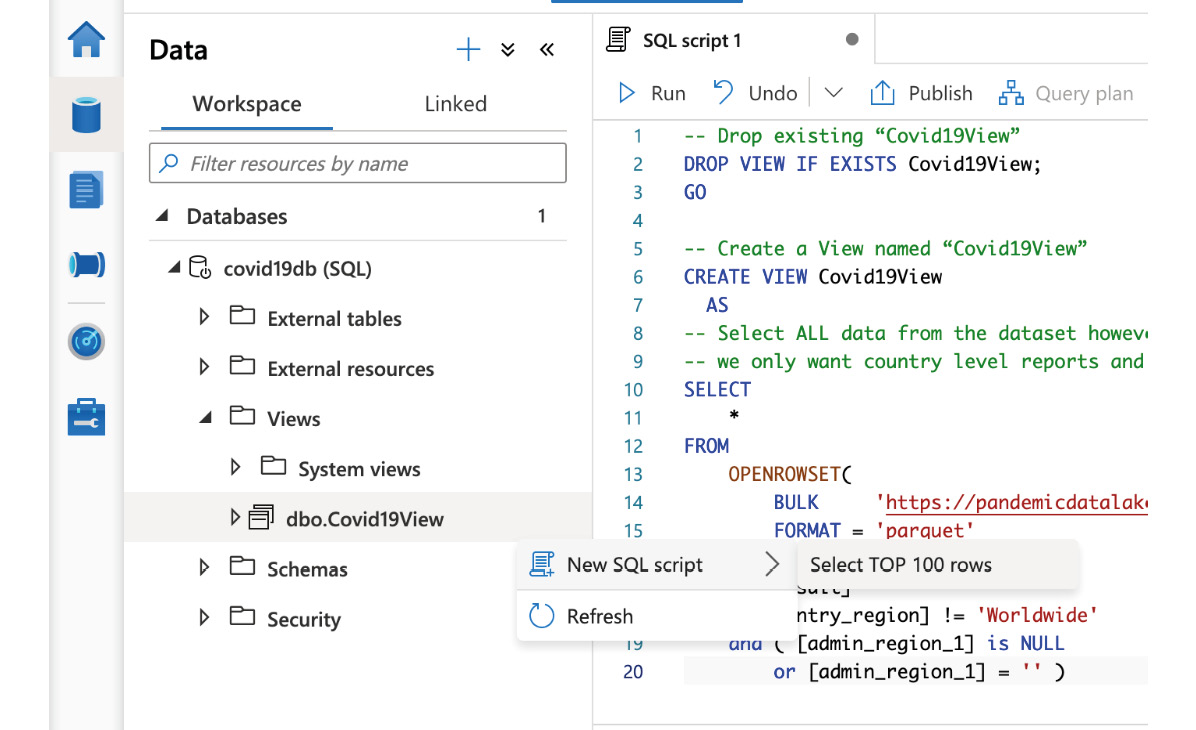
Figure 3.14: Querying the top 100 rows of Covid19View
- This should open a new window. Click on Run to execute the select query. It should display rows of data in the Results tab:
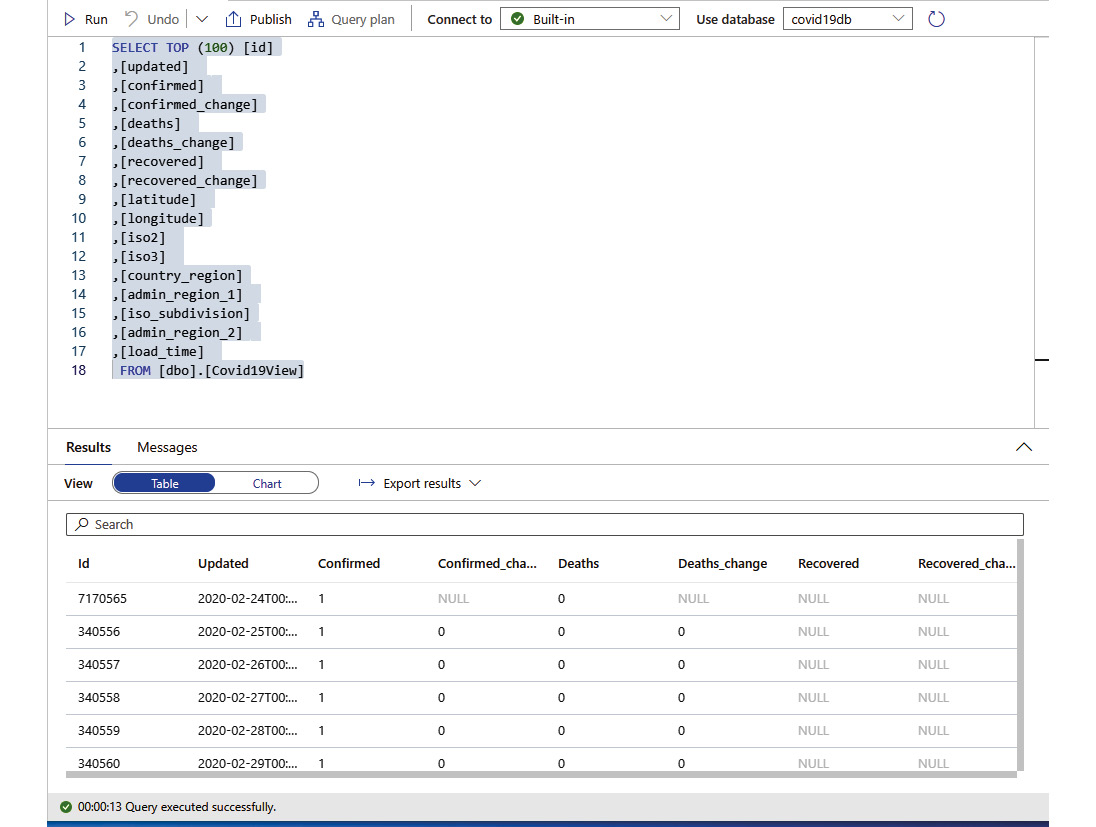
Figure 3.15: Executing the query to get the top 100 rows
Creating and publishing the Power BI report
Now that we have populated the Azure Synapse Analytics database with data, it's time to create a report in Power BI:
- Go to the Develop section of Synapse Studio and drill down to Power BI | Your Workspace | Power BI datasets. Click on + New Power BI dataset:
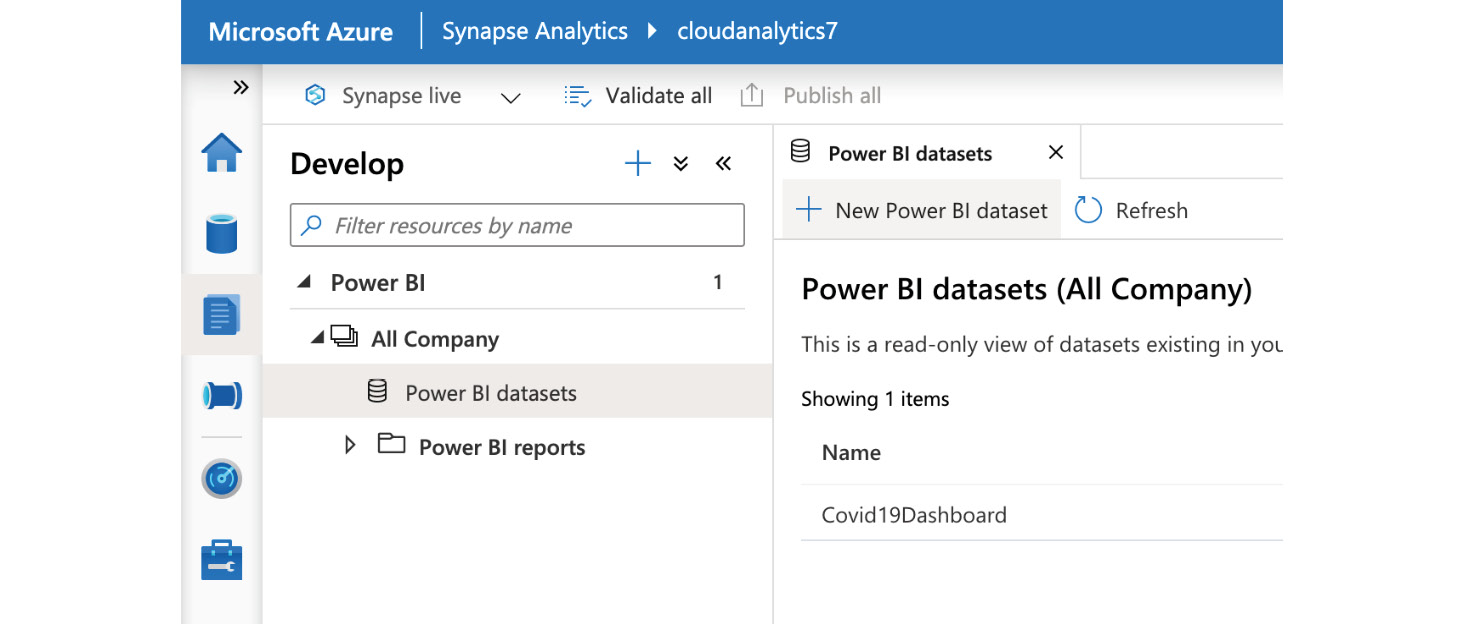
Figure 3.16: Adding a new Power BI dataset
- This will open a wizard that will allow you to choose a database. Click on Continue:

Figure 3.17: Selecting a data source for the Power BI dataset
- After choosing a database, the next part of the wizard enables you to download a Power BI desktop file. Click on Download:

Figure 3.18: Downloading a linked Power BI dataset
After downloading the file, open the .pbids file. The file should open Power BI Desktop on your Windows machine. If you're not yet authenticated, it will prompt you to choose a method to connect to the database:
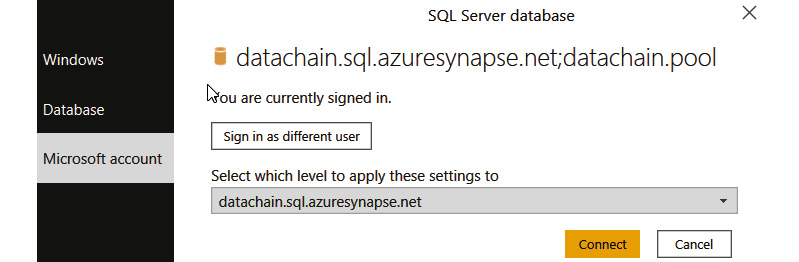
Figure 3.19: Adding an Azure Synapse Analytics SQL database as a data source in Power BI
Once you are authenticated, it will then display a Navigator screen for you to select data sources you want to capture. Make sure that the view where we stored our data is ticked. Then hit Load:
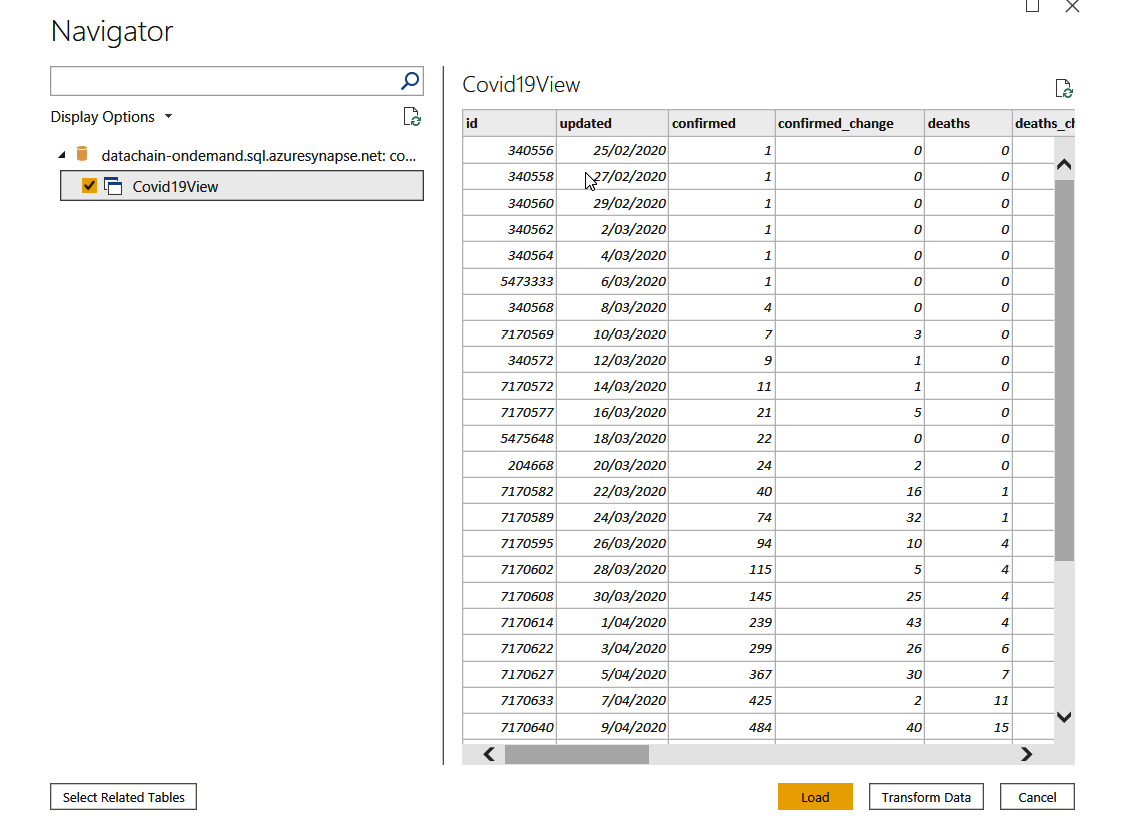
Figure 3.20: Loading the COVID-19 dataset into Power BI
You will then be prompted with an option to choose either Import or DirectQuery:

Figure 3.21: Selecting the Power BI connection settings
By choosing the Import option, the data will be stored in Power BI Desktop. You will need to perform a refresh in order to get an update of that data. Import is the preferred approach if the data size is not that big and if your machine has enough memory (RAM).
If you choose DirectQuery, no data will be stored in Power BI Desktop. DirectQuery will only create a reference from the data source and will query that data each time you update your workspace. DirectQuery is preferred if you have complex external data sources.
After selecting an option, it will then load the data to add as your Power BI fields.
- To get started creating a report, drag the updated field from the Fields tab (on the right of Power BI) to the workspace. Then, on the Visualizations tab, choose Matrix:

Figure 3.22: The Visualizations tab
- In the Format section, go to Subtotals and toggle off Row subtotals.
This should give you a date selector like the one here:
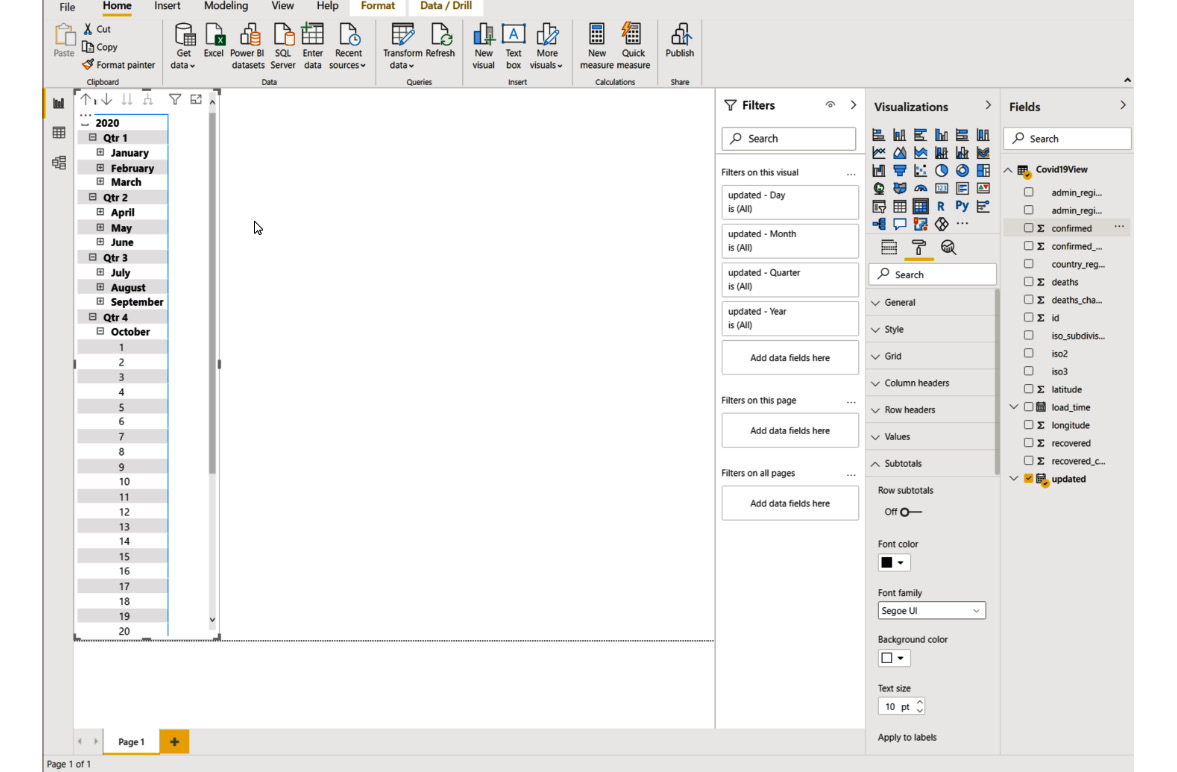
Figure 3.23: Power BI Desktop with a date matrix
- It's time to display much more meaningful insights. Go to the Visualizations section and click on Filled Map. This will create an empty map in the workspace. Expand it to capture the rest of the workspace area.
Drag and drop the following fields onto the map:
- country_region
- confirmed
- recovered
- deaths
This should create a world map that is filled.
- Go to Date selection at the left and choose a day by drilling down from the matrix. For example, October 21.
- Go to the map section and hover to a country. It should show you the number of confirmed, recovered, and death cases for that country on that date:
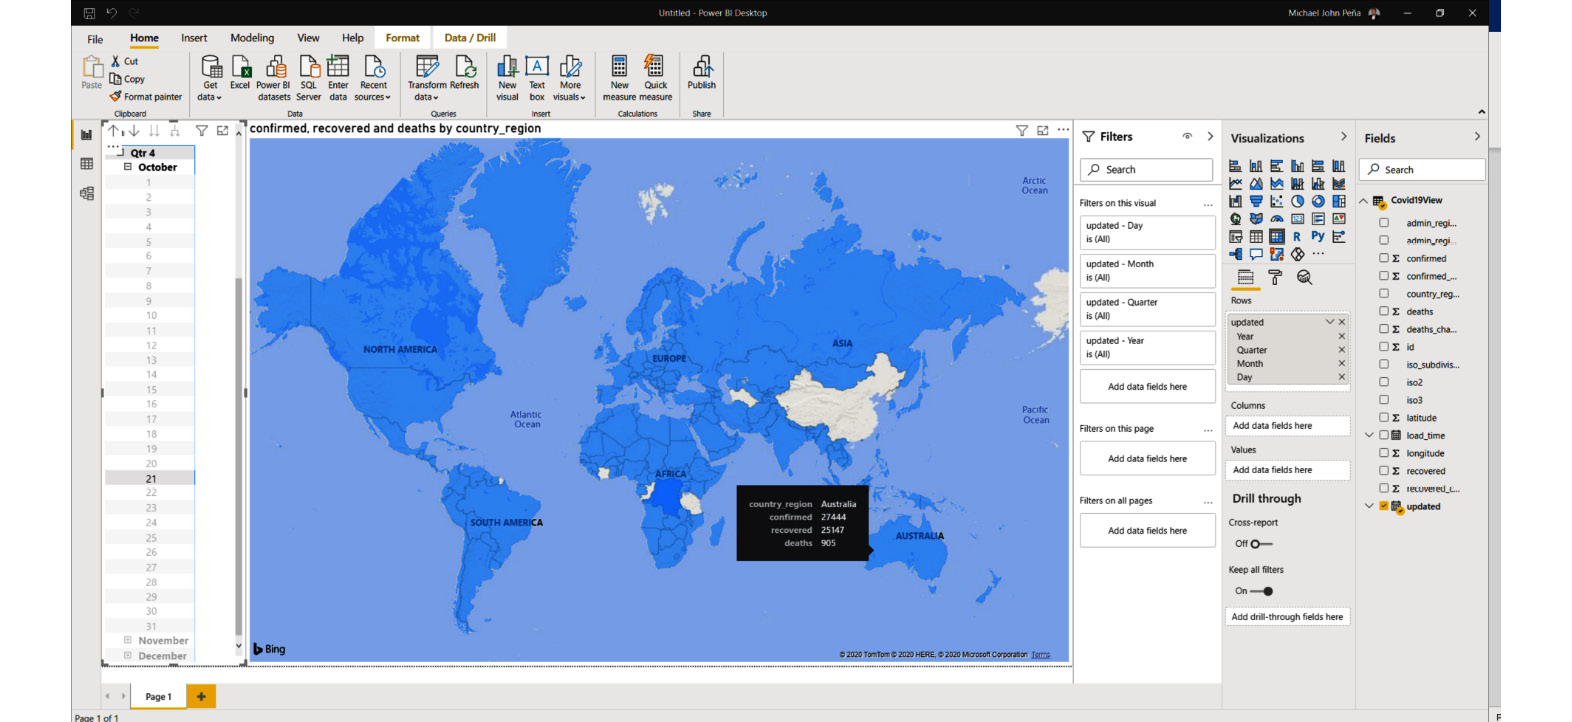
Figure 3.24: Displaying country-wise COVID-19 statistics
Feel free to explore the customizations you might want to implement.
After further customization, let's publish the report so that other people can see it.
- Click on the Publish button at the top part of the Home ribbon. Choose a destination for this report:
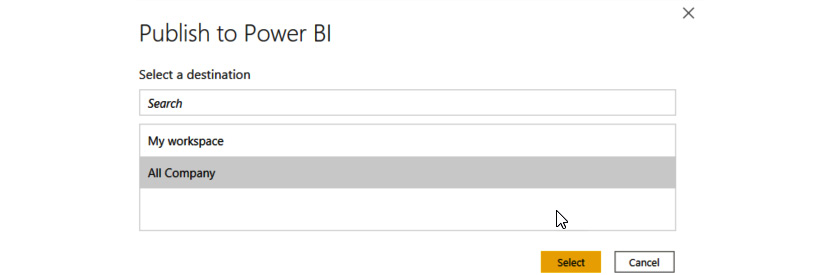
Figure 3.25: Choosing a destination for the report
- Once it's published, it will give you a link to open the report at PowerBI.com. Open the link:

Figure 3.26: Opening the published report in Power BI
Once it's published, it will be available to your Power BI workspace. In the workspace, you can share this report with any of your team members within your tenant by clicking on the Share button:
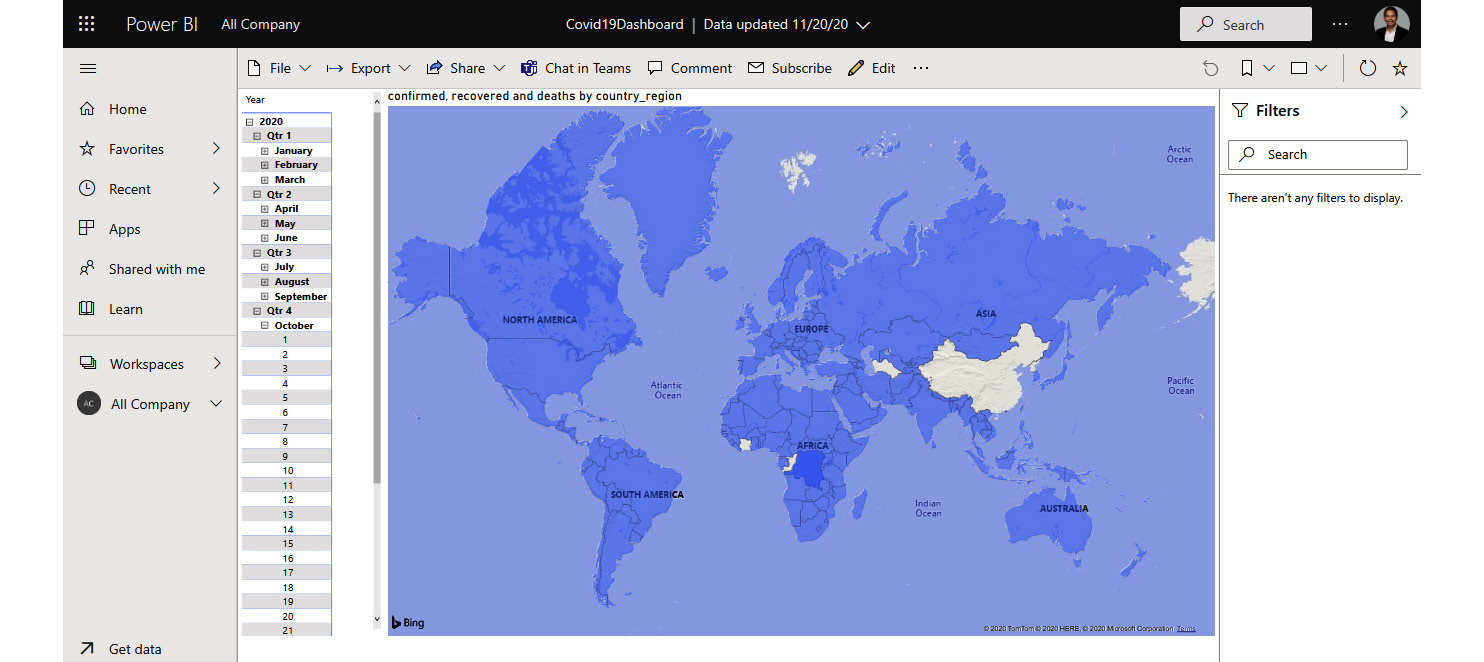
Figure 3.27: Viewing a report in the Power BI workspace
This report can also be viewed on tablet and mobile devices:

Figure 3.28: Viewing the Power BI report on a tablet/mobile device
Congratulations on creating your Power BI dashboard! In this activity, we covered how to use Synapse Studio to transform data into a meaningful semantic model that Power BI can visualize. In the next section, we will explore how we can use machine learning with Azure Synapse Analytics.
Machine learning on Azure
There are multiple ways to perform machine learning on Azure. Microsoft enables data science to be more accessible to all types of users and empowers data scientists to be more productive. Microsoft provides a suite of technologies for developers, database engineers, and data scientists to create machine learning algorithms. Whatever your level of proficiency and expertise in data science, there is a useful Microsoft service, tool, or framework that can accelerate your machine learning journey.
Figure 3.29 depicts a machine learning landscape within the Microsoft Azure ecosystem. You can use pre-trained models with Azure Cognitive Services and directly integrate them with your applications without the need to set up a data pipeline. You can use popular frameworks such as TensorFlow and Keras in Azure, whether that's by installing them on a virtual machine or using a machine learning workspace. You can choose different platforms such as Azure Machine Learning or Azure Databricks to prepare and run your machine learning experiments:

Figure 3.29: Microsoft Azure features and services for machine learning
By using Azure to drive your computation for machine learning analysis, you are provided with specialized hardware that can speed up your experiments. With accelerated hardware such as fast graphics processing units (GPUs) and field-programmable gate arrays (FPGAs), you can read billions of database table row entries and try various models concurrently to achieve faster results for your machine learning experiments.
The following sections will give an overview of the major technologies and platforms that implement machine learning and artificial intelligence within the Microsoft Azure ecosystem.
ML.NET
ML.NET is an open-source cross-platform framework for .NET developers. By using ML.NET, you and your team can leverage the skills, libraries, and frameworks that are already present within the .NET ecosystem. You can create web applications using ASP.NET, mobile applications using Xamarin, Desktop applications using WPF, and even the Internet of Things (IoT) using Windows IoT. You can also extend your machine learning model creation capability by using TensorFlow and ONNX. ML.NET provides out-of-the-box support for algorithms that enable sentiment analysis, product recommendation, object detection, sales forecasting, and many more real-world business scenarios.
For tasks such as regression and classification, both training and consumption can be carried out using ML.NET. Other than this, it also supports core data types, extensible pipelines, data structures, tooling support, advanced performance mathematics, and more.
ML.NET can be installed from nuget.org. nuget.org is a public repository of downloadable .NET packages, libraries, and frameworks that you can easily add to your .NET project.
Automated machine learning
Automated Machine Learning (Automated ML, or AutoML) enables data professionals to build models code free within Azure Synapse Analytics powered by Azure Machine Learning. AutoML is designed to automatically detect the best machine learning models for you by selecting the right algorithm and helping tune hyperparameters for forecasting, classification, and regression. This is very useful if you do not have a data scientist on your team.
AutoML helps users (developers, analysts, and even data scientists) to implement machine learning without a high barrier of entry relating to programming languages, libraries, frameworks, and data science concepts. It allows companies to innovate, thanks to faster time-to-market by means of an iterative process, and to leverage data science best practices when running experiments.
AutoML runs are executed on Azure Synapse Analytics serverless Apache Spark pools and are tracked in the Azure Machine Learning service.
Cognitive services
Azure Cognitive Services is a suite of cloud-based, general-purpose, pre-trained models and APIs that can be consumed and extended for further training for specific use cases. If, for example, you want to create an object detection AI that understands what a banana is, you might need to feed in more data to help the AI understand that an image contains a banana. Consuming cognitive services is done via HTTP and is platform-agnostic, meaning you can use any programming language and operating system. There are five main categories of cognitive services: decision, vision, speech, search, and language. You can readily integrate AI and ML with your mobile, web, desktop, or even IoT applications using Cognitive Services.
The speech-to-text and speaker-recognition capabilities of the Speech Services API are good examples of cognitive services. These capabilities allow you to transform speech data to text, translate it to other languages, and recognize the identity of the speaker without setting up a machine learning workspace that involves millions of datasets and a series of machine learning model experiments.
Using Cognitive Services is the best approach for those who want to easily integrate AI and machine learning in their applications with minimum data science knowledge. Microsoft offers very flexible pricing options where you only pay for what you use, and most of the services have free tiers for you to explore. There are currently pre-trained models available for text analytics (sentiment analysis) and anomaly detection, but more models will be available in the future.
You can learn more about Cognitive Services at https://azure.microsoft.com/services/cognitive-services/.
Bot framework
Microsoft Bot Framework enables applications to build intelligent bots (often used for chatbots) to automate workflows. The Bot Framework is closely associated with Cognitive Services such as Language Understanding Intelligence Service (LUIS) and QnA Maker. QnA Maker is a natural language processing (NLP) service that accelerates the creation of conversation-based AI such as chatbots. With the Bot Framework, developers can easily create a conversational AI that learns through training from utterances and intents. This framework also allows developers to easily publish bots to channels such as Microsoft Teams, Cortana, and Slack.
The Bot Framework is now widely adopted by large corporations such as banks and retail conglomerates for their first-level support. For example, the Bank of Beirut used the Bot Framework to create the Digi Bob chatbot, which assists users in applying for loans and availing themselves of other banking services. To learn more, read about this use case at https://customers.microsoft.com/story/740194-bank-of-beirut-banking-azure-dynamics365-lebanon.
Using the Bot Framework, developers can deploy intelligent enterprise-grade bots that can easily translate inquiries and messages (intents) from users and respond with meaningful actions. These actions can include querying a data source or orchestrating a command to a system. You can learn more about the Bot Framework at https://azure.microsoft.com/services/bot-services/.
There are more machine learning tools and products within the Microsoft ecosystem, such as:
- SQL Server Machine Learning Services
- Microsoft Machine Learning Server
- Azure Data Science Virtual Machine
- Windows ML
- Apache Spark MLlib
- Azure Notebooks
- Azure Batch
- ML Services on HDInsight
- ML on Power BI
- Azure Machine Learning for Visual Studio Code
- Running your own ML frameworks to a Linux container or server image
This book is not able to cover all of the technologies mentioned here, so we instead focus on Azure Machine Learning. For more information on these services, visit https://azure.microsoft.com/overview/ai-platform/.
Azure Machine Learning features and benefits
Azure Machine Learning offers a variety of features and lots of flexibility to users of various backgrounds and expertise. Azure Machine Learning can integrate into your existing data pipeline to perform tasks such as leveraging data from Azure Data Lake or Azure Synapse Analytics and serving the models directly to Power BI. You can also use Azure Databricks to further automate the hardware clusters where you are running your machine learning experiments.
Azure Machine Learning provides an end-to-end workspace to run your machine learning operations. With Azure Machine Learning, you can create experiments using AutoML, a visual interface, or the Software Development Kit (SDK) in your machine learning notebook. You can also create a portable data model that can run in a container. This model can then be published to Azure Container Instances (ACI).
Software Development Kit (SDK)
Azure Machine Learning serves a Python SDK that fully supports mature frameworks such as MXNet, TensorFlow, PyTorch, and scikit-learn. You can import the SDK into your experiments using Jupyter Notebooks, Azure Notebooks, or even Visual Studio Code.
Designer
You can also use a visual interface (with minimal coding being required) within Azure Machine Learning called Designer to create and run experiments. The experience uses a low-code/no-code approach with drag-and-drop tools to create and connect entities. This is an intuitive way to connect data sources and create a machine learning model to train and serve.
AutoML
As discussed earlier, AutoML is a mechanism that suggests the best algorithm to use in your experiments. It is a baked-in feature of Azure Machine Learning. You can automate away time-intensive tasks such as data cleaning and choosing the right algorithms for your model. With AutoML, you can rapidly iterate over many combinations of algorithms and hyperparameters to find the best model for your desired outcome.
Flexible deployment targets
Microsoft and Azure do not limit your model deployment options. Even if you are managing your workspace and performing your analysis in the cloud, you are not locked into just deploying the outcome of your experiments to Azure. You have the option to deploy them on-premises and in edge environments by using containers.
Accelerated Machine Learning Operations (MLOps)
In a modern data warehouse, the combination of Azure Databricks and Azure Machine Learning can accelerate your machine learning operations. Azure Machine Learning can provide you with an end-to-end workspace where you can connect data from various sources with Azure Synapse Analytics, prepare and train data models, deploy them to consumers such as Power BI, and then monitor and retrain them to improve accuracy:
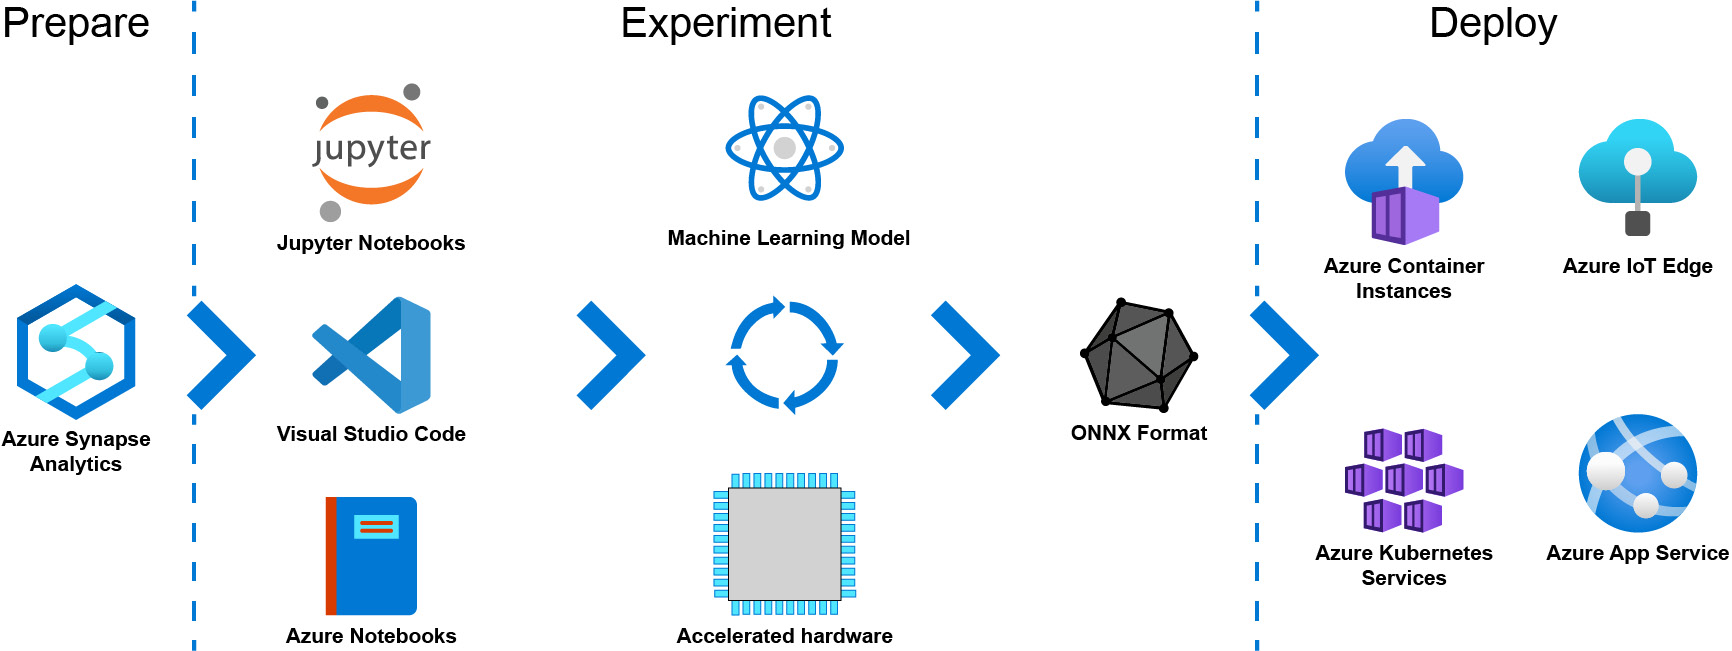
Figure 3.30: Preparation, experimentation, and deployment in Azure Machine Learning
With Azure Machine Learning you can use Azure Databricks to prepare the data for your experiments. You can then use either Jupyter Notebooks or Visual Studio Code to author your experiments; alternatively, you can also use the built-in Azure Notebooks feature of Azure Machine Learning. You will then run your experiments to train and test your machine learning model by leveraging computers to run complex data science algorithms. Azure Machine Learning will create a machine learning model with the ONNX format, which is highly portable and can easily be deployed to a container such as Azure Container Instance. You also have the option to run it on Azure Kubernetes Services (AKS) or even on edge devices that support Docker.
Note
The ONNX model format enables data professionals working in Azure Synapse Analytics to bring a variety of models into Synapse securely without the need for data movement outside of the Azure Synapse Analytics security boundaries.
This book will not cover the use of Azure Databricks as the compute cluster of Azure Machine Learning, but there are advantages of having this combination. If you are already using Azure Databricks to derive real-time analytics on your modern data warehouse, you might also consider using it to run your machine learning experiments in Azure Machine Learning. You can read more about this at https://docs.microsoft.com/azure/machine-learning/how-to-configure-environment#aml-databricks.
Azure Machine Learning and Azure Synapse Analytics
Azure Machine Learning and Azure Synapse Analytics can work hand in hand as they solve different problems. You use Azure Synapse Analytics for your modern data warehouse to make a unified data pipeline for your disparate data sources and eventually model and serve that data for a client consumer. Azure Machine Learning on the other hand, is used to create a machine learning model that can eventually be used for your applications to create meaningful inferences (assumptions).
A practical example of using Azure Machine Learning and Azure Synapse Analytics together could be in a physical retail store. Azure Synapse Analytics can aggregate multiple data sources such as beacon and CCTV data (unstructured), NoSQL databases, and SQL databases, then query them all to serve meaningful reports for Power BI such as "number of goods sold versus audience traffic." Using Azure Machine Learning on the other hand, you can run through experiments from various data sources, including the ones generated by Azure Synapse Analytics, to create a recommendation engine for people coming to the store based on their previous activities and correlation among the rest of the customers.
It is also possible to combine Azure Synapse Analytics and Azure Machine Learning workspaces as a linked service. An Azure Machine Learning linked service can be created from within an Azure Synapse Analytics workspace and enables much simpler collaboration between the two technologies.
Quick start guide (Azure Machine Learning)
In this quick start guide on Azure Machine Learning, we will look at how to get started with the platform without any coding required. We will be using a sample called Image Classification using DenseNet using the Designer feature of Azure Machine Learning to create a pipeline for your machine learning model.
Prerequisites
In order to perform this activity, you need the following:
- An active Azure subscription
- Creating an Azure Machine Learning workspace
- In the Azure portal, search for Machine Learning and click on Create:
Figure 3.31: Creating an Azure Machine Learning workspace
- Complete the subscription and workspace details.
Note
For this specific exercise, you can create a new instance or use an existing one for:
- Azure Storage
- Azure Key Vault
- Application Insights
- Azure Container Registry
- Create the resource by clicking on Review + create:
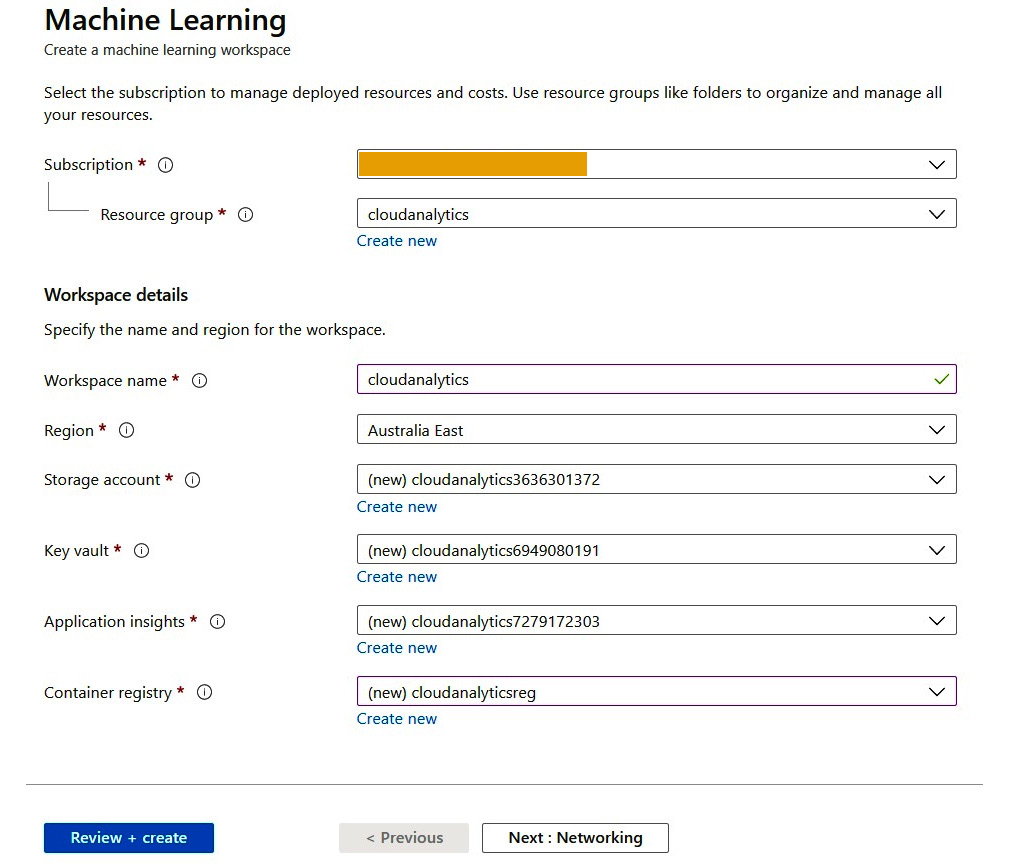
Figure 3.32: Azure Machine Learning workspace details
- Once the Azure Machine Learning resource has been provisioned, go to its Overview section and click on Launch studio:

Figure 3.33: Managing the machine learning model through Launch studio
This will redirect you to the Azure Machine Learning studio, where we will create our machine learning model.
Creating a machine learning model using Designer
- In the Azure Machine Learning studio, click on the Designer blade. We will be using a sample pipeline called Image Classification using DenseNet. Click on the icon of Image Classification using DenseNet to get started:
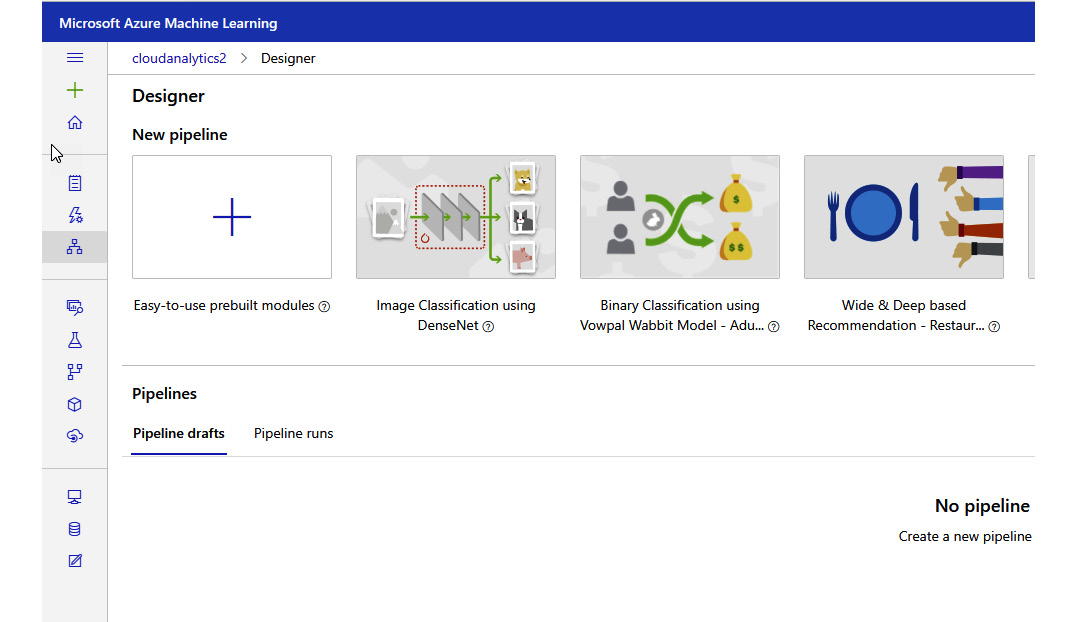
Figure 3.34: Creating a machine learning pipeline using Designer
This sample will create a series of steps in the pipeline as shown in Figure 3.35:

Figure 3.35: Image classification pipeline
In summary, this pipeline takes a set of images from the Animal images Dataset repository to use for training the model. It will then apply series of steps and techniques (refer to the flow chart) to train the model until it's ready to be scored.
Scoring the model means creating a measurement on how accurate this model can be if fed with a new image. The last part is the model evaluation, wherein the performance of this model is evaluated. This exercise is what sets your model apart from other models in terms of accuracy and reliability.
- Click on the Submit button in the top-right portion of the page. It will ask you to specify which compute target you are going to use for this experiment, meaning which virtual machine you will use.
For this exercise, create a new compute target by ticking the Create new radio button and assigning it a name. Click on Save. It will create that compute target:
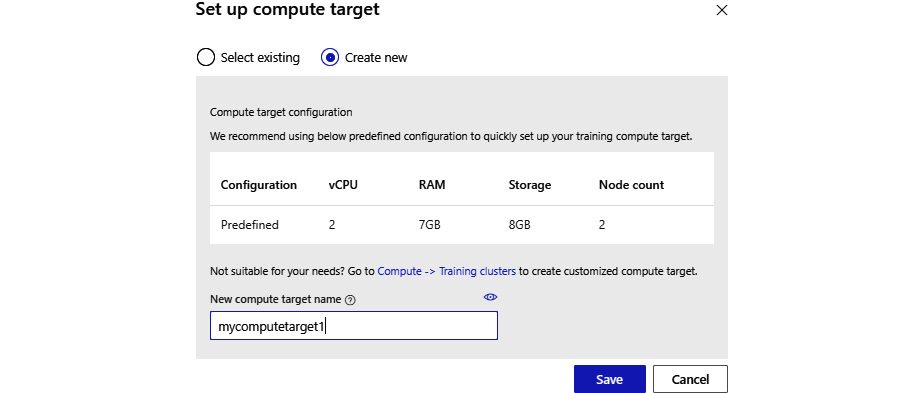
Figure 3.36: Setting a compute target
Note
In Azure Machine Learning, you can also add and configure existing virtual machines as a compute target.
Once the compute target has been created, you are now ready to run the experiment. Try to click the Submit button again to trigger the experiment.
- You will be prompted to select or create an experiment name as shown in Figure 3.37. Put an experiment name in the Create new option and once you're ready, click on the Submit button:

Figure 3.37: Creating a new experiment
It will now run your experiment, and this will take some time. You can see the progress of the experiment visually depending on the status of each step: queue, not started, or completed.
Once the experiment is complete, all boxes should be highlighted in green, as shown here:

Figure 3.38: Animal imaging experiment pipeline
- Click on the Scored Image Model step. Right-click on it and choose the Visualize option. Then click on Scored dataset:
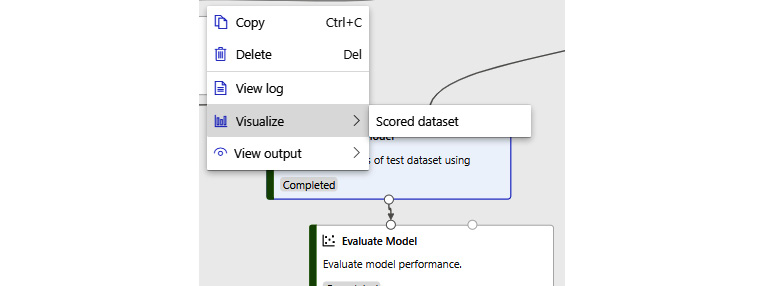
Figure 3.39: Visualizing the scored model
The result visualization shows the probability of an image being a cat, dog, or frog. As you can see, this model is better at detecting cats, where it scores 99.57% accuracy, compared with recognizing dogs, where it scores only 70.01%:
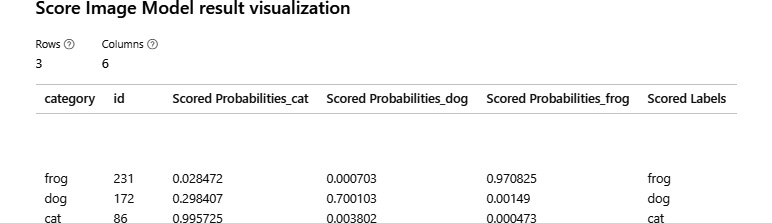
Figure 3.40: Scored model visualization result
This exercise gave you a glimpse of how easy it is to get started on Azure Machine Learning. You may choose to deploy this model to ACI or AKS to get a real-time inference on an image that you want to test, but that's beyond the scope of this book. Do not forget to clean up or delete your resources if you won't be needing them anymore.
Summary
In this chapter, we discussed how Azure Synapse Analytics can serve a unified data model to Power BI. We then explored the use of Power BI Desktop to create reports. Power BI enables you to create rich and meaningful graphs that derive business insights. We then published a report in order to collaborate on it across different media.
We have also learned that there are many available tools and technologies to implement machine learning and artificial intelligence in Azure. We explored Azure Machine Learning, including its features and benefits, and performed machine learning on Azure to create a model that classifies animals. In the next chapter, we will explore different business use cases for Azure Synapse Analytics and related technologies.