
Chapter 3: Configuring Python with Power BI
Just as in Chapter 2, Configuring R with Power BI, you had to install the R engines in order to interact with Power BI, in the same way you will also have to install the Python engines on your machine. You'll also see how to configure some IDEs so you can develop and test Python code comfortably before using it in Power BI. Therefore, similar to what we have already seen in Chapter 2, Configuring R with Power BI the following topics will be discussed in this chapter:
- The available Python engines
- Which Python engine should I install?
- Installing an IDE for Python development
- Configuring Power BI Desktop to work with Python
- Configuring the Power BI service to work with Python
- Limitations of Python visuals
Technical requirements
This chapter requires you to have a working internet connection and Power BI Desktop already installed on your machine. The last part of the chapter also requires you to be signed up for the Power BI service (here's a how-to: http://bit.ly/signup-powerbiservice). A Power BI free license is enough to test all the code in this book, as you will share reports only in your personal workspace.
The available Python engines
As with R, there are several distributions you can install for Python: standard Python, ActivePython, Anaconda, and so on. Typically, "pure" developers download the latest version of the Python engine from https://www.python.org/, and then install various community-developed packages useful for their projects from the Python Package Index (PyPI). Other vendors, such as ActiveState and Anaconda, pre-package a specific version of the Python engine with a set of packages for the purpose of accelerating a project's startup. While the standard Python and ActiveState distributions are more aimed at general-purpose developers, Anaconda is the distribution preferred by data scientists and by those who work more closely with machine learning projects. In turn, Anaconda comes in two distinct distributions itself: Anaconda and Miniconda.
The Anaconda distribution, with its more than 150 included packages, can be considered to be the best do-it-yourself supermarket for data scientists, where everything is ready and configured to be used. The Miniconda distribution, on the other hand, is considered the minimum indispensable toolbox for the data scientist seeking to trim the resources to the right level.
But there is one fundamental tool that Anaconda and Miniconda have in common: it is Conda, one of the most popular package managers for Python. Conda provides the developer with an easy-to-use system for the management of so-called virtual environments. A virtual environment, or environment for short, aims to encapsulate the installation of a Python engine with a set of version-specific packages. The goal is to create an isolated environment, often associated with a project or task, that can guarantee the reproducibility of results. This is a very important concept, essential to ensure that Python projects run smoothly when dealing with a large community of developers who create and maintain their own packages independently of each other.
Note
Contrary to what you saw in Chapter 2, Configuring R with Power BI, the Python community does not have a "time machine" available that easily references a specific version of the Python engine at its release date and a snapshot of the entire ecosystem of PyPI packages at the versions they were at on that date. It is up to you to build your own "time capsules" using environments in order to ensure the reproducibility of your code.
Conda is a very versatile tool. Besides managing the environments, it can also install various packages (regardless of the programming language used, not only Python), carefully managing all their dependencies. But the official recommended tool for installing Python packages from PyPI is pip, which only installs packages written in Python and is generally installed together with the Python engine.
That said, beyond the extent of the "bodywork" mounted around the Python engine, the various Python distributions do not add features that dramatically improve engine performance, unlike what we saw in Chapter 2, Configuring R with Power BI, with Microsoft R engines. For this reason, we won't go into detail about the features installed by each distribution.
Choosing a Python engine to install
Back to our scenario, to develop Python code for use in Power Query or Python visuals, what you need for sure is the following:
- A Python engine
- A package manager, to install the minimum number of packages needed to transform the data or visualize it appropriately
To select the products that best suit your needs, you will need to understand your Power BI requirements in more detail.
The Python engines used by Power BI
Just as with R visuals in the Power BI service, the following note applies to Python visuals.
Important note
The Python engine and packages used by the Power BI service for Python visuals are preinstalled on the cloud and therefore the user must adapt to the versions adopted by the service.
As you can imagine, the version of the engine adopted by the Power BI service is a bit behind the latest release (now 3.9.1). See the following note for more details.
Important note
To date, the Power BI service relies on the Python 3.7.7 runtime when implementing a Python visual. It is important to always keep an eye on the version of the Python engine and packages provided by the Power BI service with each release to ensure that the reports to be published work properly. See the following link for more information: http://bit.ly/powerbi-python-limits.
The behavior of the Power BI service is the same as that we've already seen for the R script in the case of doing data transformation in Power Query.
Important note
The Python engine used by the Power BI service during the data refresh phase for Python scripts in Power Query has to be installed on any machine of your choice outside the service, and on that same machine you have to install the on-premises data gateway in personal mode. Note that you must use external engines even if the data to be refreshed does not flow through the gateway, but comes from data sources not referenced by the gateway itself.
As long as the Python environment to be referenced via the data gateway is the base one, it is sufficient that both are installed on the same machine. Otherwise, the following note applies.
Important note
If you need to use multiple environments installed on the machine for your Power Query transformations, you must also install Power BI Desktop. It allows you to switch the routing of the data gateway to the selected environment through its options, updating the configuration file at C:Users<your-username>AppDataLocalPowerBIScriptingPythonSettings.xml. This file allows the overriding of the Python environment referenced by the data gateway by default.
In a nutshell, regardless of whether you want to run R or Python scripts, the infrastructure required by Power BI Desktop and the Power BI service is managed in the same way. Therefore, again, if you need to do reports for personal use on your desktop, you have no limitations on which Python engine to use, so you can install the Python versions and packages that suit you best. If, on the other hand, you know in advance that the reports you will create contain Python visuals and are intended to be shared with colleagues on the Power BI service, then there are strict limitations on both the version and the packages pre-installed in the service.
But let's get down to business and start installing the Python stuff!
Installing the suggested Python engines
Managing dependencies of Python scripts injected inside reports can be complex in the long run. Keeping in mind that it is possible to create multiple environments on the same machine, we suggest the following tip.
Tip
We recommend that you dedicate a machine to run only the Python engines used by Power BI reports. Our suggestion is to create a Python environment for each possible need that may arise when developing Python scripts in Power Query or for Python visuals. If you have already prepared a machine dedicated to running R scripts, as seen in Chapter 2, Configuring R with Power BI, then you could use the same machine to install Python engines on as well. Keep in mind that in this case, you need to make sure that the resources of the machine are sufficient to run all the engines and to satisfy the various requests coming from the various reports.
Let's first install the latest version of the Python engine, to be used for data transformation.
The Python engine for data transformation
Surely, to enrich your reports using Python, you won't need 150 pre-installed packages. Also, in order to easily manage your environments, Conda is a tool to include in your arsenal. Bearing in mind that the engine we are about to install will be used as an external Python engine by the Power BI service to transform data via Power Query through the on-premises data gateway in personal mode, the following tip applies.
Tip
We suggest adopting the latest version of Miniconda as the default distribution. This is because, besides pre-installing very few packages giving you the possibility to choose which packages to install, it also includes Conda in the distribution.
The installation of Miniconda is very simple:
- Go to https://docs.conda.io/en/latest/miniconda.html.
- Click on the latest version available for your OS (3.8 as of the time of writing):
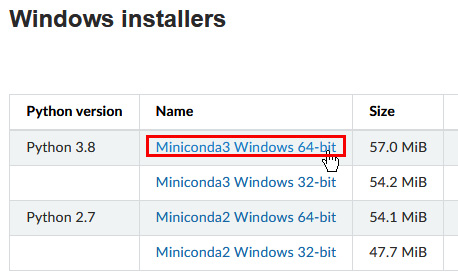
Figure 3.1 – Download the latest version available of Miniconda
- Once the file is downloaded, double-click on it, click Next on the welcome window that pops up, and then click on I Agree to accept the License Agreement.
- In the next window you'll be asked if you want to install Miniconda just for you or for other users as well. Leave the default setting (only for you) and click Next.
- Leave the default folder for the installation on the next screen and click Next. Keep in mind that the installation path is in the following form: C:Users<your-username>miniconda3. If it has been installed for all the users, the installation path will be this one: C:ProgramDataMiniconda3.
- In the next window, check Register Miniconda3 as my default Python 3.8 and click Install:
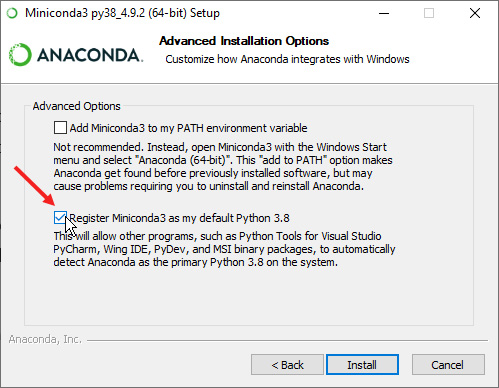
Figure 3.2 – Set Miniconda as your default Python 3.8 engine
- At the end of the installation, an Installation Complete window will inform you that the installation was completed successfully. Then, click Next.
- The last screen gives you the possibility to open documents containing tips and resources to start working with Miniconda. You can unflag the two options and click Finish.
And that's it! Now you are ready to write and run your Python code with Miniconda.
Important note
Usually, the Power BI Desktop installation on which you develop reports is located on a separate machine from the one selected as the Power BI service Python engine machine, where the data gateway is also often installed. In that case, you must also install Miniconda on the machine on which your Power BI Desktop is installed.
At the end of the installation, under the Anaconda3 (64-bit) folder in the Start menu, you will find shortcuts to two command-line interfaces (the standard Command Prompt and PowerShell), which ensure that you can activate Conda behind the scenes and interact with the tools provided by Miniconda:

Figure 3.3 – Anaconda prompts that are useful for interacting with Miniconda
Our favorite command line is the Anaconda Prompt and we'll show you how to use it very shortly.
As we said in the The available Python engines section, both conda and pip are very good package managers. As a package dependency solver, conda is better, although a bit slower than pip. But the reason pip is often used as a package manager is that it pulls packages directly from PyPI, which is a far more complete repository than Anaconda's one. For the same reason, we will also use pip as our default package manager.
Creating an environment for data transformations
Contrary to what you have seen for R engines, for which two separate installations of two engines with different versions have been done, in the case of Python the installation is unique and only the environments vary.
Here, we will create an environment dedicated to data transformations and containing the latest version of Python made available by Miniconda and a small number of packages essential to make the first transformations.
First of all, you have to find the most recent version of Python present in the distribution you just installed:
- Open Anaconda Prompt from the Start menu as shown previously.
- If the prompt has small fonts, just right click on its title bar, select Options and then change the fonts as you like in the Font tab.
The first thing to notice is the word (base) before the current path. The string before the path indicates the name of the current environment. The base environment is the default environment created during the installation of the Miniconda distribution.
- Enter the conda search python command and press Enter.
- You will see the list of available Python versions:
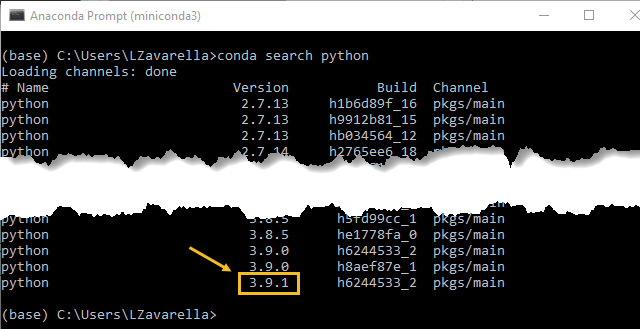
Figure 3.4 – List of all the available Python versions
The latest version available in our case is 3.9.1.
Once we have found the latest version of Python available, we can create our environment dedicated to the data transformation in Power Query, which we will call pbi_powerquery_env:
- Enter the following command to create a new environment named pbi_powerquery_env and containing Python version 3.9.1:
conda create --name pbi_powerquery_env python==3.9.1
You would have achieved the same thing if, instead of ==3.9.1, you had used the form =3.9 (with a single =), leaving it up to conda to find the latest micro-version.
- Anaconda Prompt will ask you to install some packages needed to create the environment. At the Proceed ([y]/n)? prompt, type y and press Enter.
When the package installation is complete, you will still see (base) as the prompt prefix:
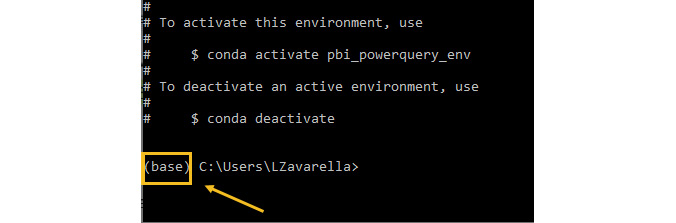
Figure 3.5 – After creating the new environment, you are still in the old one called "base"
This means that you are still in the base environment. Are you sure you created the new environment correctly? Let's check it:
- Try to list the environments present on the system by entering the conda env list command:
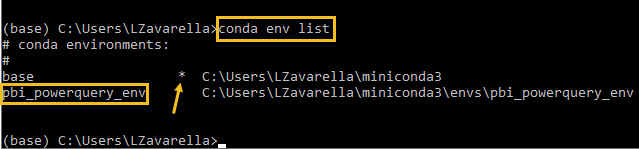
Figure 3.6 – List of conda environments in the system
Fortunately, the new environment is listed, but it is not the active one. The active environment is identified by an asterisk.
- In order to install our packages inside the newly created environment, you must first activate it using the conda activate pbi_powerquery_env command:

Figure 3.7 – Activating the new environment
Now your prompt prefix correctly indicates that you are in your new environment.
- To be on the safe side, check that the version of Python within the new environment is the one you expect with the python --version command:

Figure 3.8 – Checking the Python version installed in the new environment
You are inside your new environment and Python is correctly installed! You can now start installing some of the packages you'll need later. The packages to be installed are as follows:
- NumPy: The most widely used library in Python for working with arrays, and with functions on linear algebra, Fourier transforms, and matrices.
- SciPy: Used to solve scientific and mathematical problems; it is built on the NumPy extension and allows the user to manipulate and visualize data.
- Pandas: A Python package that provides fast, flexible, and expressive tabular, multidimensional, and time-series data.
- Requests: Allows you to send HTTP requests extremely easily.
- BeautifulSoup: A library that makes it easy to scrape information from web pages.
- PyYAML: Allows you to easily read and write YAML files.
You'll use the last three packages from the preceding list in the next section, where you will implicitly use web scraping procedures!
But let's get back to it, and proceed with the installation of each package via pip:
- Enter the following command to install NumPy: pip install numpy.
- Enter the following command to install SciPy: pip install scipy.
- Enter the following command to install pandas: pip install pandas.
- Enter the following command to install Requests: pip install requests.
- Enter the following command to install BeautifulSoup: pip install beautifulsoup4.
- Enter the following command to install PyYAML: pip install pyyaml.
- Check that all packages have been installed correctly with the conda list command:
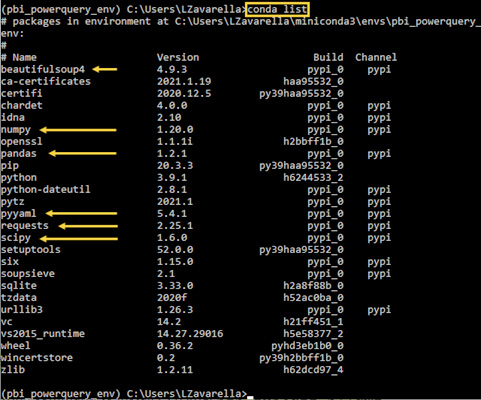
Figure 3.9 – Checking all the selected Python packages are installed
Awesome! Your new environment is now properly configured. Let's now configure another environment for Python visuals on the Power BI service.
Creating an environment for Python visuals on the Power BI service
As already mentioned, Python visual scripts published on the Power BI service run on a pre-installed Python engine on the cloud, the version of which may change with new releases of the Power BI service itself. Should you need to share a report containing a Python visual with colleagues, you need to be sure that your Python code works correctly on the pre-installed engine.
Tip
We strongly recommend that you also create on your machine an environment with the same version of Python that is used for Python visuals by the Power BI service.
Keep in mind that these limitations would not be there if your reports using Python visuals were not to be shared and that you only used them through Power BI Desktop. In this case, it is the engine on your machine that is used by the visuals.
To create the new environment, you must check which versions of both Python and the allowed packages are supported by the Power BI service. You can check these requirements at this link: http://bit.ly/powerbi-python-limits to date the supported version of Python is 3.7.7:
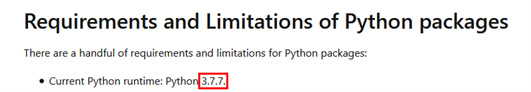
Figure 3.10 – Python version supported for visuals on the Power BI service
In addition, to date the only packages allowed are the following ones:
- matplotlib 3.2.1
- numpy 1.18.4
- pandas 1.0.1
- scikit-learn 0.23.0
- scipy 1.4.1
- seaborn 0.10.1
- statsmodels 0.11.1
- xgboost 1.1.0
The first thing that jumps out at you is the far smaller number of packages compared to the R packages that the Power BI service provides (8 Python packages versus more than 900 R packages!). This evident imbalance of available packages is primarily due to two causes:
- Python was introduced more recently than R (February 2019), so the Python packages introduced are mostly those essential to transforming and visualizing data.
- R is a language primarily for data analysis, and this is immediately clear because it provides a variety of packages that are designed for scientific visualization. Python, on the other hand, is a general programming language that can also be used for data analysis.
Tip
Because of the small number of Python packages supported by the Power BI service, we suggest creating a dedicated environment for Python scripts to run on the Power BI service, directly installing all the current allowed packages.
Keep in mind that you can't properly run a Python visual without installing some default packages. See the following note.
Important note
In order to properly run a Python visual, regardless of whether you do it on Power BI Desktop or the Power BI service, you must necessarily install the pandas and Matplotlib packages.
That said, you could already proceed to create another environment, satisfying the aforementioned version specifications, and following the steps already used to create the previous environment. Even though the Power BI service engines are updated infrequently, this manual task would still be tedious. Unfortunately, there are no ready-made "snapshots" that you can install on-the-fly to reproduce the environment, as you have seen in the case of R engines.
Tip
To avoid unnecessary manual work, we created a Python script that scrapes the web page containing the Python engine requirements on the Power BI service and automatically generates a YAML file to be used in the creation of the new environment.
YAML (defined by some funny guy using the recursive acronym YAML Ain't Markup Language) is a language useful for serializing data (it's a bit of a rival to JSON) and is human-readable. It is often used to serialize the contents of a computer system's configuration files.
In our case, a YAML file helps us gather together all the specifications we need to create our new environment. We thought about a YAML file because conda also permits the use of a YAML file as a parameter to create an environment. Our new environment, which we will call pbi_visuals_env, should have the following:
- The Python engine version 3.7.7
- The pip package manager
- All the 8 packages seen previously, each at the required version, installed using pip
The preceding requirements can be summarized in a YAML file as follows:
name: pbi_visuals_env
dependencies:
- python==3.7.7
- pip
- pip:
- matplotlib==3.2.1
- numpy==1.18.4
- pandas==1.0.1
- scikit-learn==0.23.0
- scipy==1.4.1
- seaborn==0.10.1
- statsmodels==0.11.1
- xgboost==1.1.0
So, let's generate the YAML file using our Python script as follows:
- Open your Anaconda Prompt (if you didn't close it before, it should still be open) and make sure that pbi_powerquery_env is the activated environment. If not, activate it using the conda activate pbi_powerquery_env command.
- Your current path should be in the form of C:/Users/<your-username>. In my case, I have the following:

Figure 3.11 – Our default Anaconda Prompt path
If not, go to your user name folder using the command: cd C:/Users/<your-username>.
- Let's create a new folder called py-environments (this will contain the Python script for web scraping, along with the YAML file) using the md py-environments command.
- Now, go to the book's GitHub repository at https://github.com/PacktPublishing/Extending-Power-BI-with-Python-and-R.
- If you have already downloaded the .zip file of the whole repository and unzipped it on your hard drive, you will find the Python script file that we are interested in in the Chapter03 folder, with the name 01-create-pbi-service-py-packages-env-yaml-file.py.
- If you haven't downloaded the entire repository, click Code on top right of the page at the preceding link, and then click Download ZIP:
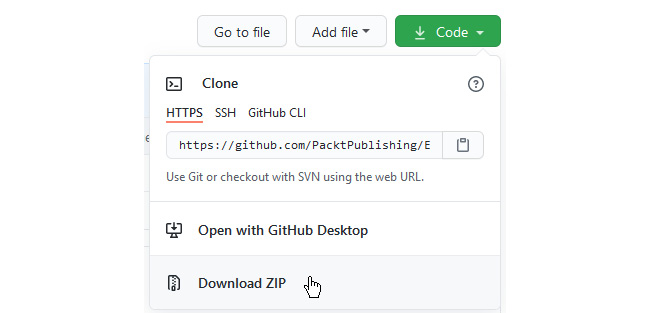
Figure 3.12 – Download the entire zipped repository
After unzipping it, you'll find the file we need in the Chapter03 folder.
- Now copy the file, 01-create-pbi-service-py-packages-env-yaml-file.py, into the C:/Users/<your-username>/py-environments folder using the File Explorer.
- Go back to Anaconda Prompt and change your current folder to py-environment using this command: cd py-environment.
- Now you can finally run the Python script that does the web scraping and generates the YAML file with this command: python 01-create-pbi-service-py-packages-env-yaml-file.py. You will see the contents of the YAML file printed at the prompt as follows:
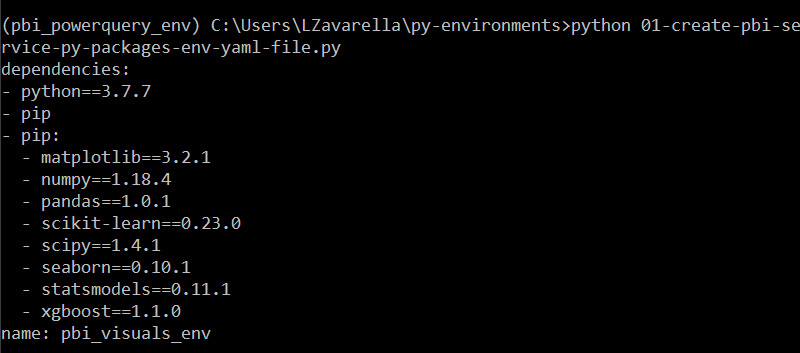
Figure 3.13 – Execute the Python script to create the YAML file
You can also verify that the YAML file was generated correctly by looking again at the contents of the folder at C:/Users/<your-username>/py-environments:
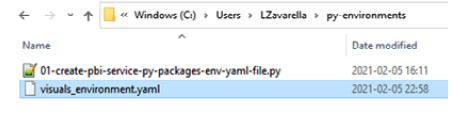
Figure 3.14 – The YAML file correctly created
- At this point, we can directly create the new environment using the following command: conda env create -f visuals_environment.yaml.
- When both Python and the packages' installations are complete, activate the newly created environment using this command: conda activate pbi_visuals_env.
- Then check if the Python version is the one defined for this environment in the YAML file by entering the python --version command. You should see the following output:
Figure 3.15 – The new environment contains the right Python version
Excellent! You have finally created the new environment that will come in use when developing your Python visuals for publishing on the Power BI service. If you are interested in understanding in detail how the previous Python script managed to capture all the information needed to create the environment, you can open it in any code editor and read the very detailed comments on the code.
What to do when the Power BI service upgrades the Python engine
As we did in Chapter 2, Configuring R with Power BI, let's assume that you have already developed and published reports containing Python visuals using the new environment you created earlier. Suppose that Microsoft decides to upgrade the Python version supported by the Power BI service, and consequently to upgrade the versions of currently supported packages as well. As you may have already guessed, it is likely that these updates can cause the code to fail (it is a rare event as very often, backward compatibility is guaranteed).
Tip
In such circumstances, it is often more convenient to create a new environment on the fly, aligned to the updated requirements from Microsoft, through the Python script you have already used previously. Next, you'll need to test reports on the service that contain Python visuals on Power BI Desktop, making sure that it references the newly created environment. You need to fix any code issue in those Python visuals that have some problems, after which you can publish those reports back to the Power BI service.
Once you've made sure that all of the reports are working properly, it's up to you to decide if you want to uninstall the "old" environment to free up disk space and avoid confusion in handling these particular reports.
At this point, we can move on to the configuration and installation of some IDEs that facilitate the development of Python scripts.
Installing an IDE for Python development
In Chapter 2, Configuring R with Power BI, you installed RStudio to conveniently develop your own R scripts. Did you know that, starting with version 1.4, you can write and run Python code directly in RStudio, making use of advanced tools for viewing instantiated Python objects?
Let's see how to configure your RStudio installation to also run Python code.
Configuring Python with RStudio
In order to allow RStudio to communicate with the Python world, you need to install a package called reticulate, which contains a comprehensive set of tools for interoperability between Python and R thanks to embedded Python sessions within R sessions. After that, it's a breeze to configure Python within RStudio. Let's see how to do it:
- Open RStudio and make sure the referenced engine is the latest one, in our case CRAN 4.0.2. As seen in Chapter 2, Configuring R with Power BI, you can set up your R engine in RStudio by going to the Tools menu and then Global Options....
- You can now install the reticulate package by clicking on the Packages tab on the bottom-right panel in RStudio, clicking on Install, entering the reticulate string into the textbox, and finally clicking on the Install button:

Figure 3.16 – Install the reticulate package
- After that, go to the Tools menu and then Global Options…. In the Options windows that pops up, click on Python, then click on Select… to choose your Python interpreter executable. Note that you will have as many executables as the number of environments you have created:
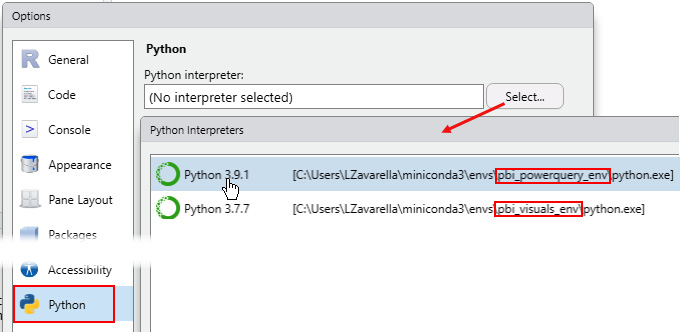
Figure 3.17 – Set your preferred Python interpreter in RStudio
- Choose the Python interpreter with the latest version (in our case 3.9.1). You'll be asked to restart the current R session. Choose Yes.
- Now you can open a new Python script file by clicking on the green + icon in the top left and then choosing Python Script:
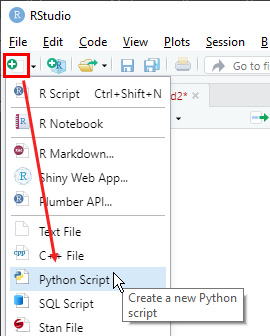
Figure 3.18 – Create a new Python script in RStudio
- Write the code a = [1, 2] in the new script file, highlight it, and then click the Run icon in the top right:
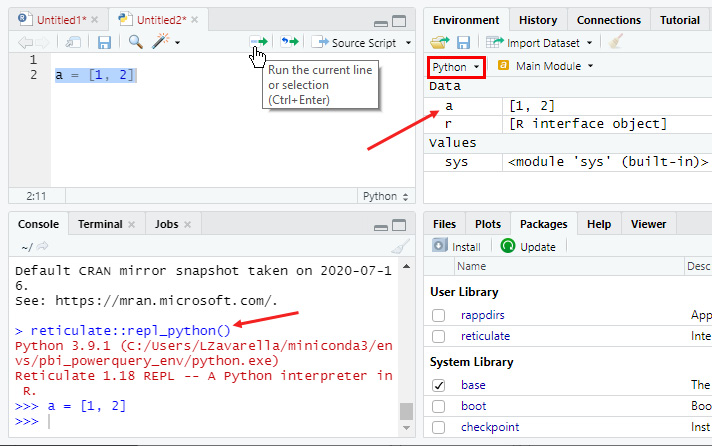
Figure 3.19 – Run your first Python script in RStudio
You can see from the console that RStudio uses reticulate behind the scenes. Moreover, on the top-right panel, you can inspect the Python variables created after the execution of your code.
Great! You have successfully configured RStudio to run your Python code.
Configuring Python with Visual Studio Code
If you're an R language lover, chances are you'd prefer to run both R and Python code on RStudio. However, if you have the spirit of a true Pythonista, you'll definitely enjoy using one of the advanced editors that has been all the rage lately: Visual Studio Code (VSCode). Let's install and configure it!
- Download VSCode from this link (https://code.visualstudio.com/) by clicking on the Download for Windows button.
- Run the executable and click OK when it asks to continue with the User Installer.
- Accept the agreement and click Next on the next window.
- Then keep the default destination folder and click Next.
- Also keep the default Start menu folder on the following window and click Next.
- On the Additional Tasks window, choose the tasks you prefer and click Next.
- Click Install on the recap window.
- After the installation is completed, keep the Launch Visual Studio Code checkbox flagged and click Finish.
- After VSCode has started, click on the Extensions icon on the left, then start entering the python string and click on the Python extension:
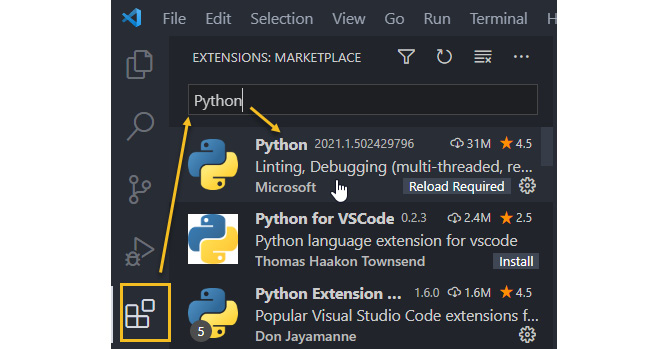
Figure 3.20 – Run your first Python script in RStudio
- Click on Install on the extension's welcome page on the main panel.
- Now go to the File menu at the top and click Open Folder….
- Create a new test folder named Hello from the Open Folder windows and then select that folder:
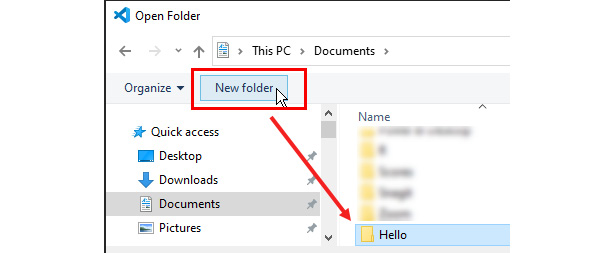
Figure 3.21 – Create a new folder on the fly and select it in the Open Folder window
- Now you have to select the Python interpreter accessing the Command Palette using Ctrl + Shift + P. Then start entering the interpreter string and click Python: Select Interpreter:
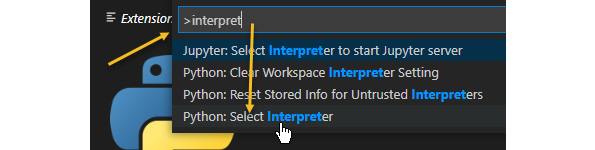
Figure 3.22 – Choose the Python: Select Interpreter option in the Command Palette
- You'll be prompted to select one of the actual environments you have on your machine. Choose the pbi_powerquery_env environment:
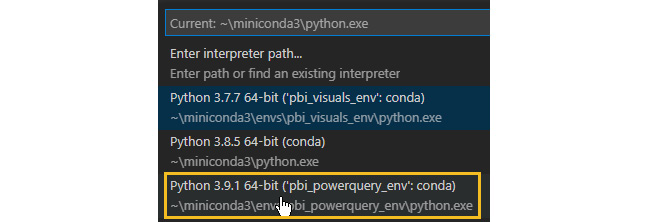
Figure 3.23 – Select your preferred environment
- You can see the selected environment on the status bar on the left:

Figure 3.24 – Check the selected environment on the status bar
- Go back to your HELLO folder in the Explorer panel on the left. Click on the new file icon next to the HELLO label and name the new file hello.py:

Figure 3.25 – Create a new file named hello.py in the Hello folder
- Enter the following code in the new file:
msg = "Hello World"
print(msg)
Then click the run icon (the green triangle) on the top right of the main panel:

Figure 3.26 – Enter the sample code and run it
- You can see the result in the following Terminal output:
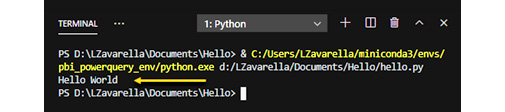
Figure 3.27 – Your first Python script run in VSCode
Very good! Your VSCode is now configured correctly to run Python scripts.
Configuring Power BI Desktop to work with Python
Since you have everything you need installed, you can now configure Power BI Desktop to interact with Python engines and IDEs. This is really a very simple task:
- In Power BI Desktop, go to the File menu, click on the Options and settings tab, and then click on Options:
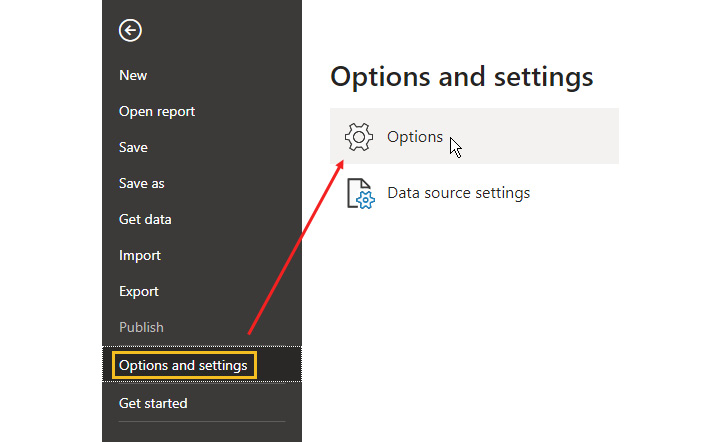
Figure 3.28 – Opening the Power BI Desktop Options and settings window
- In the Options window, click on the Python scripting link on the left. The contents of the panel on the right will update, giving you the option to select the Python environment to reference and the Python IDE to use for Python visuals. By default, the detected interpreter is the default one installed by Miniconda. In order to select a specific environment, you need to choose Other and then click Browse and supply a reference to your environment folder:
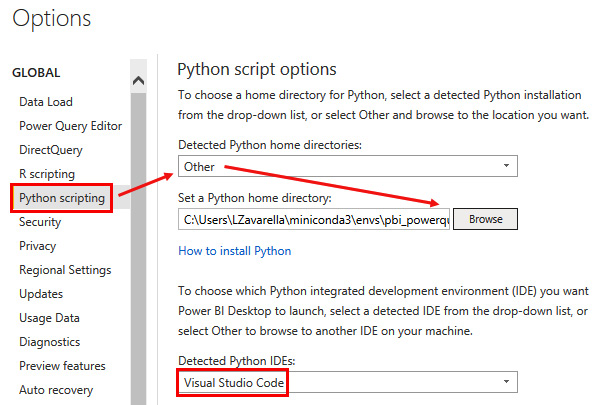
Figure 3.29 – Configuring your Python environment and IDE in Power BI
Usually, you can find the default environments folder in C:Users<your-username>miniconda3envs. Then select your pbi_powerquery_env subfolder.
- By default, Power BI recognizes VSCode as a Python IDE. Keep it as is and click OK.
You can debug Python code written in Python Visuals in your favorite Python IDE in the same way as seen for R in Chapter 2, Configuring R with Power BI. By clicking on the arrow at the top right of the Python Script Editor of a Python Visual, a block of code is opened in VSCode that loads the dataset provided as input to Python Visual and then allows you to run the rest of the code in order to debug it:

Figure 3.30 – Opening the Python code of a Python Visual in VSCode
The code opened in VSCode highlights the Python wrapper injected by Power BI in order to load the dataset data as input to Python Visual:
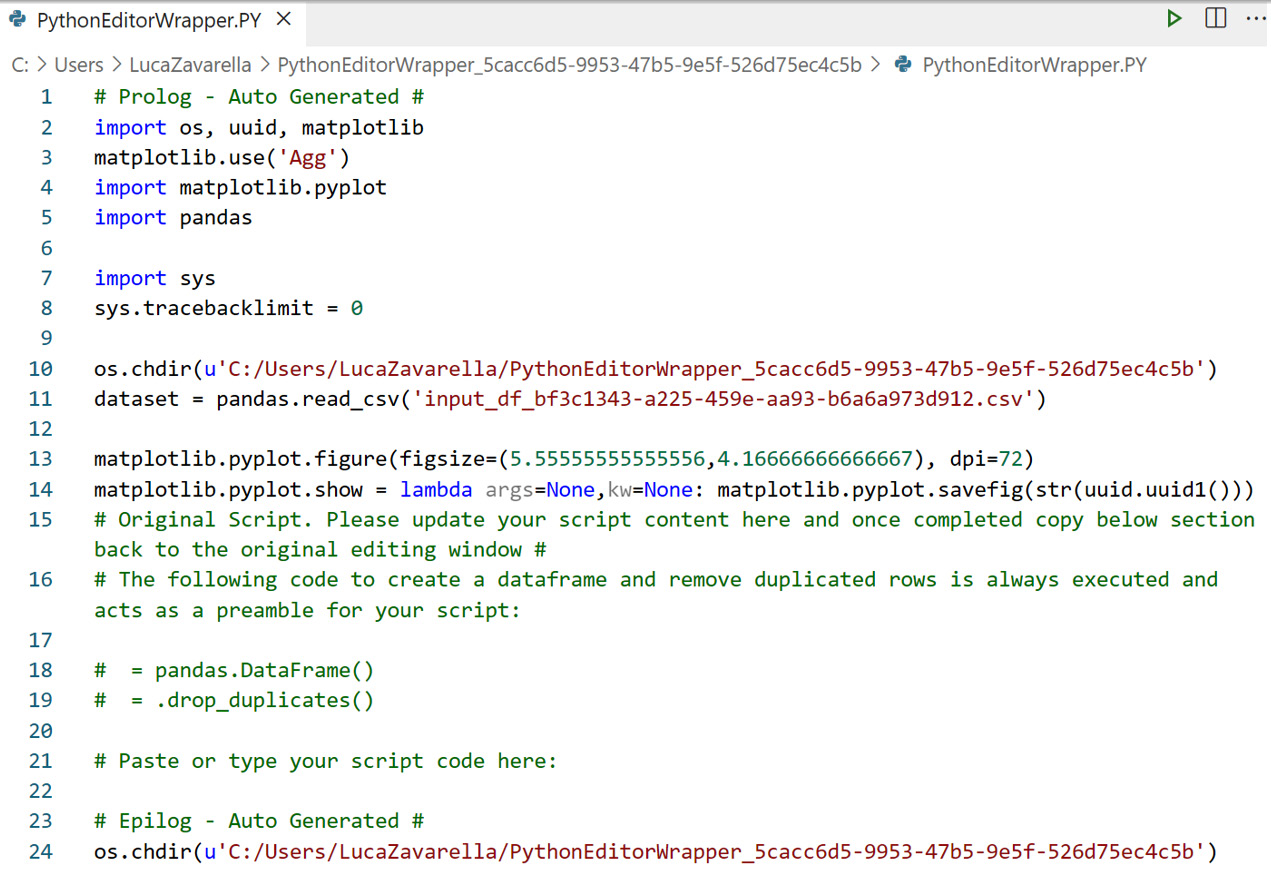
Figure 3.31 – Debugging the Python code of a Python Visual in VSCode
So you can see from Figure 3.35 that some libraries are imported by default into a Python Visual. Nevertheless, the code you'll find in the following chapters reloads some of those libraries deliberately, in order to make the code itself more readable and in order to make it reproducible in other contexts than Power BI. Keep in mind that this wrapper code will be executed on every refresh of the Python Visual.
Now let's see how to properly configure your environment to be able to use R with the Power BI service.
Configuring the Power BI service to work with R
As you have already learned from Chapter 2, Configuring R with Power BI, in order to allow the Power BI service to use R in the data transformation steps with Power Query, you must install the on-premises data gateway in personal mode on an external machine, on which an R engine is installed. The same thing applies to Python with Power Query in the Power BI service. So, if you have not installed the on-premises data gateway yet, do it by following the steps in Chapter 2.
Important note
Python engines and R engines can be installed on the same external machine and referenced by a single data gateway. You must make sure, however, that the machine's resources are sufficient to handle the load of requests coming from the Power BI service.
Sharing reports that use Python scripts in the Power BI service
What was said about how to share reports that use R scripts for data transformations in the Power BI service in Chapter 2, Configuring R with Power BI, also applies to reports that use Python scripts. Consider the following tip in summary.
Tip
You can use an unofficial architecture that makes use of a personal data gateway associated not with a physical person, but with a fictitious "service" user. The credentials of this user are shared between all those analysts who use Python (along with R) code to transform data into their reports. Also, since the machine with the Python engines referenced by the gateway is shared, it must remain on during periods of scheduled activity. The same machine often hosts the R engines too. An Azure Windows Virtual Machine, on which the R and Python engines and the data gateway run, is often used in this architecture.
As a reminder, Figure 3.31 summarizes the aforementioned architecture:
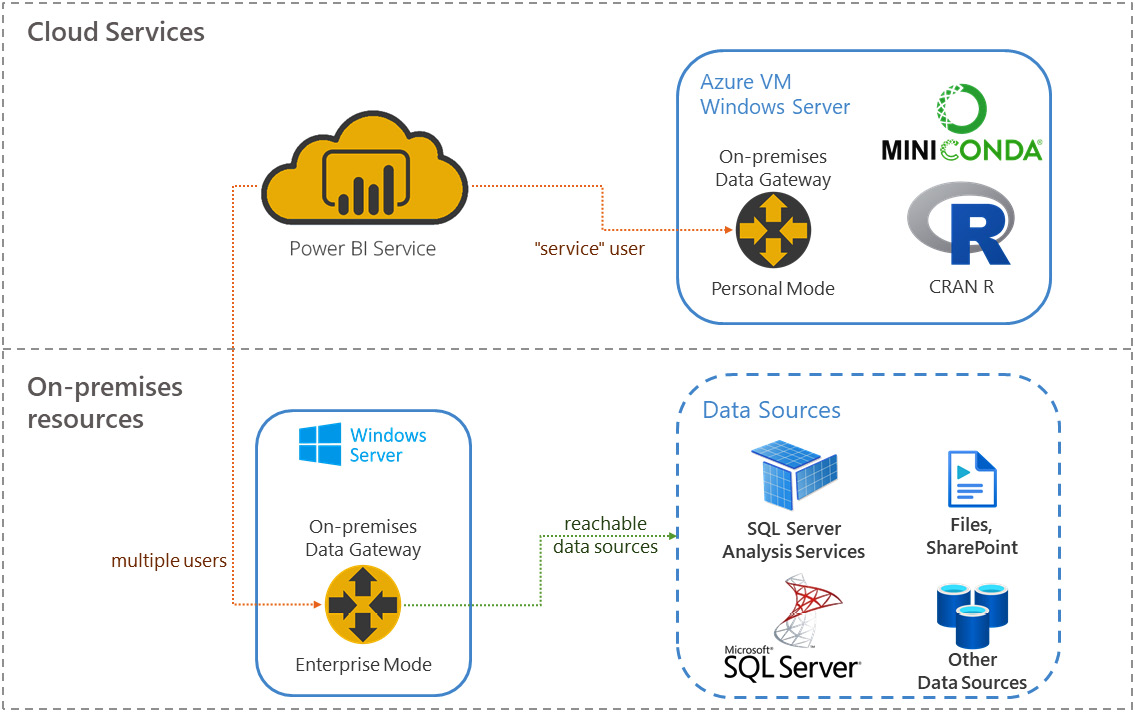
Figure 3.32 – Enterprise architecture for the use of Python and R in data transformations
Thanks to this architecture it is possible to allow a group of analysts to be able to use Python scripts in their reports, despite the limitations imposed by the on-premises data gateway in personal mode.
That said, in addition to the limitations seen for Python scripts in Power Query, there are some important ones to be aware of for Python visuals as well.
Limitations of Python visuals
Python visuals have some important limitations regarding the data they can handle, both input and output:
- A Python visual can handle a dataframe with only 150,000 rows. If there are more than 150,000 rows, only the first 150,000 rows are used.
- Python visuals have an output size limit of 2 MB.
You must also be careful not to exceed the 5-minute runtime calculation for a Python visual in order to avoid a time-out error. Moreover, in order not to run into performance problems, the resolution of the Python visual plots is fixed at 72 DPI.
As you can imagine, some limitations of Python visuals are different depending on whether you run the visual on Power BI Desktop or the Power BI service.
When creating reports in Power BI Desktop, you can do the following:
- Install any kind of package (PyPI and custom) in your engine for Python visuals.
- Access the internet from a Python visual.
When creating reports in the Power BI service, you can do the following:
- You can only use the PyPI packages listed at this link: https://bit.ly/powerbi-python-limits.
- You cannot access the internet from a Python visual.
Important note
In contrast to the case of R visuals, you do not have the option of developing a custom Python visual.
Once one of your reports is published on the Power BI service, you can decide to share it on your blog, on one of your websites, or on social media via the Publish to web option. Unfortunately, Python visuals (as well as R visuals) are not usable on reports to be published publicly on the web by design by Microsoft.
Tip
If you absolutely need to publish a particular visualization to the web, remember that custom R visuals overcome the limitation on publishing to the web. So, you need to switch from Python to R.
Summary
In this chapter, you learned about the most popular free Python distributions in the community and the best practices for their use.
Using the unique features of Power BI Desktop and the Power BI service, you have learned how to properly create specific Python environments.
You also learned that the most popular IDE in the R community (RStudio) can also run Python code. In addition, you have installed and configured VSCode, which is to date one of the most widely used advanced editors for Python.
You were also introduced to all of the best practices for properly configuring both Power BI Desktop and the Power BI service with Python, whether in a development or enterprise environment.
Finally, you've learned some of the limitations on using Python with Power BI, knowledge of which is critical to avoid making mistakes in developing and deploying reports.
In the next chapter, we'll finally start working with R and Python scripts in Power BI, doing data ingestion and data transformation.