
Chapter 1: Where and How to Use R and Python Scripts in Power BI
Power BI is Microsoft's flagship self-service business intelligence product. It consists of a set of on-premises applications and cloud-based services that help organizations integrate, transform, and analyze data from a wide variety of source systems through a user-friendly interface.
The platform is not limited to data visualization. Power BI is much more than this, when you consider that its analytics engine (Vertipaq) is the same as SQL Server Analysis Services (SSAS) and Azure Analysis Services. It also uses Power Query as its data extraction and transformation engine, which we find in both Analysis Services and Excel. The engine comes with a very powerful and versatile formula language (M) and GUI, thanks to which you can "grind" and shape any type of data into any form.
Moreover, Power BI supports DAX as a data analytic formula language, which can be used for advanced calculations and queries on data that has already been loaded into tabular data models.
Such a versatile and powerful tool is a godsend for anyone who needs to do data ingestion and transformation in order to build dashboards and reports to summarize a company's business.
Recently, the availability of huge amounts of data, along with the ability to scale the computational power of machines, has made the area of advanced analytics more appealing. So, new mathematical and statistical tools have become necessary in order to provide rich insights. Hence the integration of analytical languages such as Python and R within Power BI.
R or Python scripts can only be used within Power BI with specific features. Knowing which Power BI tools can be used to inject R or Python scripts into Power BI is key to understanding whether the problem you want to address is achievable with these analytical languages.
This chapter will cover the following topics:
- Injecting R or Python scripts into Power BI
- Using R and Python to interact with your data
- R and Python limitations on Power BI products
Technical requirements
This chapter requires you to have Power BI Desktop already installed on your machine (you can download it from here: https://aka.ms/pbiSingleInstaller).
Injecting R or Python scripts into Power BI
In this first section, Power BI Desktop tools that allow you to use Python or R scripts will be presented and described in detail. Specifically, you will see how to add your own code during the data loading, data transforming, and data viewing phases.
Data loading
One of the first steps required to work with data in Power BI Desktop is to import it from external sources:
- There are many connectors that allow you to do this, depending on the respective data sources, but you can also do it via scripts in Python and R. In fact, if you click on the Get data icon in the ribbon, not only the most commonly used connectors are shown, but you can select other ones from a more complete list by clicking on More...:
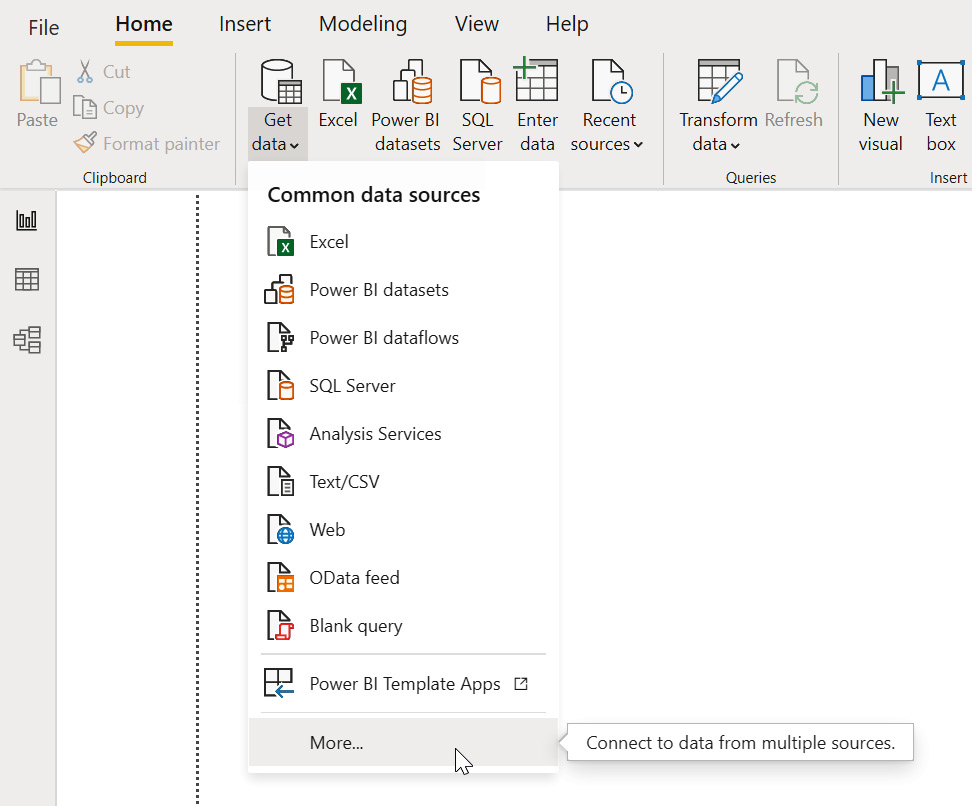
Figure 1.1 – Browse more connectors to load your data
- In the new Get Data window that pops up, simply start typing the string script into the search text box, and immediately the two options for importing data via Python or R appear:
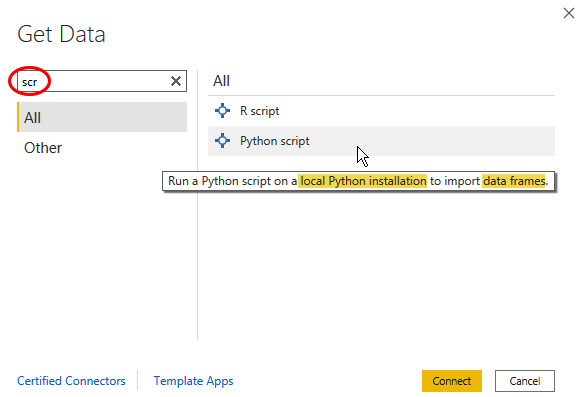
Figure 1.2 – Showing R script and Python script into the Get Data window
- Reading the contents of the tooltip, obtained by hovering the mouse over the Python script option, two things should immediately jump out at you:
a) A local installation of Python is required.
b) What can be imported through Python is a data frame.
The same two observations also apply when selecting R script. The only difference is that it is possible to import a pandas DataFrame when using Python (a DataFrame is a data structure provided by the pandas package), whereas R employs the two-dimensional array-like data structure called an R data frame, which is provided by default by the language.
- After clicking on the Python script option, a new window will be shown containing a text box for writing the Python code:
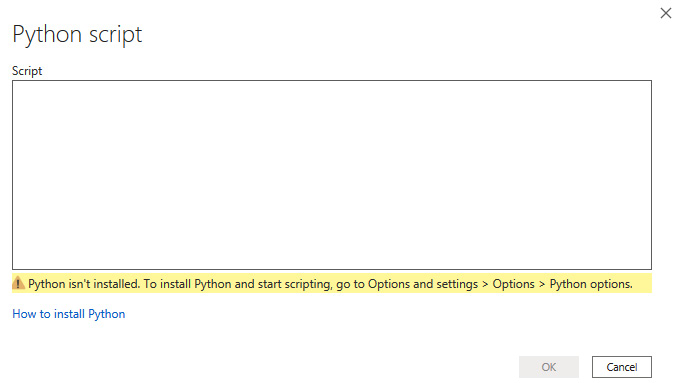
Figure 1.3 – Window showing the Python script editor
As you can see, it's definitely a very skimpy editor, but in Chapter 3, Configuring Python with Power BI, you'll see how you can use your favorite IDE to develop your own scripts.
- Taking a look at the warning message, Power BI reminds you that no Python engine has been detected, so it must be installed. Clicking on the How to install Python link will cause a Microsoft Docs web page to open, explaining the steps to install Python.
Microsoft suggests installing the base Python distribution, but in order to follow some best practices on environments, we will install the Miniconda distribution. The details of how to do this and why will be covered in Chapter 3.
- If you had clicked on R script instead, a window for entering code in R, similar to the one shown in Figure 1.4, would have appeared:
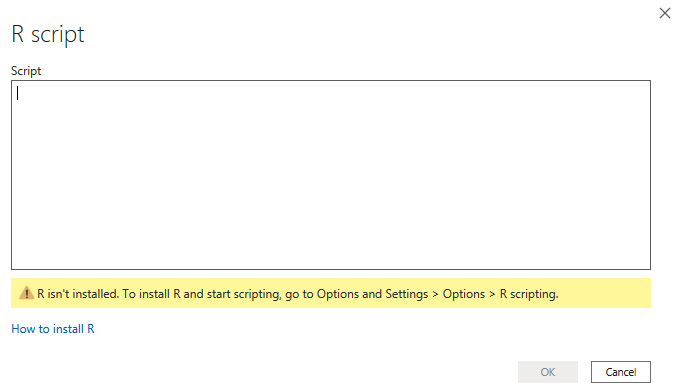
Figure 1.4 – Window showing the R script editor
As with Python, in order to run code in R, you need to install the R engine on your machine. Clicking on the How to install R link will open a Docs page where Microsoft suggests installing either Microsoft R Open or the classic CRAN R. Chapter 2, Configuring R With Power BI, will show you which engine to choose and how to configure your favorite IDE to write code in R.
In order to import data using Python or R, you need to write code in the editors shown in Figure 1.3 and Figure 1.4 that assigns a pandas DataFrame or an R dataframe to a variable, respectively. You will see concrete examples throughout this book.
Next, let's look at transforming data.
Data transformation
It is possible to apply a transformation to data already imported or being imported, using scripts in R or Python. Should you want to test this on the fly, you can import the following CSV file directly from the web: http://bit.ly/iriscsv. Follow these steps:
- Simply click on Get data and then Web to import data directly from a web page:
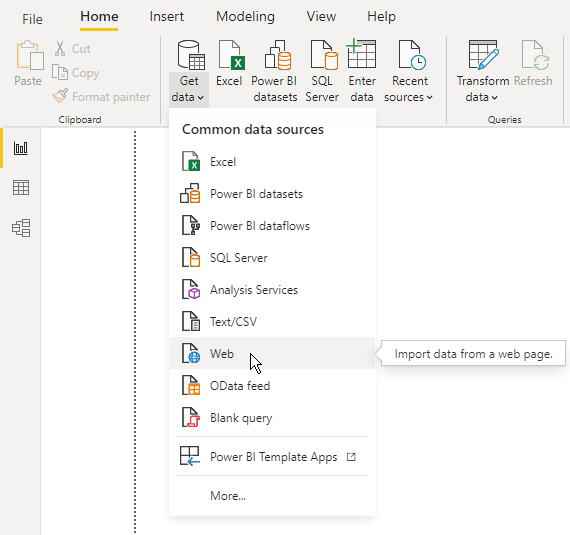
Figure 1.5 – Select the Web connector to import data from a web page
- You can now enter the previously mentioned URL in the window that pops up:
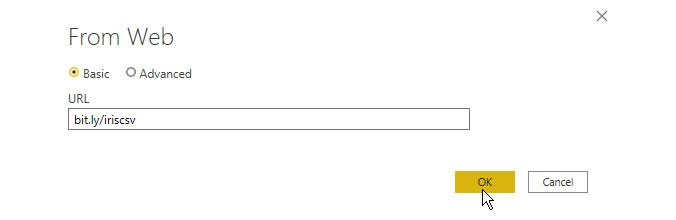
Figure 1.6 – Import the Iris data from the web
Right after clicking OK, a window will pop up with a preview of the data to be imported.
- In this case, instead of importing the data as-is, click on Transform Data in order to access the Power Query data transformation window:
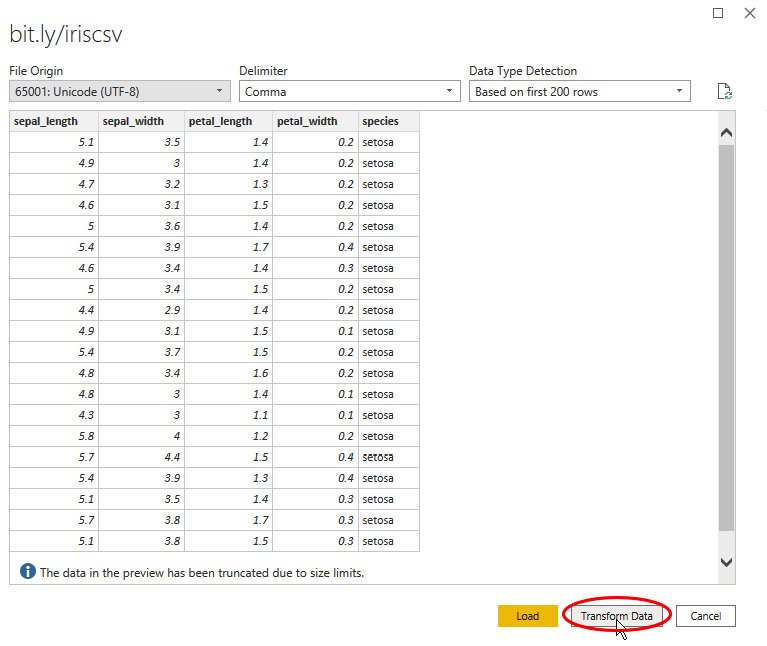
Figure 1.7 – Imported data preview
- It is at this point that you can add a transformation step using a Python or R script by selecting the Transform tab in Power Query Editor:
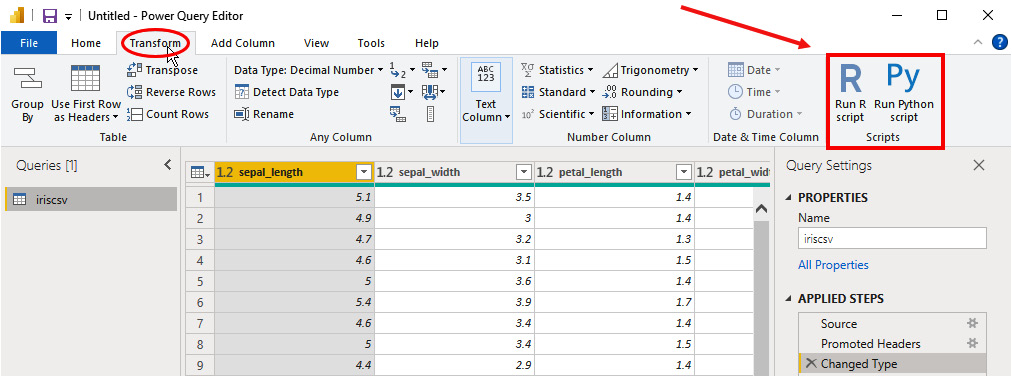
Figure 1.8 – R and Python script tools into Power Query Editor
- By clicking on Run Python script, you'll cause a window similar to the one you've already seen in the data import phase to pop up:
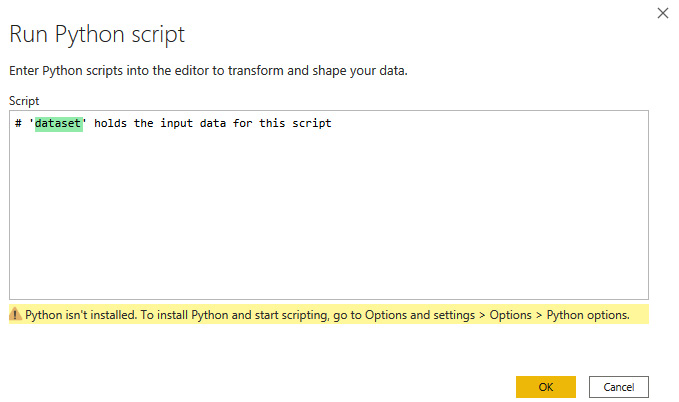
Figure 1.9 – The Run Python script editor
If you carefully read the comment in the text box, you will see that the dataset variable is already initialized and contains the data present at that moment in Power Query Editor, including any transformations already applied. At this point, you can insert your Python code in the text box to transform the data into the desired form.
- A similar window will open if you click on Run R script:
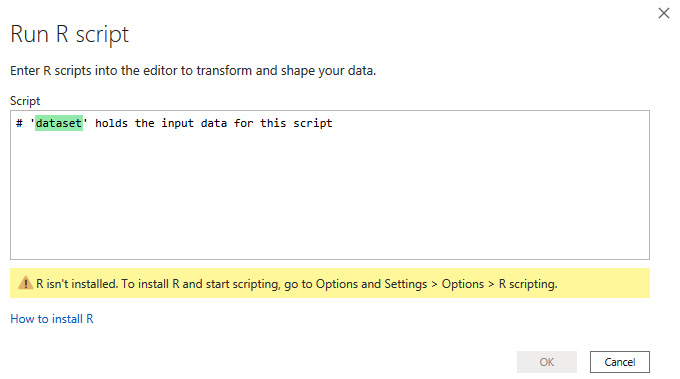
Figure 1.10 – The Run R script editor
Also, in this case, the dataset variable is already initialized and contains the data present at that moment in Power Query Editor. You can then add your own R code and reference the dataset variable to transform your data in the most appropriate way.
Next, let's look at visualizing data.
Data visualization
Finally, your own Python or R scripts can be added to Power BI to create new visualizations, in addition to those already present in the tool out of the box:
- Assuming we resume the data import activity begun in the previous section, once the Iris dataset is loaded, simply click Cancel in the Run R script window, and then click Close & Apply in the Home tab of Power Query Editor:
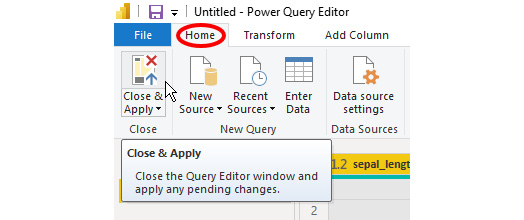
Figure 1.11 – Click Close & Apply to import the Iris data
- After the data import is complete, you can select either the R script visual or Python script visual option in the Visualizations pane of Power BI:
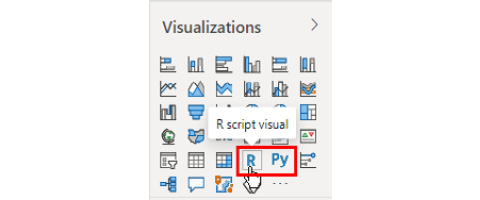
Figure 1.12 – The R and Python script visuals
- If you click on Python script visual, a window pops up asking for permission to enable script code execution, as there may be security or privacy risks:
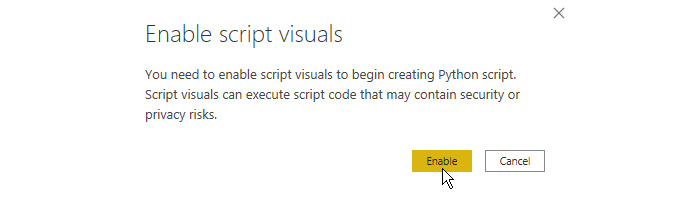
Figure 1.13 – Enable the script code execution
- After enabling code execution, in Power BI Desktop you can see a placeholder for the Python visual image on the report canvas and a Python script editor at the bottom:
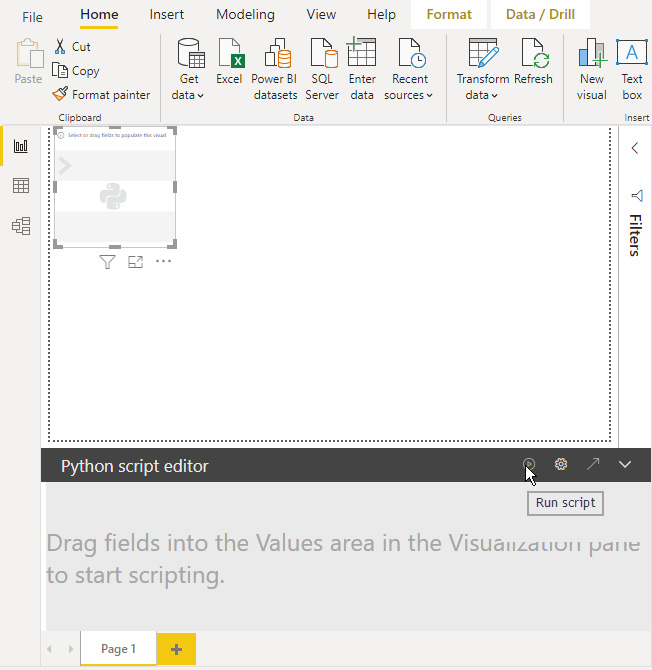
Figure 1.14 – The Python visual layout
You can now write your own custom code in the Python editor and run it via the Run script icon highlighted in Figure 1.14 to generate a Python visualization.
A pretty much identical layout occurs when you select R script visual.
Using R and Python to interact with your data
In the previous section, you saw all the ways you can interact with your data in Power BI via R or Python scripts. Beyond knowing how and where to inject your code into Power BI, it is very important to know how your code will interact with that data. It's here that we see a big difference between the effect of scripts injected via Power Query Editor and scripts used in visuals:
- Scripts via Power Query Editor: This type of script will transform the data and persist transformations in the model. This means that it will always be possible to retrieve the transformed data from any object within Power BI. Also, once the scripts have been executed and have taken effect, they will not be re-executed unless the data is refreshed. Therefore, it is recommended to inject code in R or Python via Power Query Editor when you intend to use the resulting insights in other visuals, or in the data model.
- Scripts in visuals: The scripts used within the R and Python script visuals extract particular insights from the data and only make them evident to the user through visualization. Like all the other visuals on a report page, the R and Python script visuals are also interconnected with the other visuals. This means that the script visuals are subject to cross-filtering and therefore they are refreshed every time you interact with other visuals in the report. That said, it is not possible to persist the results obtained from the visuals scripts in the data model.
Tip
Thanks to the interactive nature of R and Python script visuals due to cross-filtering, it is possible to inject code useful to extract real-time insights from data, but also from external sources (you'll see how in Chapter 9, Calling External APIs to Enrich Your Data). The important thing to keep in mind is that, as previously stated, it is then only possible to visualize such information, or at the most to write it to external repositories (as you will see in Chapter 7, Logging Data from Power BI to External Sources).
In the final section of this chapter, let's look at the limitations of using R and Python when it comes to various Power BI products.
R and Python limitations on Power BI products
The first question once you are clear on where to inject R and Python scripts in Power BI could be: "Is the use of R and Python code allowed in all Power BI products?" In order to have a brief recap of the various Power BI products and their usage in general, here is a concise list:
- Power BI Service: This is sometimes called Power BI Online, and it's the Software as a Service (SaaS) declination of Power BI. It was created to facilitate the sharing of visual analysis between users through Dashboards and Reports.
- Power BI Report Server: This is the on-premises version of Power BI and it extends the capabilities of SQL Server Reporting Services, enabling the sharing of reports created in Power BI Desktop (for Report Server).
- Power BI Embedded: A Microsoft Azure service that allows dashboards and reports to be embedded in an application for users who do not have a Power BI account.
- Power BI Desktop: A free desktop application for Windows that allows you to use almost all of the features that Power BI exposes. It is not the right tool for sharing results between users, but it allows you to share them on Power BI Service and Power BI Report Server. The desktop versions that allow publishing on the two mentioned services are distinct.
- Power BI Mobile: A mobile application, available on Windows, Android, and iOS, that allows secure access to Power BI Service and Power BI Report Server, and that allows you to browse and share dashboards and reports, but not edit them.
Apart from the licenses, which we will not go into here, a summary figure of the relationships between the previously mentioned products follows:
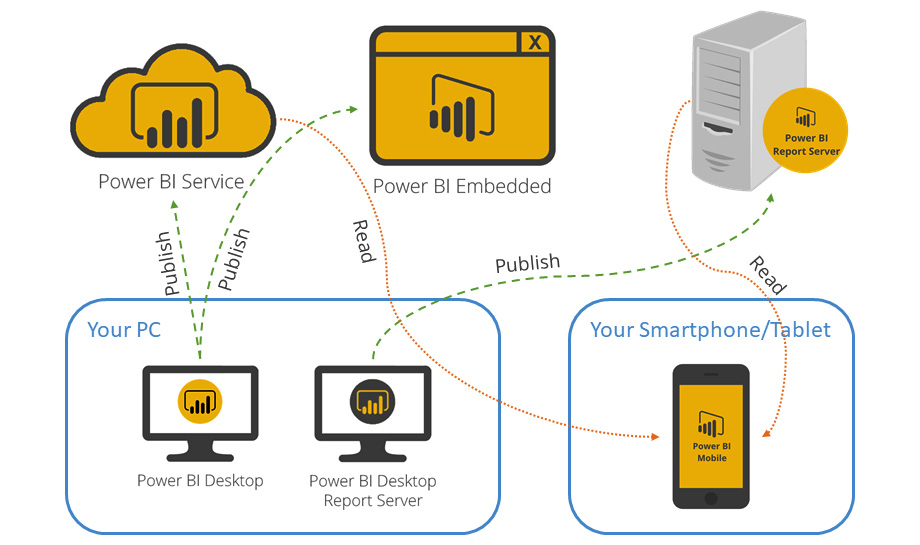
Figure 1.15 – Interactions between Power BI products
Unfortunately, of all these products, only Power BI Service, Power BI Embedded, and Power BI Desktop allow you to enrich data via code in R and Python:
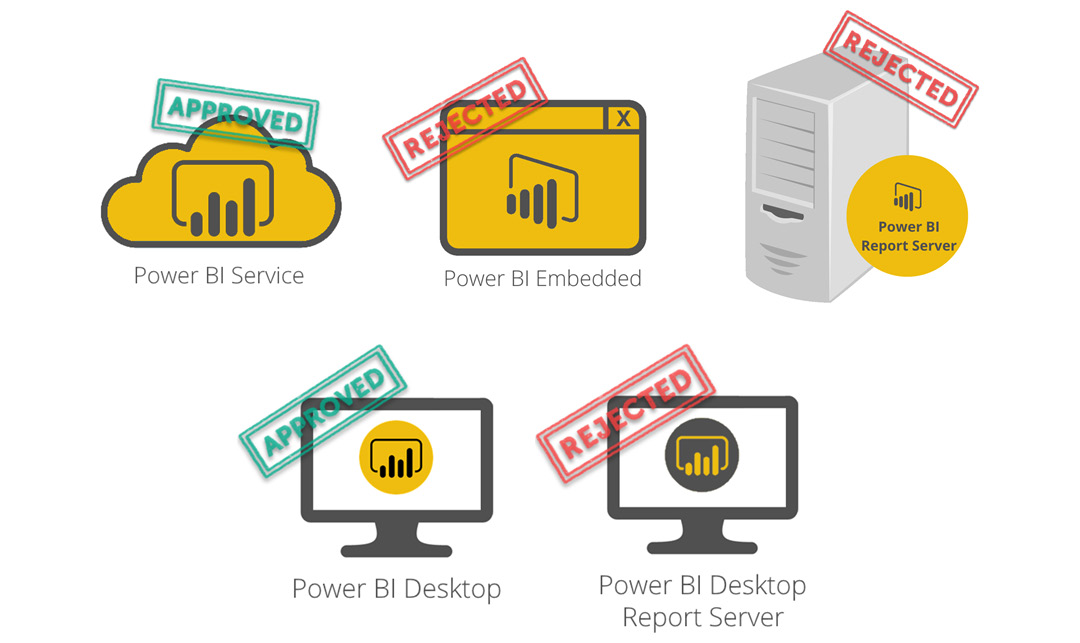
Figure 1.16 – Power BI products compatibility with R and Python
Important note
From here on out, when we talk about Power BI Service in terms of compatibility with analytical languages, what we say will also apply to Power BI Embedded.
So, if you need to develop reports using advanced analytics through R and Python, make sure the target platform supports them.
Summary
This chapter has given a detailed overview of all the ways by which you can use R and Python scripts in Power BI Desktop. During the data ingestion and data transformation phases, Power Query Editor allows you to add steps containing R or Python code. You can also make use of these analytical languages during the data visualization phase thanks to the R and Python script visuals provided by Power BI Desktop.
It is also very important to know how the R and Python code will interact with the data already loaded or being loaded in Power BI. If you use Power Query Editor, both when loading and transforming data, the result of script processing will be persisted in the data model. Also, if you want to run the same scripts again, you have to refresh the data. On the other hand, if you use the R and Python script visuals, the code results can only be displayed and are not persisted in the data model. In this case, script execution occurs whenever cross-filtering is triggered via the other visuals in the report.
Unfortunately, at the time of writing, you cannot run R and Python scripts in any Power BI product. The only ones that provide for running analytics scripts are Power BI Desktop and the Power BI service.
In the next chapter, we will see how best to configure the R engine and RStudio to integrate with Power BI Desktop.