Chapter 5: Planning for Cost Savings – Cleanup
Now that we've learned how to analyze, process, and implement right-sizing techniques, the next part of the cost-saving section is dedicated to cleaning up. This means having full control of your cloud infrastructure and being able to access, quarantine, and delete unused resources where possible.
In this chapter, we will find and remove services and configurations that are deemed unnecessary, either manually or via automation. We will also recognize all the resources that were used temporarily for migration and may have been forgotten. We'll also learn how to analyze cost spikes that may be the result of unattached resources, shared resources, and even unused subscriptions, along with their security implications.
In this chapter, we will cover the following topics:
- Cleaning up the cloud resources
- Byproducts of migrating to Azure
- Identifying cost spikes
By completing this chapter, you will have a clear understanding of the most used best practices and techniques for identifying, managing, and containing the cost of unused or ghost resources.
Technical requirements
For this chapter, you'll need the following:
- A computer with internet connectivity.
- Access to the Azure portal.
- Privileges to access Cost Management information (see https://docs.microsoft.com/en-us/azure/cost-management-billing/costs/assign-access-acm-data).
- To execute cost report scripts, you'll need a host with at least PHP 7.4 and a MySQL or MariaDB database. It's also mandatory to have the initialized and imported billing data from Chapter 3, Monitoring Costs.
You can find the code for this chapter here: https://github.com/PacktPublishing/The-Road-to-Azure-Cost-Governance/tree/main/Chapter%205.
Cleaning up the cloud resources
Another important part of cloud cost saving is the cleanup operation. When dealing with a large number of workloads or complex projects, lots of resources are created just as a transitional step and are often forgotten about and paid for. In this section, we'll learn how to identify and clean up all the unused and unattached resources in your virtual data center.
Cleaning up unused items, as a first approach, represents one of the short-term, quick-win techniques for cost-saving. But, on the other hand, if they're inserted into a recurring process, this will help you uncover any unassigned or unutilized infrastructure (with operational downfalls) and, in general, uncover the gaps in your operational processes that might need extra effort and have a wider impact than costs. In addition, you should plan to periodically assess the evolution of your infrastructure for any ghost resources that may have been left unassigned and unused.
Free stuff on Azure
Before we dive into cleaning up, let's make sure we know that there are lots of free resources in Azure that let you play with the cloud at no cost. At the time of writing, there are two types of free Azure resources:
- Services that are always free, no matter the size, contract, or subscription types: Azure Advisor, Azure Kubernetes Service (AKS – only the orchestrator part), Azure Batch, Azure Policy, Data Catalog, DevTest Labs, inbound inter-VNet data transfer, public Load Balancer, Security Center assessments and recommendations, Service Fabric (the orchestrator part), SQL Server 2019 Developer Edition, and Visual Studio Code.
- Services that are free up to a specific usage/tier: Anomaly Detector, App Bot Service, App Configuration, App Service, Archive Storage, Automation, Azure AD, Azure Cosmos DB, Azure DB for MySQL, Azure DB for PostgreSQL, Azure DevOps, Azure SignalR, Bandwidth (data transfer), Blob Storage, Cognitive Search, Computer Vision, Container Registry, Content Moderator, Custom Vision, Data Factory, Event Grid, Face, File Storage, Form Recognizer, Functions, Key Vault, LUIS, Logic Apps, Machine Learning, Managed Disks, Media Services encoding, Network Watcher, Notification Hubs, Personalizer, QnA Maker, Service Bus, Spatial Anchors, SQL Database, Text Analytics, Translator, Linux VM B1s, Windows VM B1s, and Virtual Networks (VNets).
Detailed information on free Azure resources can be found here: https://azure.microsoft.com/en-us/free. However, we encourage you to take advantage of these free services, especially when cleaning up resources, which you can do by downgrading to a free tier; you'll still be able to play with them.
Important Note:
In addition to the free services and tiers, please bear in mind that all the features in preview are typically at lower or no cost, even if they can't be used for production purposes. This is particularly important when a feature is moving toward General Availability because its price will change, and you will get the final charges in your monthly bill.
Azure Resource Graph
Another important service to learn about, that might be helpful not just across this chapter but in your overall cloud journey, is Azure Resource Graph. This is a service that allows you to execute powerful queries (there is even the Resource Graph Explorer in the portal to help you with it) and scan your subscription(s) for resources, policies, and configuration. But for our exercise, to get all the changes in our resources (as explained at https://docs.microsoft.com/en-us/azure/governance/resource-graph/how-to/get-resource-changes) and update our Configuration Management Database (CMDB) and any compliance tool, we'll need this type of information.
A useful tool to get a complete governance report our of your subscription(s) is the Azure Governance Visualizer, which can be found here: https://github.com/JulianHayward/Azure-MG-Sub-Governance-Reporting.
This tool will help you build a visual hierarchy of your Azure resources and can provide an aggregate consumption report across all the analyzed scopes.
Unassociated services
In your virtual data center, from time to time, you may find a bunch of services that are unassociated with other resources or orphaned. Typically, these are not in use, and they are the result of someone forgetting to delete the complete set of resources, or developers' teams creating a proof of concept (POC) or sample and forgetting to clean up their environment.
An Azure simple single virtual machine (VM), for example, when created via the Azure portal or CLI, will spawn a bunch of collateral resources that can be free of charge such as a VNet or paid for (such as a public static IP address). The key takeaway of this section is that every cloud service that does not have a specific purpose must be tracked, analyzed, and, if deemed unnecessary, disposed of.
The most common resources that are left orphaned in Azure are as follows:
- Unattached disks: These resources represent disks that are not attached to any VM. They might be kept as a backup for deallocated VMs, or they might be simply the result of a VM deletion that did not include their storage. In any case, for unused storage disks, you will need to analyze, validate, and delete or temporarily move them to a cheaper tier.
- Unused storage accounts: As for disks, you might find storage accounts with a few files that have not been accessed for months. You will need to notify the owner that these accounts are not being used and that they will be removed at some point in your cleanup process.
- Static IP addresses: We are not talking about big numbers, but allocating unused or unattached resources is not right. This is valid for static IP addresses as well: these static addresses once gave you access to a VM that is no longer allocated or a service that is no longer needed.
Important Note:
Using a public IPv4 address for unused resources has additional implications. There is a chronic lack of IP addresses that sometimes makes these resources more valuable and expensive, depending on the region. This concept applies throughout the whole set of cloud objects, where prices change (albeit slightly) region by region and according to many local variables.
- Logs: This is a tricky one. When you set up an Azure Monitor solution, you probably want to test and try all the possible logging features. But logs are charged by the total storage retention and transaction (ingestion). Chances are, after some time, you'll find yourself with a large monthly bill for several useless logs that you can get rid of, as explained in this Microsoft article: https://docs.microsoft.com/en-us/azure/azure-monitor/logs/manage-cost-storage.
- Snapshots and backups: Similar to log retention, snapshots and backups, in general, are pieces of storage (and spending) that must become useless at some point because you have a newer version, or because the application changed. In any case, controlling the retention time of your snapshots is a good cost management practice, along with a good log rotation policy that will have older data overwritten instead of growing forever.
- Hidden networking charges: When setting up your virtual data center, you might have been tempted to replicate a networking space that's very similar to what you had on-premises. This led to several peering configurations that are probably unnecessary but still consume resources and money.
Now, let's look at a practical example of how to identify unused resources.
A practical example of unattached disks
You want to make sure you don't have any unattached disks in your Azure virtual data center. This can easily be done by searching through the portal for any managed disk that has a - (dash) as the owner, as explained in the following documentation: https://docs.microsoft.com/en-us/azure/virtual-machines/disks-find-unattached-portal. The following screenshot shows the list of unattached managed disks:
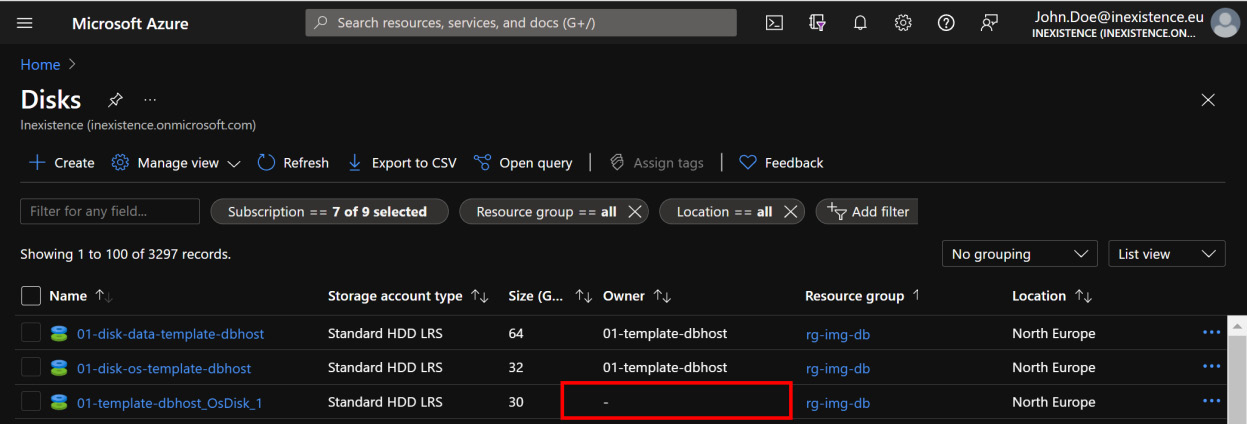
Figure 5.1 – Unattached managed disks
The same list can be obtained via the Azure CLI and exported in a .tsv (tab separated) file:
az disk list --query '[?managedBy==`null`].[id]' -o tsv
Once you have found a disk that matches this requirement, by clicking on it, the page will display a status of Disk State=Unattached. This means that no VM is linked to that disk, and you will have to define a workflow for hibernating and/or canceling that disk(s), according to your IT department's policy.
Important Note:
For classic (unmanaged) disks, the search will show the Attached to column, similar to the managed disk view: if no resource is listed, the disk is orphaned.
We have prepared a diagram to summarize the workflow of deleting unattached storage:
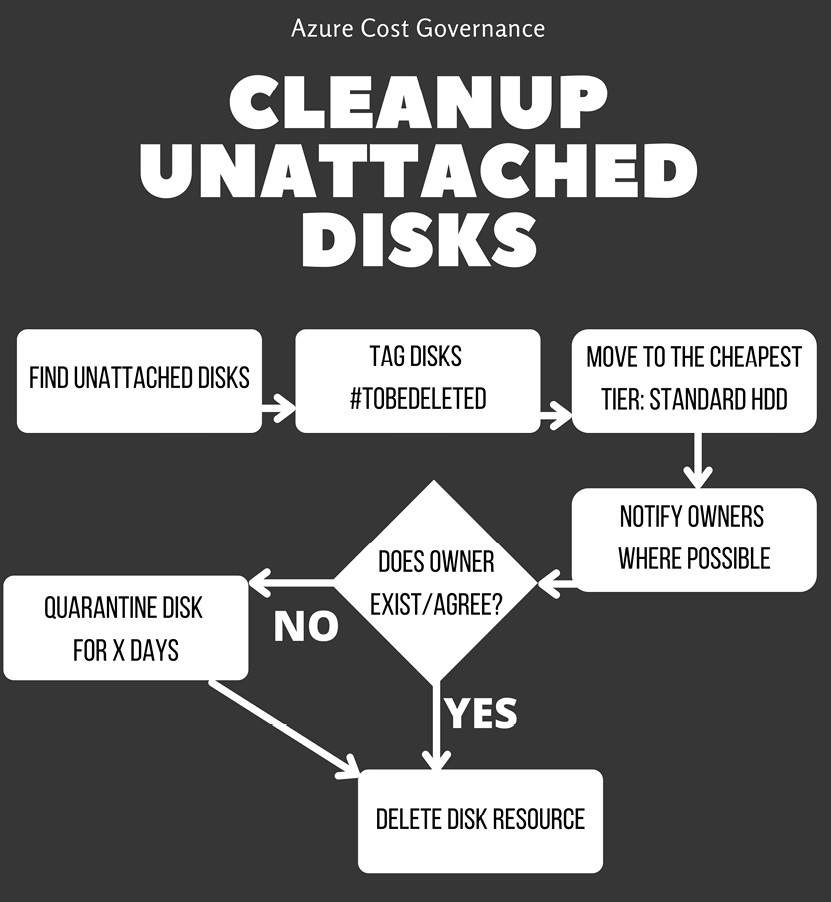
Figure 5.2 – Workflow of hibernating and/or removing unattached disks
Of course, you will have to define your internal deletion policy to allow a grace period before any relevant information gets deleted.
Tip:
Azure managed disks are charged by their target size, regardless of their effective usage. For example, if you need 500 GiB, you will pay for 512 GiB, which is the closest disk size (a P20 for premium disks).
This also means that if you allocate even 1 GiB above the predefined size, you are going to pay for the next size: so, 513 GiB will be charged as a 1,024 GiB (P30). I have seen these errors due to migration tools and automated sizing, so I recommend searching through your managed disk sizing for any suspicious size that might incur unnecessary costs and cleaning them up by reverting to the originally intended size as soon as possible.
Automated waste disposal
A very important thing to always keep in mind is that, except for the free services mentioned earlier, nearly everything you create on a cloud environment has a cost, and if you forget to delete dismissed or unused resources, you may incur unjustified extra costs. For this reason, it's crucial to ensure that all unnecessary items are deleted, possibly according to a retention/contingency policy.
In Chapter 2, What Does Your Cloud Spending Look Like?, we learned about tagging. The same technique can be used to ensure that you track what you need to delete and when. For example, when you dismiss a resource or an entire application, you could add a tag such as delete_after : "YYYY-MM-DD" and periodically check (maybe once a week) with Azure Automation or with our custom scheduler, as we learned in Chapter 4, Planning for Cost Savings – Right Sizing, every resource with that tag to identify which resources need to be safely and permanently deleted.
Tip:
Having a well maintained CMDB that tracks every resource for each business application is crucial for finding out which resources can be tagged, quarantined, and then permanently deleted once dismissed.
Unfortunately, some automatically generated resources may slip from the tagging procedure (since they are generated directly by the Azure backend). Some examples are as follows:
- Backups
- Snapshots
- Public IP addresses
- Network Watcher (auto-enabled)
These resources may be hidden for months before their total monthly spending becomes noticeable: for example, each snapshot can be very cheap, but if you keep piling up snapshots, the total cost can rise to a large amount at the end of the month. You must use the Meter Category/Subcategory analysis to identify such hideous kinds of costs and implement automation to delete useless snapshots or backups after a retention period, or even implement a process to monitor those costs and guard them.
Now, returning to the automation task, you can create a simple scheduled script that extracts all the cloud resources, checks the tag's value, automatically deletes the resource, and then sends a notification. The following workflow diagram illustrates this process (recall the tagging suggestions from Chapter 2, What Does Your Cloud Spending Look Like?):
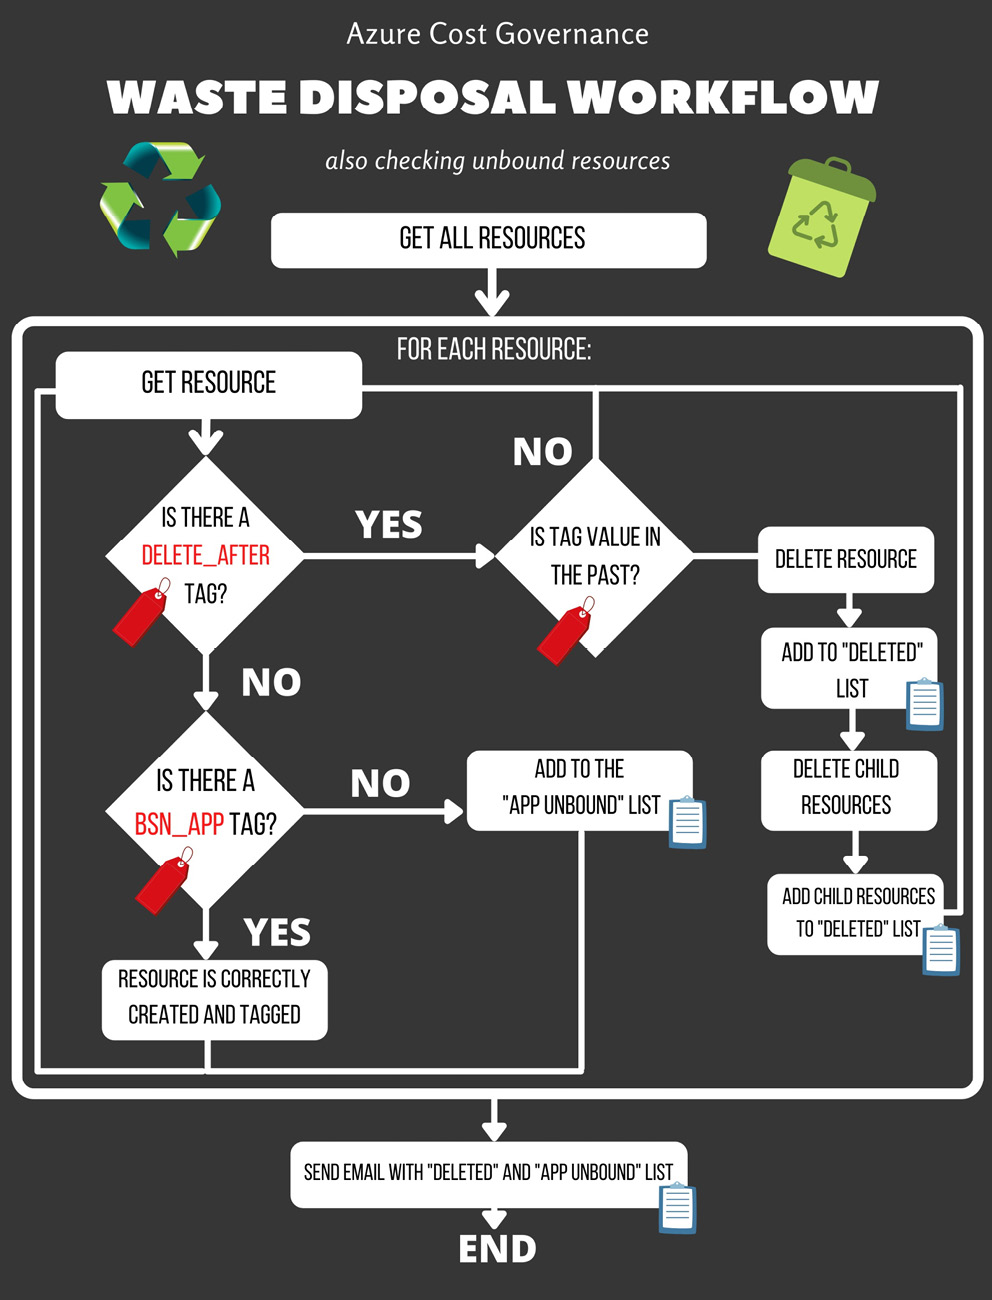
Figure 5.3 – Waste disposal with unbound resources checks workflow
Please note that the previous workflow relies on tagging best practices to do the following:
- Make sure all the relevant resources are tagged and cleaned up.
- Identify which resource should be consciously deleted (based on the delete_after tag) and autonomously delete it.
- Identify the resources unrelated to a business application and notify them because of the following reasons:
- These resources could be hidden costs that are automatically generated (for example, backup snapshots, NICs, and so on).
- They could be manually created, such as temporary resources that are not tagged for any reason (for example, disks).
- They could be legit resources and we simply forgot to add the BSN_APP tag (as in the workflow), and we should be aware of that so that we can remediate it.
Tip:
It's very useful to include the costs of these resources (from their creation, or from the selected month to the current date) in the mail report, just to monitor the extra costs and savings from the automation process.
Automating the process of deleting unused resources is a good practice. Now, let's dive into the unutilized, yet allocated, networking resources that may add very little to the monthly bill but have several additional implications that require them to be cleaned up properly.
Cleaning up networking resources
In my experience, many customers approach cloud networking as they would their on-premises set of switches and routers. Unfortunately, this is not the best approach – not from a configuration perspective – as it leads to many issues and misconfigurations, and especially not from a cost perspective. In your data center, the network cabling, switching, and routing are a part of the infrastructure's initial cost, but in the cloud, this is paid for by consumption, just like any other service.
In public clouds, bandwidth is charged and several things will add to your billing, even if they are probably unused. As explained at https://azure.microsoft.com/en-us/pricing/details/virtual-network/, when you want to connect the network between two VNets, you should use a peering configuration, which is a paid service.
In the hub and spoke topologies, which are commonly used in enterprises and large companies, peering is used to connect the spokes to the main hub, and the traffic between the hub and spokes generates VNet charges. During the design phase, where possible, you should keep your top talking applications in the same VNet. Once your migration/refactoring/delivery project is complete, we recommend checking that all the remaining peerings are necessary and removing those that aren't.
In this section, we have learned, by using practical examples from our experience in the field, how to get rid of unattached and unutilized resources, from managed disks that no longer have a related VM to any other possible ghost resource that is spending money without providing real value. Now, let's look at what happens when you migrate workloads using tools, processes, and a methodology that sometimes leaves resources behind, and how to properly address them.
Byproducts of migrating to Azure
When you approach a large resource migration project (for example, from an on-premises data center) or an application upgrade, it's normal to have resource duplication, parallel environments, large database backups, or dumps around your infrastructure.
Azure Migrate and Azure Site Recovery
When you have to migrate applications and services to Azure, there are great tools that can help you define your landing resources sizes and tiers.
Azure Migrate is a hub that lets you discover, assess, and migrate your on-premises applications, providing you with insights into how your application will perform in the cloud, as well as the associated costs. It includes several integrated tools and even allows for additional third-party/ISV integrations. For our cleanup section, we will look at Dependency Analysis, which can be very useful for understanding if you can get rid of resources that are unused or under-utilized without impacting other applications. For more information, please refer to https://docs.microsoft.com/en-us/azure/migrate/.
Azure Site Recovery is a Business Continuity and Disaster Recovery (BCDR) strategy tool that can manage VM replication from on-premises virtual and physical servers between Azure regions and even AWS VMs. Please refer to https://docs.microsoft.com/en-us/azure/site-recovery/site-recovery-overview for this.
Using native tools for migration is typically the best practice as you will be able to safely automate the process and get the most out of the applications' performance and cost information. Please be aware that not all workloads are supported and, in some cases, you might have to use third-party migration tools that can make your migration a bit more complex. Let's look at some common practices that might help you either way.
Migration tagging strategy
It's very important to have a structured approach and to keep track of this resource overallocation due to duplication or data protection. My recommendation is to add a tag specifying that some resources are part of the migration project and need to be checked and decommissioned within a specific date or month. In this way, after the end of the migration project, you just have to query resources by tag and you'll easily be able to identify what you need to double-check, power off, and safely decommission, as shown in the following screenshot, by using the highlighted filtering options:
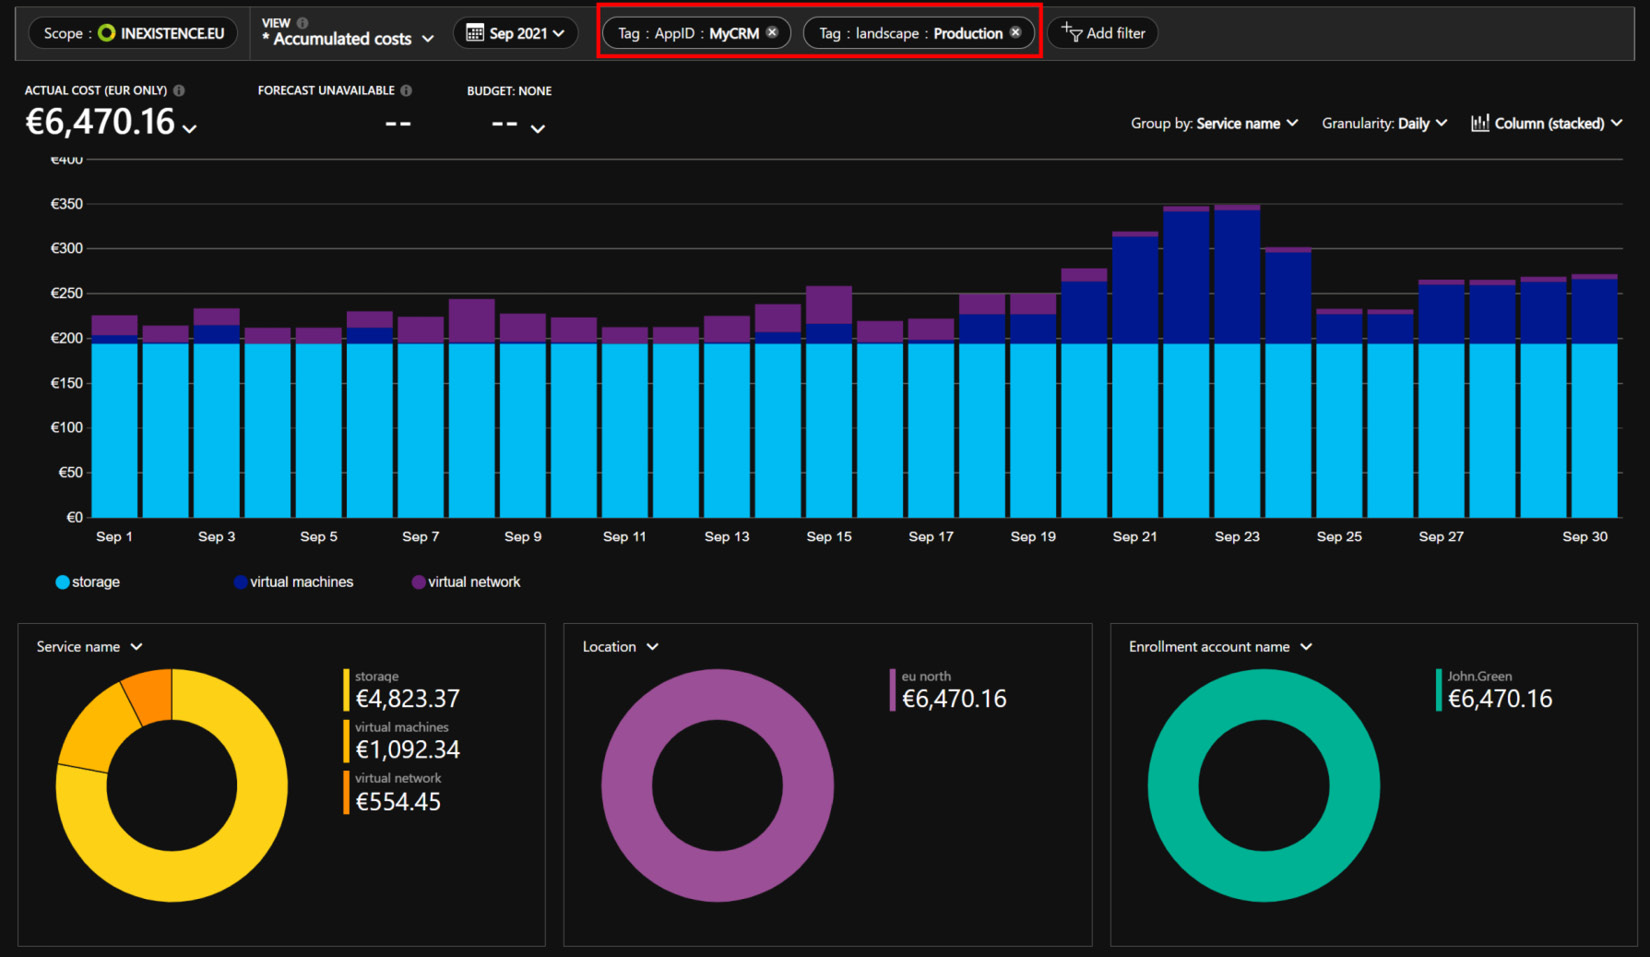
Figure 5.4 – Cost management (filtering by tag)
Of course, all the examples shown in the previous section about inducted costs and derived optimizations (such as disks) should be applied.
If you implement a correct tagging policy for high-impact projects, I also suggest that you verify and monitor the resources' costs using the Azure Cost Management tool, filtering only by tag. This will highlight any hidden resources or costs.
Now, let's dig deeper into this concept with a practical example that will explain how tagging can solve most of the issues that are created when migrating using temporary resources.
A practical example of migrating byproduct tagging
Let's say you are planning an operating system upgrade because of the end-of-support and end-of-life security problems in your cloud infrastructure.
Let's consider your three environments:
- Development
- Testing
- Production
For each environment, starting from the lower-impact one with an application-by-application approach, the steps for the cleanup process are displayed in the following diagram. At the end of the project, you'll have a clear extraction by being able to tag all the resources you need to delete, and you will be able to easily automate how unused resources are disposed of.
The following diagram is a draft workflow of a high-level approach to a massive upgrade project, where you will have to check if each resource must be upgraded, then proceed with the proper tagging, including for temporary resources:

Figure 5.5 – High-level approach to a massive upgrade project
This will allow you to control what is left out of the upgrade and, most of all, the temporary resources that, after a while, can be promptly deleted.
Tip:
If compatible with your project's constraints, please consider creating the parallel environments one at a time. For example, when you switch the application to the new development environment, you'll power off the old development environment, start creating the new test environment, and so on. This approach will limit the co-existence of resources, thus reducing costs.
Now that we've learned how to get rid of unutilized migrations' byproducts, let's look at a cloud best practice that brings additional clarity and discipline to the resources' cleanup.
The snooze and stop workflow
A common practice for large companies, especially when migrating many VMs with unclear scopes and owners, is to configure and enforce a snooze and stop policy. The concept behind this is that in on-premises environments, users sometimes provision a server and then forget about it. This server can then be migrated to the cloud for continuity, even if the user is unreachable.
This typically prompts for a clear and shared company policy that will inform your internal users of the following:
- A VM that has a 5% CPU usage for more than 30 days will be snoozed (switched off) and its disks will be switched to the lowest tier possible (for example, standard HDD).
- All the impacted resources should be immediately tagged as snoozed to avoid accidental power on.
- If nobody claims that particular VM within another 30 days, it will be deleted (keeping the storage at the minimum tier; that is, standard HDD).
- After another 30 days, the associated storage will be deleted as well.
You can use native tools such as VM Insight and Azure Automation, or even Logic Apps, to get all the relevant information and implement this logic. Just be aware that some tools that rely on Log Analytics might result in additional charges for logging the relevant information.
Here is a workflow diagram of the snooze and stop process:
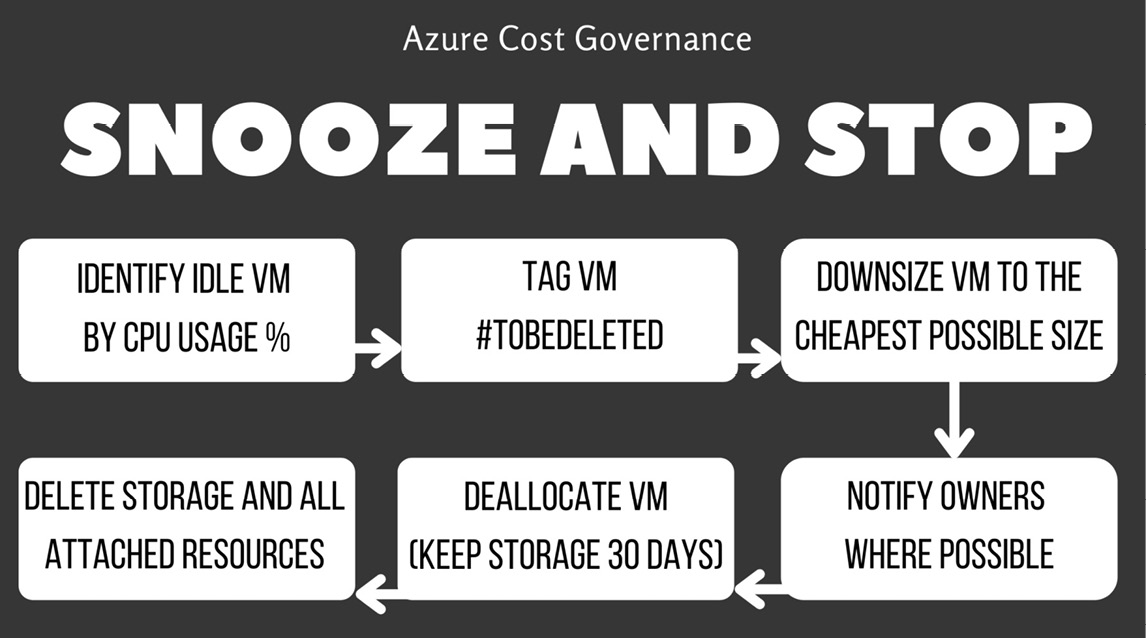
Figure 5.6 – Snooze and stop workflow (use with caution!)
This policy can save you a lot of money in the long run and not just on compute and storage costs, but also the operational cost of keeping workloads that are no longer used or claimed alive and maintaining them.
Important Note:
Make sure that the object/resource you are snoozing is highly advertised for deletion by sending notices via a snooze bulletin to all your internal customers. In my experience, there are many forgotten VMs, especially after migrations, but it may still be possible that you are deleting an object that has its own use. If you are unsure of this, proceed with the snooze process and increase the storage retention to up to 6 months or even 1 year.
In this section, we learned how to identify, analyze, and contain costs that are the result of migrations. Now, let's identify cost spikes (and subsequently remove the unused resources where possible) by starting with cost reports.
Dealing with a CMDB
If you are approaching the cloud with cloud-native applications and no legacy stuff, you are in an optimal position to be able to use all the native services that allow you to safely manage your configurations. But the overwhelming reality of IT infrastructures is still tied to on-premises and legacy applications, which make a CMDB a necessary tool, especially when you're migrating to or adding cloud resources. Deleting a CMDB can be different, depending on your company's requirements, but it should include the following for every registered item:
- A unique identifier
- Name
- Description
- Owner
- Priority
In on-premises and CAPEX financial cost model environments, CMDB is a useful tool for tracking versions of hardware and all the implications of its obsolescence and amortization. So, it's natural that many companies coming from custom data centers have kept this strategy also with cloud services.
Updating a CMDB for legacy data centers might be easy since the pace of changes was bound to the hardware and software contracts in place. However, on the cloud, where a resource might live only for a few minutes, things get tricky.
Many options and vendors now offer public cloud integrated CMDB tools, while the option of integrating a custom tool is still valid thanks to the Azure APIs, which expose every cloud object that you need to map. This is the first step to building your company's application map, where you are registering all your cloud resources according to their business usage and priority and will be able to track application dependencies and, for the sake of this chapter, orphaned objects.
As you may recall from the Tagging section in Chapter 2, What Does Your Cloud Spending Look Like?, where we learned about the importance of having a good tagging process and policy, if your Azure environment is properly tagged, automatically populating a CMDB should be a piece of cake.
Identifying cost spikes
As we learned in Chapter 1, Understanding Cloud Bills, and Chapter 3, Monitoring Costs, at this stage, you should be familiar with all the tools that allow you to get a full picture of your spending and keep it predictable and under budget. Sometimes, however, there are specific conditions that will create unexpected spikes in your costs and will call for a prompt cleanup action. My recommendation is to check the Azure Cost Management page daily and look at a daily stacked view of your spending. The following screenshot shows the cost management page:
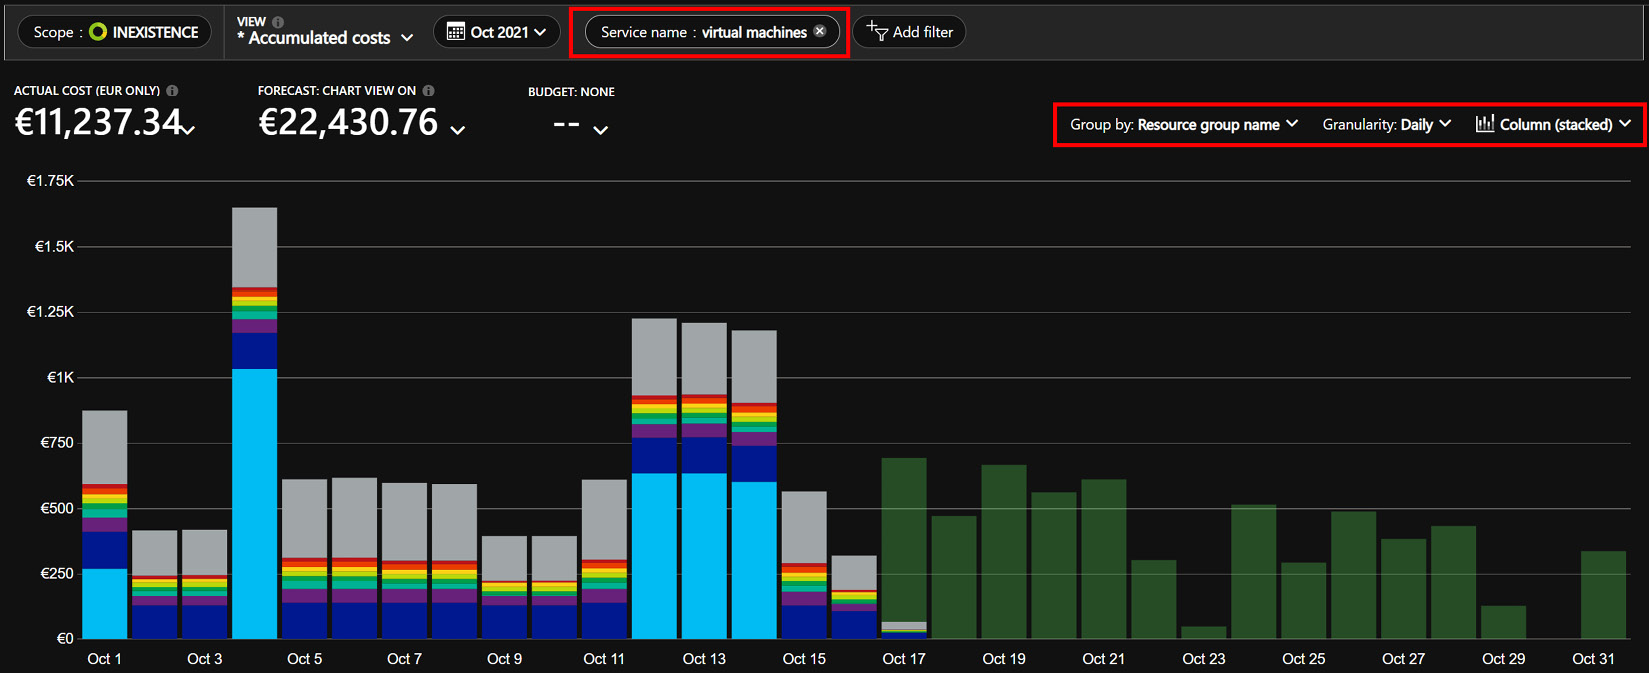
Figure 5.7 – Example of a daily stacked chart on your cost management page
In normal operations, you should be able to identify a nice clean pattern (just as the one pictured in the previous example) and immediately spot any spikes that do not resemble your normal pattern of operations.
Spikes can be caused by many underlying issues:
- An application that is calling a service too many times due to a bug
- A problem with the network prompting too many retries
- An application having an issue and logging 10 times the amount of normal logs
- A spike in network egress traffic, leading to a security breach
- A serverless PaaS project suddenly having a spike in user requests
- A seemingly innocent change that was made in a database configuration that suddenly logged tons of storage
- A service under attack, such as from a DDoS attack, that will cause spikes in the egress traffic and transactions
Important Note:
When you buy reservations, the total amount that's purchased for that service will spike up on the day you reserved it. For it to be spread throughout the timeframe, you must use the Amortized cost option, where you'll be able to see the daily cost of the reservation operation, as we'll see in the next chapter.
If you set up your budgets and alerts correctly, as you learned in Chapter 3, Monitoring Costs, you should be able to spot any spikes within 1-2 days (which is the aggregation of the average time for Azure Billing).
Important Note:
Checking for these spikes can also uncover application issues and is considered a best practice for all cloud deployments.
But for all the unmonitored resources and workloads, my recommendation is to look at your Azure spending daily so that you can act quickly and fix any underlying issues that caused the spike.
Important Note:
There are several proactive services you can use to mitigate a security attack, so there will be cost implications of a DDoS attack.
Now, let's analyze a few cases where identifying spikes is complex and sometimes has collateral implications on spending resources.
Per-meter category split cost report
Setting budgets on costs or forecasts for each resource group, each application, or at the subscription level can help you identify spikes, but sometimes, this method has some drawbacks, as follows:
- A lot of manually defined budget alerts, which you need to maintain when adding resources.
- Resource group budget alerts, which may include resources that are tied to different applications.
- Budget alerts created at the subscription level may be too generic.
Budget alerts are a good start but require deep manual analysis to identify which resource is the extra-spending one. Previously, we learned how to automate cost details extraction using the Cost Management feature and ingest the costs into a custom database. If you implement daily extraction, coupled with daily ingestion, you may create a customized day-over-day mail report.
Important Note:
Daily cost exports do not have complete cost information for today (since we're still in the day). So, after the ingestion process, please consider working up to the full completed day: yesterday.
Once you have all the data, I suggest creating the following reports (with a tabular output sample):
- Meter category day-versus-day: This report compares costs split by Meter Category of day-1 (yesterday) to day-2 and highlights every spike after a certain threshold:
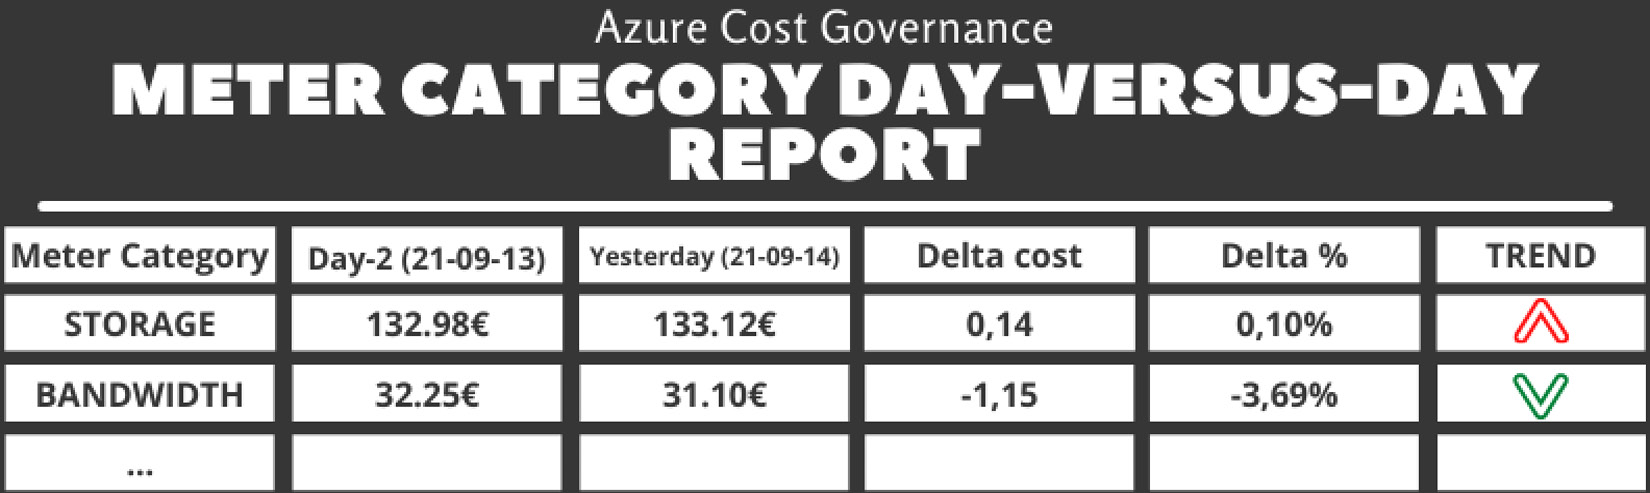
Table 5.1 – The meter category day-versus-day report
You can find the code for this report in the report_metercat_day_day.php file on GitHub at https://github.com/PacktPublishing/The-Road-to-Azure-Cost-Governance/blob/main/Chapter%205/report_metercat_day_day.php.
- Meter category current month-to-date versus (month-1)-to-date: This report compares costs split by Meter category based on month-to-date (of this month) versus the month-to-date (of the previous month) costs:
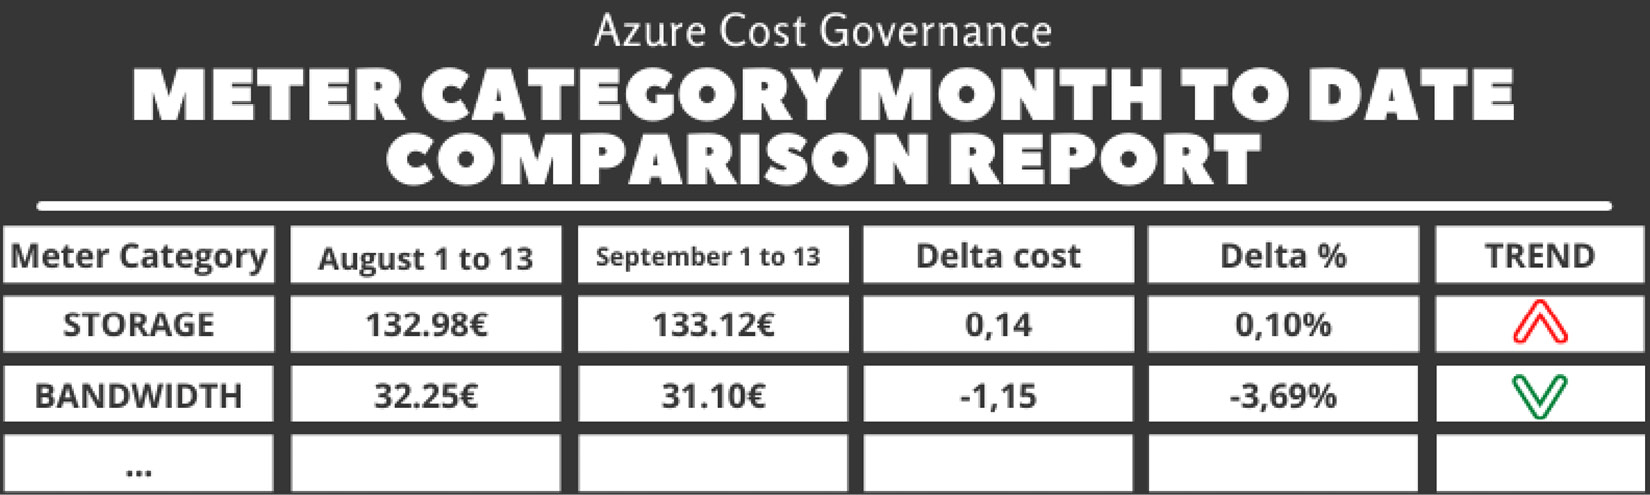
Table 5.2 – The meter category month to date comparison report
You can find the code for this report in the report_metercat_month_to_date.php file on GitHub at https://github.com/PacktPublishing/The-Road-to-Azure-Cost-Governance/blob/main/Chapter%205/report_metercat_month_to_date.php.
- Resource group day-versus-day: This report compares costs split by resource group of day-1 (yesterday) to day-2 and highlights every spike after a certain percentage threshold:
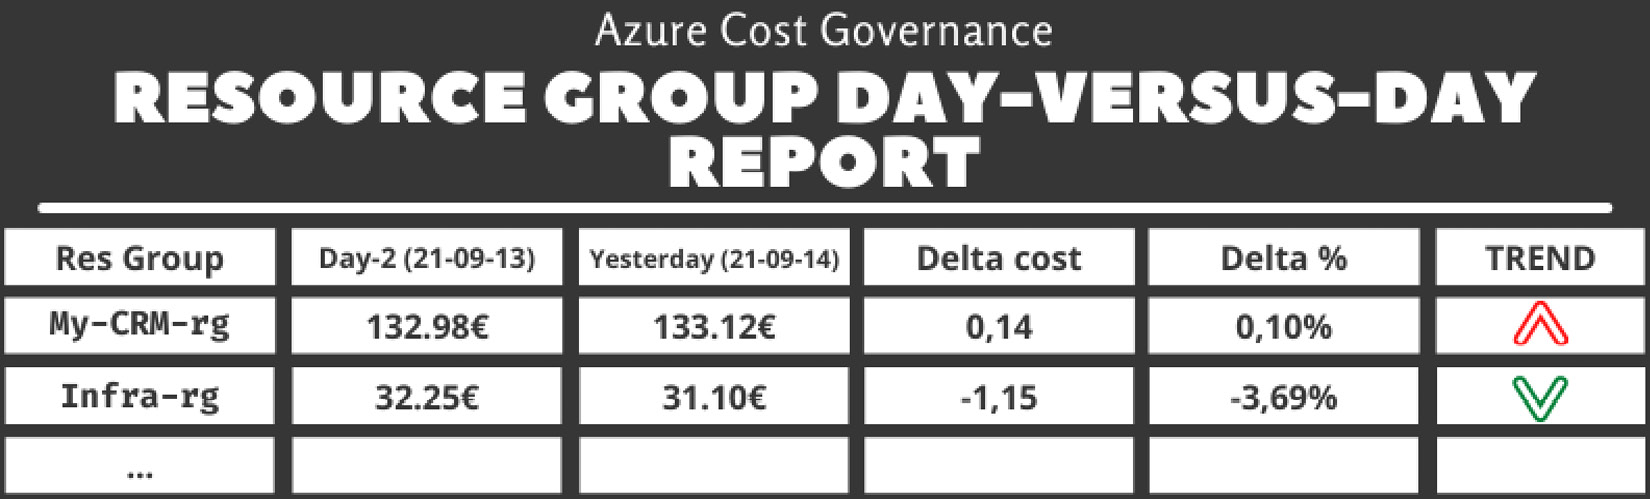
Table 5.3 – The resource group day-versus-day report
You can find the code for this report in the report_resourcegroup_day_day.php file on GitHub at https://github.com/PacktPublishing/The-Road-to-Azure-Cost-Governance/blob/main/Chapter%205/report_resourcegroup_day_day.php.
- Resource group current month-to-date versus (month-1)-to-date: This report compares costs split by resource group based on month-to-date (this month) versus the month-to-date (previous month) costs:
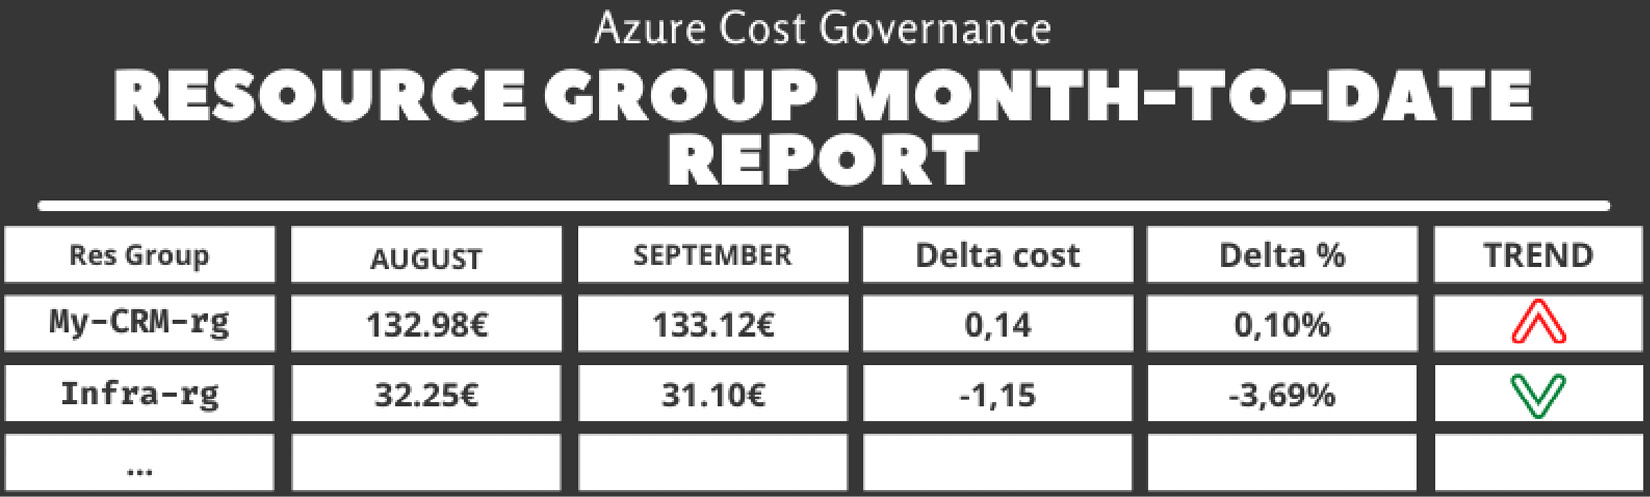
Table 5.4 – The resource group month-to-date report
You can find the code for this report in the report_resourcegroup_month_to_date.php file on GitHub at https://github.com/PacktPublishing/The-Road-to-Azure-Cost-Governance/blob/main/Chapter%205/report_resourcegroup_month_to_date.php.
- Per application day-versus-day: This report compares costs split by application (using the application ID tag) of day-1 (yesterday) to day-2 and highlights every spike after a certain percentage threshold:
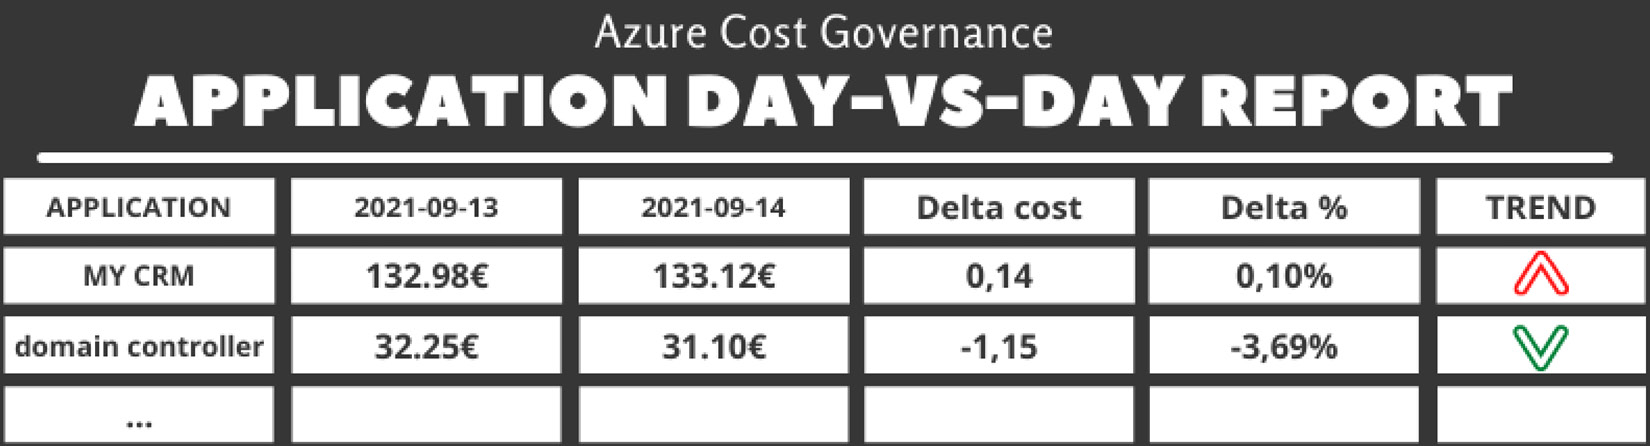
Table 5.5 – The application day-versus-day report
You can find the code for this report in the report_businessapp_day_day.php file on GitHub at https://github.com/PacktPublishing/The-Road-to-Azure-Cost-Governance/blob/main/Chapter%205/report_businessapp_day_day.php.
- Per application current month-to-date versus (month-1)-to-date: This report compares costs split by application (using the application ID tag) based on month-to-date (this month) versus the month-to-date (previous month) costs:
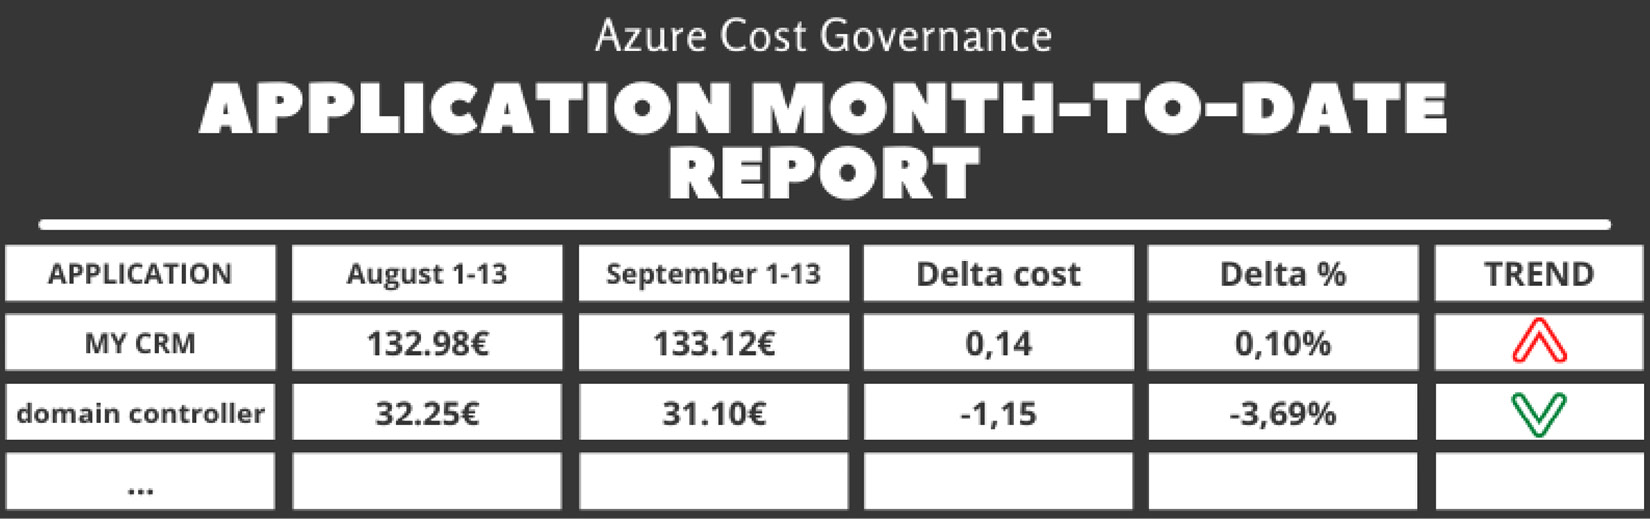
Table 5.6 – The application month-to-date report
You can find the code for this report in the report_businessapp_month_to_date.php file on GitHub at https://github.com/PacktPublishing/The-Road-to-Azure-Cost-Governance/blob/main/Chapter%205/report_businessapp_month_to_date.php.
If you were able to deploy the script in Chapter 3, Monitoring Costs, in the Thinking about an architecture for a custom cost management tool section, then you will be able to follow up by adding these reports. You can find them here: https://github.com/PacktPublishing/The-Road-to-Azure-Cost-Governance/tree/main/Chapter%205.
In this section, we learned how to identify cost spikes by comparing cost reports. This practice should be included in a healthy recurrent cost governance process and be performed at least once per quarter. But what about identifying hidden costs among shared resources? We will cover this in the next section.
Shared resources
In the previous sections, we learned that the granularity of the representation mostly depends on the tagging completeness: without proper tagging or a fully populated CMDB, it's impossible to determine the costs of every application.
This was a necessary approximation to introduce some major concepts about cost control and its various representations.
The more you understand how to identify hidden costs and spikes, represent them, and keep them under control, the more you start to realize that they are mostly related to infrastructure design and operations (for example, upgrade projects, architectural patterns, and so on).
So, you are probably starting to identify resources that generate costs but cannot be easily mapped or tagged because they simply depend on other resources being assigned.
Here are a couple of examples:
- VNets: You're not charged for the inter-VNet traffic, but you're charged for peering (between-VNet) traffic, so having two high traffic resources on different VNets may generate extra costs. However, the problem may be limited to a single application, not all the applications on the VNets.
- Network appliances (load balancers, application gateways, firewalls, and more): You're charged by different metrics (traffic, balancing rules, and so on), and usually, these resources are shared between different applications.
Let's analyze this simple infrastructure setup: two applications behind two different load balancers. The following diagram illustrates this setup:
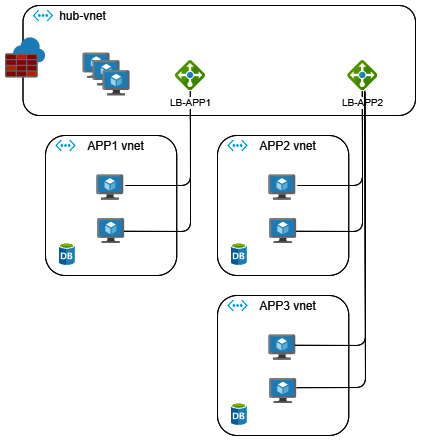
Figure 5.8 – The shared cost of network infrastructure
Here, we can see that the following:
- The application's dedicated VNets are used by the attached resources (VMs and DB).
- The load balancers (LB-APP1 and LB-APP2) may be shared (or not).
- hub-vnet is shared between the three applications and the other services.
Fortunately, Azure allows you to get VNet-attached resources easily by API or the command line, so you can dynamically tag shared resources to split costs automatically.
Here is an example:
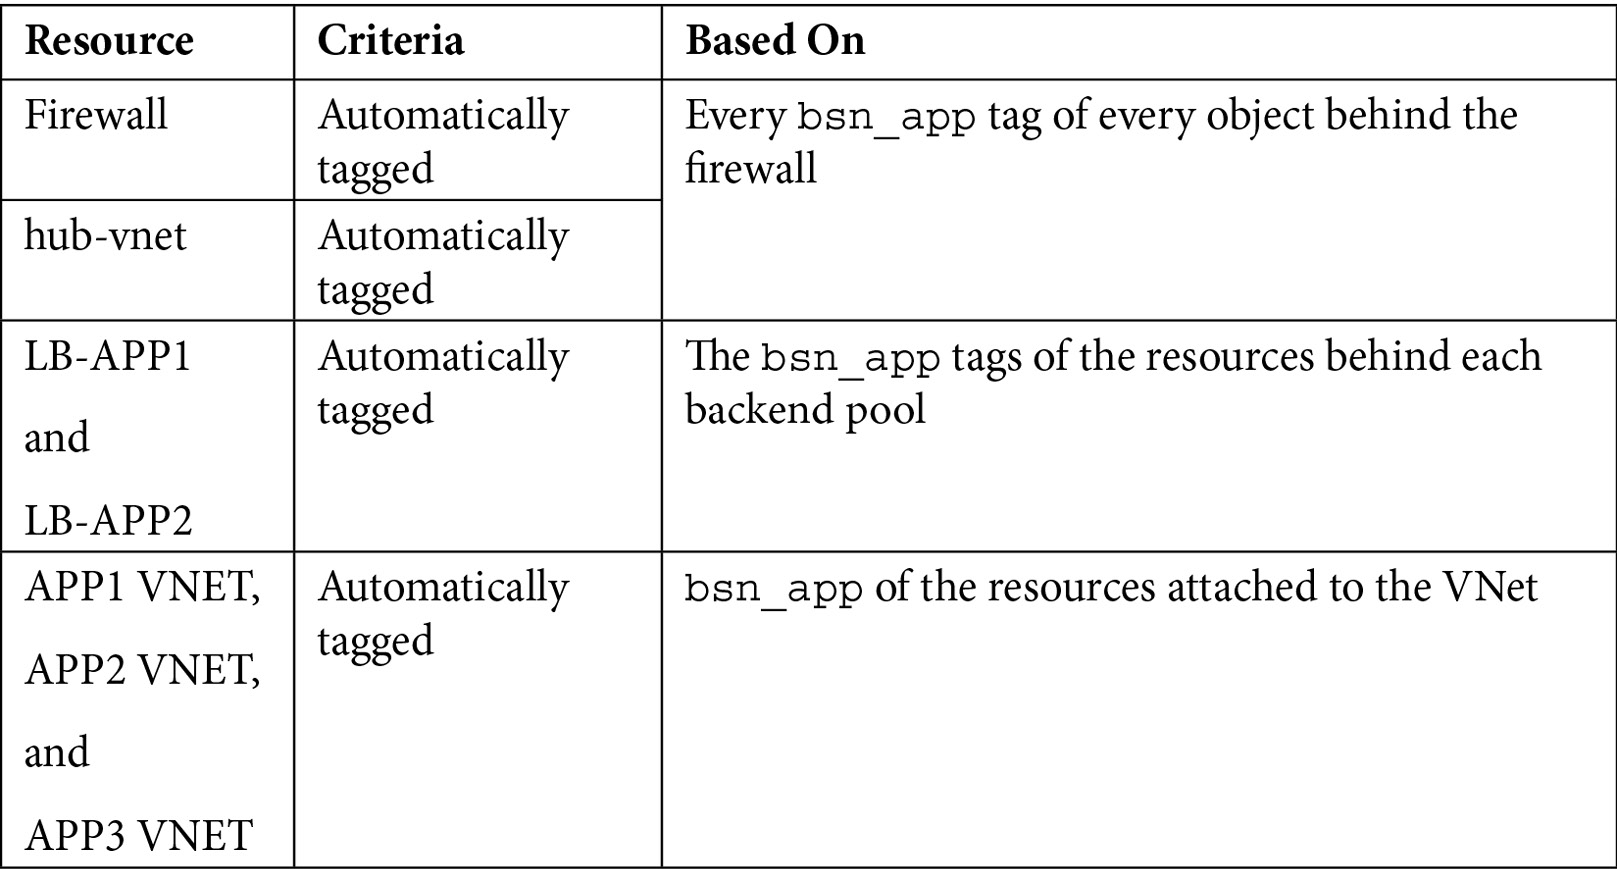
Table 5.7 – Automatic bsn_app assignation criteria for shared resources
This way, you can start identifying and splitting the cost of shared resources by application. You will also be able to understand – in case one of these costs should unexpectedly spike – if there is an application issue that is consuming more than what they are normally entitled to.
If things are getting complicated, it might be wiser to identify a different way of assigning shared resources – one, for example, that is internal to the resource, as we'll see in the next section.
Primus inter pares – finding the cost leading resource
The more you dive into analyzing shared costs, the more you start thinking that the cost of a shared resource could not be a simple mathematical average.
Let's think about the previous network example: if APP2 makes 1 Gb/s of traffic and APP3 only generates 1 Mb/s, it appears unfair to split the cost of LB-APP2 50/50. So, you need to define a way, or a driver, to realistically split the costs of shared services.
The following example shows how to split the costs of shared components based on an external driver (for example, the traffic on the load balancer to split peering costs) concerning the VNet cost components.
One good starting point is considering the network peering traffic, billed separately, as displayed in the following diagram, where peering connectivity is tied to each application VNet:

Figure 5.9 – Network peering traffic for the hub and spoke topology
By using the .csv invoice or the Cost Management tool, you can identify the peering traffic component of each VNet, which allows you to build the driver. As shown in the following screenshot, you can filter by Service name and set the Group by option to Meter subcategory to obtain the networking resources split:

Figure 5.10 – Costs of peering connections
Let's consider the following costs for building up the driver:
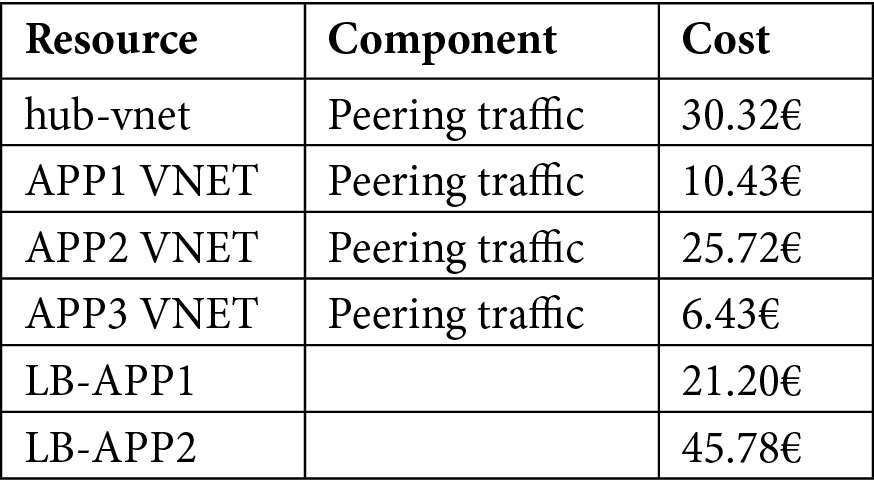
Table 5.8 – Sample costs for network resources
LB-APP1 only serves the APP1 VNet so 100% of the load balancer costs should be assigned to APP1. LB-APP2 serves the APP2 and APP3 VNets, so we need to get the split percentage:
- The formula for obtaining the APP2 percentage on LB-APP2 is as follows:


Now, we can split the LB-APP2 costs:
- APP2 costs of LB-APP2: 36.62€
- APP3 costs of LB-APP2: 9.15€
Another way to split costs is to use an internal driver: using a specific metric within the same resource.
Let's consider a database server VM that serves three databases and has the following cost components:
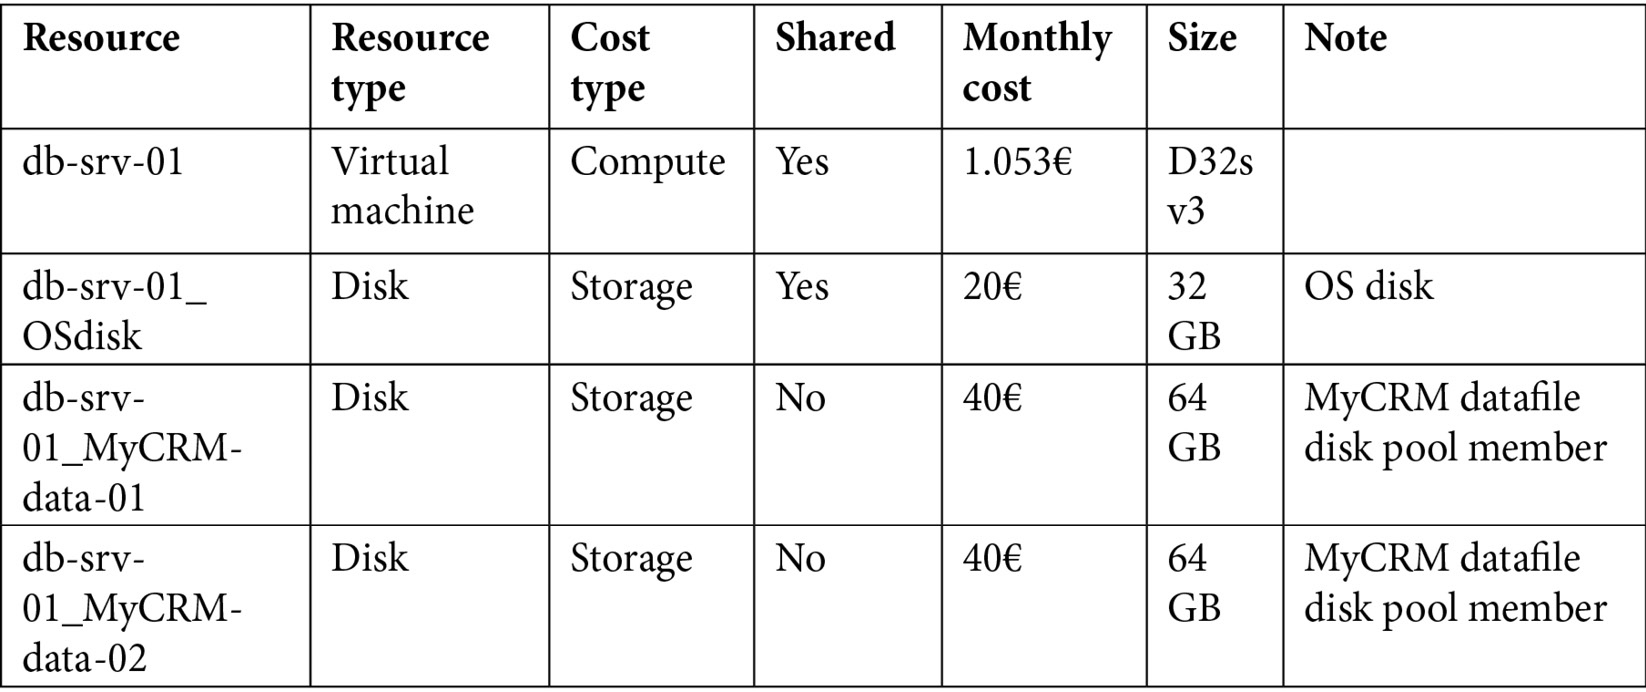

Tablet 5.9 – Sample costs for databases and VMs
The total monthly cost of the VM (and its disks) is 1.285€, but 1.084€ is the shared cost.
Unfortunately, we cannot assign 100% of the costs to each of the related applications, but we need to split the costs based on an intelligent, adaptive driver to ensure that, once defined, it will be always correct.
One easy way to split storage-bound costs is to calculate the assignment percentage based on the disk allocation. In this example, we will have the following:
- The formula for obtaining the MyCRM percentage is as follows:

- The formula for obtaining the AssetMgmt percentage is as follows:

- The formula for obtaining the Intranet percentage is as follows:

The calculated percentages are as follows:
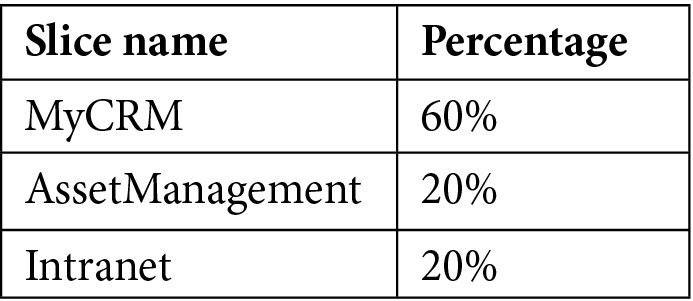
Table 5.10 – Percentage of used resources
Using the storage-based driver and considering the dedicated and shared costs, we can assign a reasonably split cost to each application, as shown in the following table:
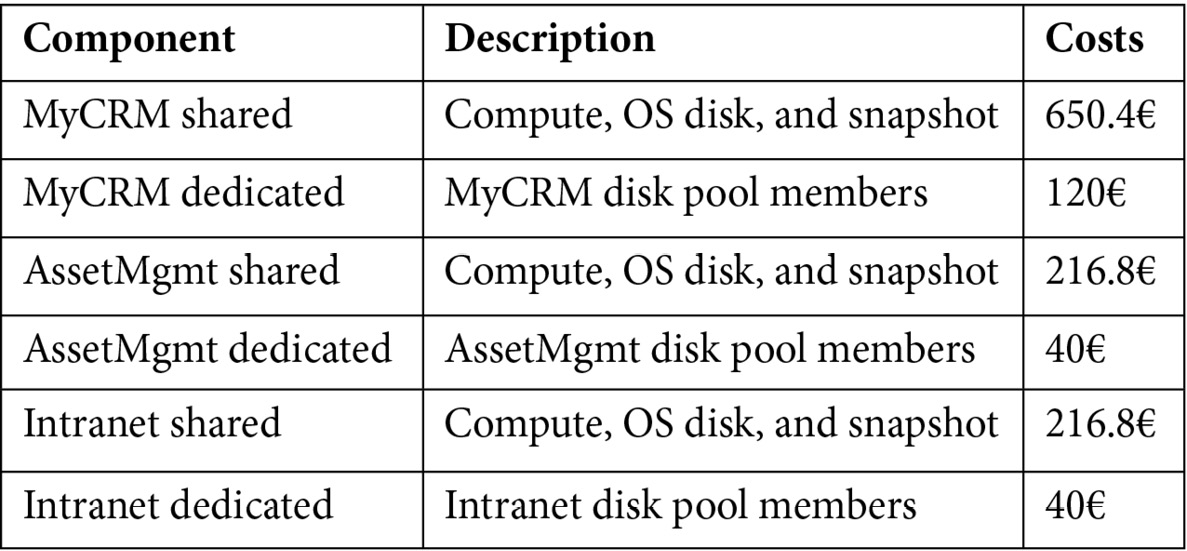
Table 5.11 – Application cost allocation
Important Note:
In this example, we used a simplified setup. With a shared disk pool, you may need to switch from disk cost to database size. If you're splitting a CPU-bound cost (for example, an HPC), you may need to use the running time of the jobs, or the per-minute CPU consumption % of each job, and so on.
Cleaning up with PaaS services
In any real environment, you'll have to face the challenge of splitting costs for all PaaS, SaaS, and IaaS resources, and usually, a successful approach is to identify an intelligent driver to split the cost in terms of a percentage.
It may seem difficult to find a real driver for the PaaS services, but please keep in mind that you can always focus on the main cost-impacting variable for each service and try to extract usage values or allocation values for that metric, and then apply the ratio to the whole PaaS service spending.
In the previous example, we had disk pools for an IaaS database, and we built up a storage-based splitting algorithm. In the following example, we will learn how to split the costs of Cosmos DB.
Cosmos DB's costs are mainly related to the Request Units (RUs) that are allocated for each collection, as shown in the following screenshot (for more information about RUs, please refer to the official documentation at https://docs.microsoft.com/en-us/azure/cosmos-db/request-units). So, we need to build up a compute-based splitting algorithm. Let's hypothesize a Cosmos DB database with monthly spending of about €33,518.61, as shown in the following screenshot:
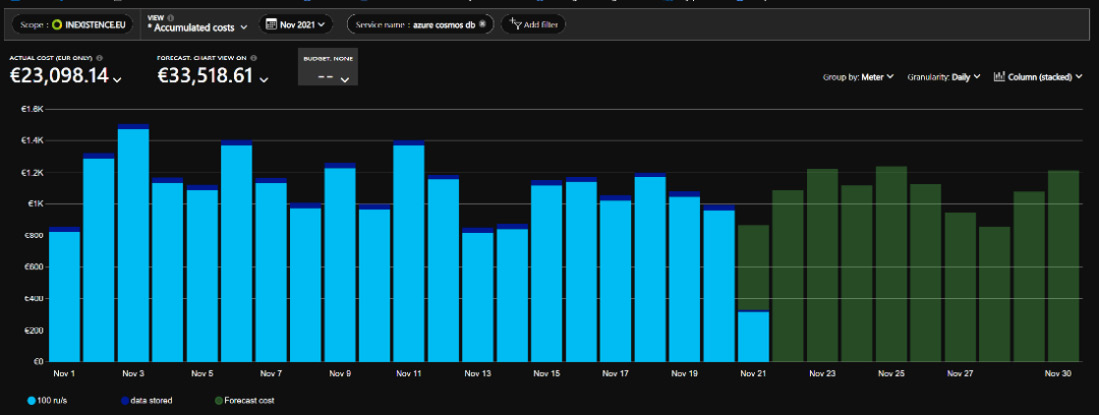
Figure 5.11 – Cosmos DB spending grouped by meter
Here, we have three collections, where each one has a manual RU assignation, as shown in the following table:
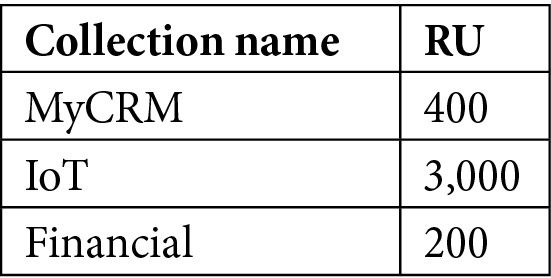
Table 5.12 – Percentage of used resources
So, we can calculate the impacting percentage of each collection for the entire spending process:
- The formula for obtaining the MyCRM collection percentage is as follows:

- The formula for obtaining the IoT collection percentage is as follows:

- The formula for obtaining the Financial collection percentage is as follows:

The calculated percentages are as follows:
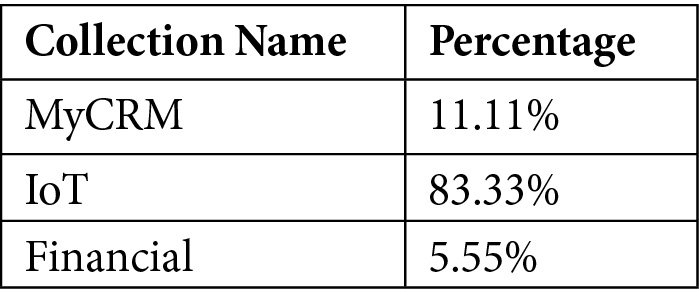
Table 5.13 – Percentage of used resources
Now, we can easily split the cost based on a rational driver of the total Cosmos DB instance spending:
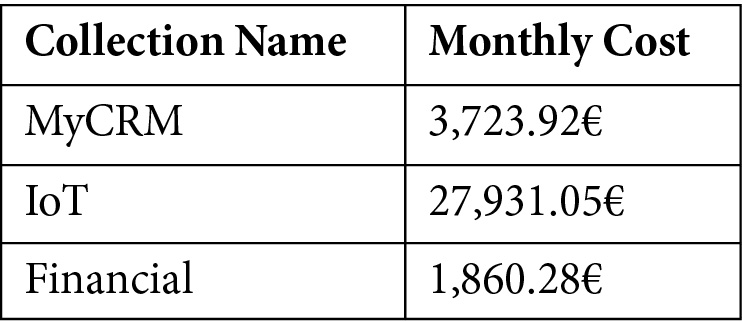
Table 5.14 – Final application cost allocation
We have just learned that we cannot consider a 1:1 resource-business application ratio, especially on network, compute, and shared DB or PaaS components that could represent an important slice of your monthly bill. In the next section, we will learn that unused resources also have strong security implications as they typically represent the easy and simple target for attacks.
Security implications of cleaning up
Other than simply wasting money and resources (and carbon emission, but this is something we'll address in Chapter 8, Sustainable Applications and Architectural Patterns), when you leave resources in a public cloud, you are putting the following at risk:
- Your virtual data center (depending on your network configuration)
- Other customers' virtual resources and data centers
- The cloud service provider's infrastructure
This goes without saying, but you need to switch off and delete unused resources, even if there is no associated cost. The best approach would be to enforce a culture of responsibility where every owner of one or more cloud resources is also responsible for deleting them.
The problem is, of course, that creation is easier than deletion for several reasons, including the fact that there are many silent services associated with a simple workload such as, for example, a VM (we saw this in the previous paragraphs, where creating a VM will attach several other services to it, from networking to storage, and so on). In addition, trying to control all of this without proper tagging and policy enforcement might feel like an impossible mission. Someone once mentioned that the only way of knowing what's going on in your cloud is by looking at the bill, and I think at this point of this book, we agree with this view.
Large enterprises have many reasons to spin up resources that are not typical IT business resources: they run POCs or design marketing campaigns or prototypes, sometimes leaving behind all the resources without proper tagging and, alas, deletion.
If this is bad at a cost management level, we must also address the elephant in the room, which is the fact that unutilized resources are the perfect targets for hackers and exploiters, so they represent the most dangerous point of entry of any organization. And if you feel that controlling your registered, accounted, and managed cloud infrastructure is an impossible task, how about stuff you don't even know exists? These cannot be added to your security tools and systems, so they are not scanned for vulnerabilities, patched for the latest updates, or validated against your company's policies.
So, other than simply saving money, cleaning up is vital to your organization's security posture and the recommendation of using a zero-trust approach also stands for orphaned resources: assume you have them in your virtual data center. Then, you can act accordingly by running audits and checking reports, and ultimately enforce a cost governance routine that will periodically take care of their deletion.
We hope that we have convinced you to get rid of all the unnecessary resources and money-spending stuff that was left in your virtual data center. However, there's one last thing you must do before considering your cost governance as clean, and that is handling all the unused subscriptions, as we'll see in the next section.
Unused subscriptions
In my experience, large enterprises that use the cloud for a few years typically end up with lots of subscriptions that were created for many reasons besides the official hierarchy that we suggested in Chapter 1, Understanding Cloud Bills: subscriptions coming from user tests, free credit subscriptions received during marketing events, prototypes, POCs, tests, and so on.
Don't get me started on how many subscriptions or Microsoft Azure Enterprise subscriptions (this is the standard default name when a subscription is created in an enterprise agreement) I have been able to find on any named enterprise customer. Keeping many unaccounted subscriptions does not necessarily bring extra costs (unless you forget resources that are still running in them), but most of these subscriptions will stay in your system with ghost resources for months and years without bringing any value to your data center.
Important Note:
To be able to rationalize your subscriptions, you will need to have AD administrator privileges and/or be able to access the Enterprise Administrator (EA) Portal (for enterprise agreements). Unfortunately, if you have subscriptions that were left from departed employees or collaborators and you cannot access them, the only way to get rid of those subscriptions will be to open a service request to Microsoft.
As explained in Chapter 2, What Does Your Cloud Spending Look Like?, when addressing the subscription hierarchy, there are several tools to help you handle and manage subscriptions, such as Management groups:
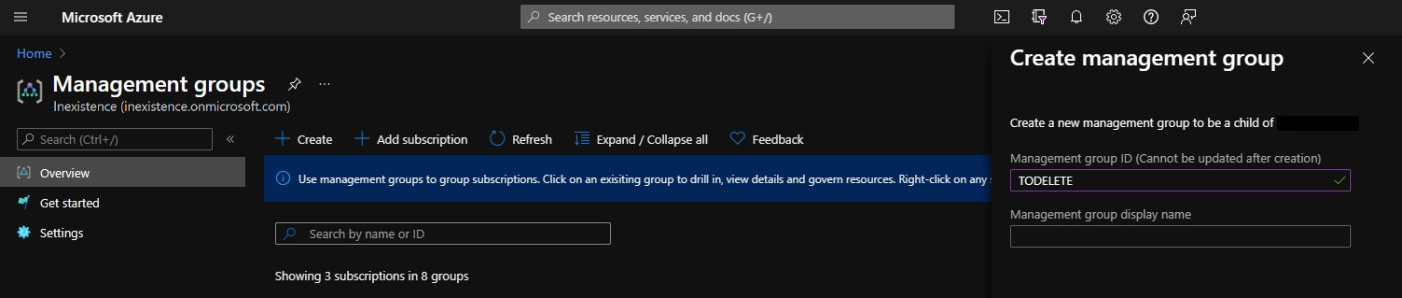
Figure 5.12 – Creating a management group to quarantine subscriptions
Once you have EA/AD admin privileges, you should be able to move the unused subscription to a specific management group (that is, todelete). Then, you can apply all your security and cost control policies before quarantining and deleting the unused subscriptions. This can all be done through the Azure portal: https://docs.microsoft.com/en-us/azure/cost-management-billing/manage/cancel-azure-subscription.
From the moment you delete a subscription, its billing is immediately stopped, and all its services are disabled (IP addresses are freed, VMs are deallocated, and so on). The storage is rendered read-only and there is still a chance to undelete the subscription if you made a mistake, but only for a few days once the action has been performed.
Important Note:
Please note that because the subscription is also a billing container, even when empty, it will take 30 to 90 days to be effectively deleted from the systems. For billing purposes, it may stay longer in your Cost Analysis tool, depending on the scope you are selecting.
With that, we have learned how to identify and remove spikes, as well as unattached, ghost, and unused objects in a virtual data center. This may not just have cost-saving results but may also make your cloud data center more secure.
Summary
In this chapter, we looked at the rest of the cost-saving techniques that you can use to both lower and keep your Azure costs down – we learned how to deal with cloud resources with the correct mindset.
Then, we learned what resources and workloads can be cleaned up and how to save money, from shared resources to networking resources consumption, down to proliferating unused or forgotten subscriptions. With the knowledge you've gained in this chapter, we hope that you are aware of all the possible hidden resources and costs of a normal operational virtual data center.
The next chapter is dedicated to reservations since they represent the quickest cost-saving technique. Even though, in complex environments, reservations may seem elaborate and difficult to deal with, we have now tackled everything we needed to properly address them: from right-sizing our resources to cleaning up unused services. Hence, we are now ready to dive into reservations with the correct approach.
Questions
- How do you know if you have unattached disks in your environment?
- How can you calculate the peering traffic of an application that shares a VNet?
- How can you delete an unused subscription?
- How can you get the costs of resources involved in a software migration project?
- How can you split the costs of a shared resource?
Further reading
- Migration best practices for costs: https://docs.microsoft.com/en-us/azure/cloud-adoption-framework/migrate/azure-best-practices/migrate-best-practices-costs
- Unexpected charges: https://docs.microsoft.com/en-us/azure/cost-management-billing/understand/analyze-unexpected-charges