Overview
By the end of this chapter, you will be able to implement standard logging practices to display application data; create log files and use log levels to segregate and filter logs; perform basic debugging using byebug and Visual Studio Code and use breakpoints and expressions to debug code.
Introduction
In the previous chapter, we learned about extending the functionality of our application with gems, interacting with the filesystem with the File and IO classes, importing external data using CSV files, and how to wrap all this up in a nicely encapsulated service class.
Software bugs are a fact of life in software engineering. No matter your skill level, bugs always find a way to show up. We can, however, reduce the severity and volume of bugs by improving our knowledge of logging and debugging. A solid understanding of these topics will ensure that, when things go wrong, we're armed with the tools and required knowledge to solve the problem efficiently.
Understanding how and why issues occur is a critical part of software engineering. In this chapter, we're going to learn how to use a proper logging solution to gain visibility of our application's operation rather than just printing variables to the screen.
We'll also learn how to categorize and filter out logs using log levels, how to manage the size and retention periods of our log files to prevent our servers from running out of space, and how to customize the appearance of our logs with custom formatters.
We'll learn about some basic debugging tools and we'll also take a look at Terminal-based debugging with byebug, how to step through our code, and how to move through the call stack.
We'll then look at how this is done using a more visual approach, using Visual Studio Code, and how we can conditionally trigger debug breakpoints using expressions.
Logging and Debugging
Logging and debugging are critical aspects of developing and deploying applications in any language. A good log file provides insights into exactly what an application is doing and when.
This is an invaluable resource when things go wrong in a production environment as it enables our applications to be "observed," with the log acting like an activity trace.
For example, when a production application goes down at 3 A.M. and you are responsible for investigating, you will be very happy when you find a nice informative log file waiting for you, as this will be the first place you check.
Effective logging has layers that can be controlled, which allows us to control the verbosity of the log output in order to debug an issue. The perfect logging system provides enough information to be useful, but not so much that it becomes noisy and difficult to read. This is often a hard balance to strike, and this is where "log levels" come into play.
Debugging and logging live within the same realm. They are both diagnostic tools that we can use to observe the operation of our applications. Whereas logging exists at all stages of our application's life cycle, debugging tends to exist mainly in the development environment.
Debugging tools are a critical piece of the puzzle for any software engineer. Without them, we would waste hours and hours of time printing out the values of variables to the screen and manually tracing application behavior.
Thankfully, Ruby has a number of great debugging tools that are at our disposal. We'll cover a few of the most popular ways to perform debugging in this chapter. We'll cover both Terminal- and editor-based debugging so you are fully armed to debug any issues that come your way.
Logging with the logger Class
When you start building a new application, you might intuitively start writing puts statements throughout the code in order to expose information to the developer.
We encourage anyone to implement at least a very basic logging framework before you get too deep into a new project. It will save time and hassle later when you decide to implement a proper logging system, not to mention helping you to debug issues earlier.
Most languages either come with standard logging functionality built into the core libraries or have established logging libraries available to be included in the programs.
Python has the logging module built into the core language, Java has the excellent log4j framework, and Node.js has Winston and a number of other packages available for download.
Ruby comes with a very useful logger class right out of the box, which makes this job easy.
The Ruby logger is a simple but powerful logging utility that solves multiple common logging problems for you, such as the following:
- Log rotation: Rotating or cycling logs is how we prevent our application from creating a huge log file that can't be opened. Log rotation also helps us ensure that logs are sectioned into usable and archivable chunks, rather than one long cumbersome stream of content.
- Log file size management: Closely related to log rotation, a good logging solution will also help you manage the size of files. This not only assists us with processing files but helps us to ensure we don't crash a server by filling up its disk space.
- Logging levels (filtering, development, and production log verbosity): In a real-world system, our log file is likely to be full of useful and useless information, depending on the situation and the level of detail you need. A good logging solution gives us control over how to restrict and filter log output.
- Customizable log formatting: How do we customize the log output format to be something more to our liking? The ability to make some basic adjustments to how a log is presented can make a big difference when you're reading through thousands of lines of output.
These are common problems for all languages and stacks. Some languages and frameworks will go about solving them in different ways, but any comprehensive solution should at least solve these fundamental problems.
Let's begin with some basic logging fundamentals now.
Basic Logging
Every application log file should include, at a minimum, a few essential pieces of information. The most basic of logging requirements would include some form of category to filter on and a timestamp. Ruby makes this easy for us and gives us a whole lot more.
With just a few simple lines of code, you can implement fully featured standardized logging across your entire application.
Let's look at a basic example:
require 'logger'
logger = Logger.new(STDOUT)
logger.debug("User 23643 logged in")
Here, we can see the logger class being "required" like any other gem, after which we instantiate the class, as the logger variable, passing STDOUT as the first parameter (more on this soon), and finally, we call logger.debug with our message.
When we run this script, we will see the following output:

Figure 8.1: Standard log format
What we're seeing here is the standard log format. This contains:
- The severity ID
- The timestamp of the event
- The Process ID (PID) of the process
- The severity label
- The program's name (nil by default)
- The log message
We get all this information included with every log line, which helps us understand the context of the message.
Note
If you don't like the content or the format of the log output, don't worry – we'll be covering custom formatting options later in the chapter.
Log Levels
A good logging strategy allows for fine-grained control over what goes into our log files and how to filter them. It might feel like searching for a needle in a haystack if you simply dump everything into the log output without any consideration for the severity of the content.
Consider the following example:
socket opened - socks 5
closing connection 43463
updated record 45587
updated record 86584
closing connection 56887
updated record 26577
socket opened - socks 5
updated record 67966
closing connection 12433
updated record 67969
closing connection 56887
updated record 26577
updated record 67966
socket unavailable - socks 5
closing connection 12433
socket opened - socks 5
updated record 67969
closing connection 56887
updated record 26577
socket opened - socks 5
updated record 67966
You might wonder what would make this log file easier to read and how we could filter out the informative logs from the error messages.
In this case, there are only 21 lines, but it's still quite hard to spot the error:
socket unavailable - socks 5
When a log file could be hundreds or even thousands of lines long, you can imagine that it would be incredibly hard to find this line; however, it is the one line in this example that is unique and reporting an error, which makes it an important debugging resource.
So, what would make this better?
For starters, there's no timestamp, so we really have no idea when this error occurred. If we were trying to correlate this error with an error which we detected either upstream or from a client, then this would make it near impossible to line up the timelines.
Next, we have no distinction between what's purely informational and what is reporting critical errors. It's all kind of mixed into one big stream, leaving us with a huge mess we have to dig through manually, reading line by line. We need a mechanism to filter these results or, even better, the ability to enable or disable less relevant logs.
Let's look at this same log file again. This time, as if it had been handled by the logger class:
I, [2019-07-24T16:15:17 #47525] INFO -- : socket opened - socks 5
I, [2019-07-24T16:15:17 #47525] INFO -- : closing connection 43463
I, [2019-07-24T16:15:19 #47525] INFO -- : updated record 45587
I, [2019-07-24T16:16:22 #47525] INFO -- : updated record 86584
I, [2019-07-24T16:16:23 #47525] INFO -- : closing connection 56887
I, [2019-07-24T16:16:22 #47525] INFO -- : updated record 26577
I, [2019-07-24T16:16:23 #47525] INFO -- : socket opened - socks 5
I, [2019-07-24T16:16:24 #47525] INFO -- : updated record 67966
I, [2019-07-24T16:17:24 #47525] INFO -- : closing connection 12433
I, [2019-07-24T16:27:25 #47525] INFO -- : updated record 67969
I, [2019-07-24T16:17:26 #47525] INFO -- : closing connection 56887
I, [2019-07-24T16:18:26 #47525] INFO -- : updated record 26577
I, [2019-07-24T16:18:27 #47525] INFO -- : updated record 67966
E, [2019-07-24T16:19:27 #47525] ERROR -- : socket unavailable - socks 5
I, [2019-07-24T16:20:27 #47525] INFO -- : closing connection 12433
I, [2019-07-24T16:21:28 #47525] INFO -- : socket opened - socks 5
I, [2019-07-24T16:21:29 #47525] INFO -- : updated record 67969
I, [2019-07-24T16:22:30 #47525] INFO -- : closing connection 56887
I, [2019-07-24T16:23:31 #47525] INFO -- : updated record 26577
I, [2019-07-24T16:24:31 #47525] INFO -- : socket opened - socks 5
I, [2019-07-24T16:26:32 #47525] INFO -- : updated record 67966
That's much easier to read.
Even better, we can use basic shell commands to filter out all the junk and simply show us the errors we're looking for:
cat log.txt | grep ERROR
E, [2019-07-24T16:26:16.216648 #47525] ERROR -- : socket unavailable - socks 5
We could have thousands of lines in the log file but now we can see those that matter the most in an instant.
So, how is it that we're able to mark these lines as ERROR and the others as INFO? These are what are referred to as log levels, and when using the logger class they are available to us by using the Logger instance methods that log specific severity levels. These levels are:
- DEBUG
- INFO
- WARN
- ERROR
- FATAL
As you may have guessed, these have specific purposes that indicate the severity of the log message. Consider the following example:
require 'logger'
logger = Logger.new(STDOUT)
logger.debug("debug")
logger.info("info")
logger.warn("warn")
logger.error("error")
logger.fatal("fatal")
The preceding code will output the following log lines:
D, [2019-07-29T21:19:54.689147 #71263] DEBUG -- : debug
I, [2019-07-29T21:19:54.689246 #71263] INFO -- : info
W, [2019-07-29T21:19:54.689261 #71263] WARN -- : warn
E, [2019-07-29T21:19:54.689271 #71263] ERROR -- : error
F, [2019-07-29T21:19:54.689292 #71263] FATAL -- : fatal
As you can see, simply calling the relevant method will output the log line tagged with the particular log level.
Let's study each log level in detail:
- DEBUG: This is used for debugging and is generally disabled in production. It is generally used either during the development stages or turned on in order to gather as much information as possible. Typically, this is the information we don't want to log once an application is stable.
- INFO: This is used for general messages and often for diagnostic or tracking purposes. It is generally a good choice for regular production logs as we exclude DEBUG messages but see everything else.
Used for standard informational log messages, it may include general information such as diagnostics, process information, job statistics, user authentications, general request information, and so on.
- WARN: This is generally used for warning, but not necessarily error messages; for example, retry attempt #2 or Slow query detected.
If you have particularly noisy logs (say, thousands of lines per minute), this might be a better choice for production systems as the logs will contain only important information. You can always drop back to INFO if you need more details to debug an issue.
- ERROR: This is used for error messages and exceptions. For example, when capturing an exception, in the rescue block, you would perform a logger error. Another example is when making API calls to an external service; if you receive a non-HTTP 200 response, you may wish to log that as an error.
- FATAL: This is used for critical application failures. Log what information you can before the application terminates.
This is less commonly used in long-running processes such as web servers, but in the case of a console application or a standalone script, you would typically log a FATAL error message when encountering a non-recoverable error, just before terminating the program.
Let's look at some more examples of how to use the log levels:
require 'logger'
logger = Logger.new(STDOUT)
logger.info("Starting Application")
begin
0 / 0
rescue StandardError => e
logger.error(e.message)
end
Here's a basic example of handling errors with the correct log level. In this example, we've manually caused an exception by dividing 0 by 0. If we run this code, we'll see the following:
I, [2019-07-29T22:01:09.029434 #72692] INFO -- : Starting Application
E, [2019-07-29T22:01:09.029512 #72692] ERROR -- : divided by 0
Let's now solve an exercise with a more interesting scenario.
Exercise 8.01: Logging User Information
A web application allows only three users to be logged in at a time. In this exercise, we'll build a logging system that will display a warning log when more than three users are logged in to the application. The following steps will help you with the solution:
- Import the logger class by using the require method:
require 'logger'
- Define the logger variables with the STDOUT parameter and display the messages:
logger = Logger.new(STDOUT)
logger.info("Starting Application")
- Define the users in an array:
users = ["Matt", "Pete", "Brenton", "Geoff"]
- Next, we need to state the conditions for the warning log to display the names of the users if more than three users are logged in:
if users.length > 3
logger.warn("Warning, there are #{users.length} users")
end
users.each do |user|
logger.debug("User: #{user}")
end
- Close the log by using a display message:
logger.info("Finishing Application")
Thus, we have used the DEBUG, INFO, and WARN log levels.
The output log should look as follows:

Figure 8.2: Log output
At this point, you might be thinking that the DEBUG lines aren't so useful and that you would like them to not appear in your logs as it's making them appear too noisy. You could go and remove every instance where you've called logger.debug but that would be a pain, and it's possible you might need them again in the near future.
To filter them out, simply add the following line:
logger.level = Logger::INFO
This statement indicates that we are to display logs that are at the INFO level and higher.
If you remember, the log levels listed before those levels are actually in that particular order for a reason:

Figure 8.3: Order of log levels
When we declare the log level as INFO, we are saying that we only want to see logs from the INFO level and above; that is, INFO, WARN, ERROR, and FATAL, but not DEBUG.
If we set the logger level as follows, then, we'll only see the ERROR and FATAL logs:
logger.level = Logger::ERROR
So, in the preceding example, which lists out our names, we could change the log level to INFO, as shown in the following example:
require 'logger'
logger = Logger.new(STDOUT)
logger.level = Logger::INFO
logger.info("Starting Application")
users = ["Matt", "Pete", "Brenton", "Geoff"]
...
Then, if we run that same code again, we'll see the following:
I, [2019-07-29T22:18:07.640570 #72877] INFO -- : Starting Application
W, [2019-07-29T22:18:07.640647 #72877] WARN -- : Warning, there are 4 users
I, [2019-07-29T22:18:07.640664 #72877] INFO -- : Finishing Application
We've successfully filtered out all the DEBUG log messages with one line of code, and we can just as easily bring the filtered logs back when we need them.
Alternatively, if we want to shorten this code, we can also specify the log level within the call to the initializer, as follows:
logger = Logger.new(STDOUT, level: Logger::ERROR)
Let's try creating a basic exception logger for ourselves now.
Exercise 8.02: Creating a Basic Exception Logger
In this exercise, we will use the zero-division example from Chapter 7, Ruby Gems to demonstrate the usage of log levels:
- Import the logger class by using the require method:
require 'logger'
- Define the logger variables with the STDOUT parameter and display the messages:
logger = Logger.new(STDOUT)
logger.info("Starting Application")
- Now, we'll introduce a zero-division error and log the corresponding error message:
begin
0 / 0
rescue StandardError => e
logger.error(e.message)
end
We should now see the following output, demonstrating an exception being reported at the error log level:

Figure 8.4: Error log level output
This is how we can build logging systems, depending on the required log levels.
Setting Log Levels by String
You may wish to configure the log level for your application with an environment variable named LOG_LEVEL or some sort of configuration file when an application starts. In which case, setting the logger.level using the Logger::Info constant is a bit tricky. Thankfully, the logger class allows us to use a string instead of a constant if we want, so we can configure the log level from an external config input, such as environment variables or a config file. For example, we can do the following:
logger = Logger.new(STDOUT, level: "error")
Or, we could store this string in an environment variable named LOG_LEVEL:
logger = Logger.new(STDOUT, level: ENV["LOG_LEVEL"])
In this example, the LOG_LEVEL environment variable would simply contain a string, such as error.
Log Output
Up until now, we've been printing log lines to the console or, more specifically, to what's called standard output.
The Ruby logger class supports three main output destinations:
- STDOUT (standard output)
- STDERR (standard error)
- File (write to a file)
STDOUT
If you remember, we have been instantiating our logger instance with the following:
logger = Logger.new(STDOUT)
That STDOUT parameter passed into the initializer is a Ruby predefined global constant that represents the standard output.
Note
You can see global constants defined in the Ruby docs, here:
As you might infer from the name, standard output is where standard text is sent when you print the text to the console.
Consider the following example:
puts "some text"
This will simply write some text to the standard output, which will appear normally on your Terminal screen.
Another example is the simple echo command in your Terminal. Calling echo test from your command line will simply write text to the standard output, which appears on your screen like any other output.
STDERR
Living side by side with STDOUT is STDERR, which represents the Standard Error output. As you may have guessed, this works much like STDOUT, except that STDERR is where you send error output. It provides a way for a program to split regular informational output from error output.
STDOUT and STDERR, or the standard output and the standard error output, are what are known as standard streams.
Standard streams are a mechanism in computer programming that connects standard input and output channels for a program on an operating system level for the purpose of exporting information from a program or accepting input. There are three main input and output channels, known as standard input (stdin), standard output (stdout), and standard error (stderr).
We don't need to go too deeply into this subject; how these channels work is outside of the scope of this book, although they are common across all languages and operating systems. For now, we just simply want to understand what they are and when to use them.
Note
Streams can be split into separate log files so that STDERR logs appear in an error_log file and STDOUT appears in a log file. This can help get to the root cause of a problem quickly without the need to filter large log files
File
The third output destination is File. As you may expect, this is the one we use when we wish to write our log output to a file on the filesystem.
Writing logs to a file is simple using the logger class:
require 'logger'
logger = Logger.new("log.txt")
logger.debug("User 23643 logged in")
Running this script will result in no output to the screen; instead, it will create a new file, log.txt, if it doesn't already exist, and write the log line to it:
# Logfile created on 2019-07-31 15:32:53 +1000 by logger.rb/61378
D, [2019-07-31T15:32:53.016056 #94993] DEBUG -- : User 23643 logged in
You'll also notice that we get a nice little comment line up top there that details the date and time the file was created.
So, what happens when we rerun that same script a few more times? Let's take a look:
# Logfile created on 2019-07-31 15:32:53 +1000 by logger.rb/61378
D, [2019-07-31T15:32:53.016056 #94993] DEBUG -- : User 23643 logged in
D, [2019-07-31T15:33:07.560270 #95059] DEBUG -- : User 23643 logged in
D, [2019-07-31T15:33:09.810580 #95096] DEBUG -- : User 23643 logged in
As you can see, it will simply reopen the same file and append lines to it rather than creating a new blank file, which is obviously handy if we don't want to reset our log file every time our application restarts.
Log Formatting
Wouldn't it be nice if we could change the way the logs looked? Maybe we don't want all that information or maybe we just find that line hard to read. Thankfully, the Logger class has got us covered here again, by allowing us to configure the format of the log output in a few different ways.
Custom Date Formats
The 2019-07-31T15:33:09.810580 date format can be quite confusing to read. This is a commonly understood date format called ISO-8601, which is great for parsing in code, but what about if we just want something more human-readable?
Note
Before implementing a custom date format on your application, always be sure there are no other applications or processes that ingest or process those logs; otherwise, this is likely to result in broken integrations and reports or drastically incorrect times being reported to dependent services.
As an example, let's say we only want the time, in a shorter and cleaner 12-hour format, without the date on the timestamp.
Here is how we can do that:
require 'logger'
logger = Logger.new(STDOUT)
logger.datetime_format = "%I:%M:%S%P "
logger.debug("User 23643 logged in")
Running this script will output the following:
D, [08:43:01pm #78283] DEBUG -- : User 23643 logged in
Here is the logger.datatime_format line:
logger.datetime_format = "%I:%M:%S%P "
Each of the % (letter) portions of the string represents a component of the date that we wish to render into a date string. In this case, they are:
- %I = Hour of the day, 12-hour clock, zero-padded (01..12)
- %M = Minute of the hour (00..59)
- %S = Second of the minute (00..59)
- %P = Meridian indicator, lowercase (a.m. or p.m.)
Everything else, such as the : and the space are plain string characters.
What about if we wanted the whole date and time but in a much more human-readable format? Consider the following:
require 'logger'
logger = Logger.new(STDOUT)
logger.datetime_format = "%h %d %Y - %I:%M:%S%P "
logger.debug("User 23643 logged in")
This would give us the following:
D, [Jul 31 2019 - 08:58:06pm #78856] DEBUG -- : User 23643 logged in
Now that's a very readable timestamp.
This could potentially cause problems with your application considering time zone differences, external systems that ingest the log files, international users, and so on.
Note
There is a large selection of formatting options you can choose from to suit your needs.
You can visit https://packt.live/2nNPx0G for more information.
Dealing with time can be tricky when it comes to the matter of time zones. If your server is set to the UTC time zone, then these times may not appear as you expect. Be sure to check what time zone your server uses so there's no confusion. The logger class will use whatever time zone your server is set to by default.
Custom String Formats
Changing the date is handy, but what about if you want to change the whole line? Maybe we want a simpler format that's easier to parse. Well, the logger class has got you covered again.
We can do this by using Logger formatters:
require 'logger'
logger = Logger.new(STDOUT)
logger.formatter = proc do |severity, datetime, progname, msg|
"#{severity} | #{datetime} | #{msg} "
end
logger.debug("User 23643 logged in")
This outputs a log line that looks like this:
DEBUG | 2019-07-31 21:10:54 +1000 | User 23643 logged in
Better yet, when we use the log file, the content will line up nicely, like this:
DEBUG | 2019-07-31 21:10:54 +1000 | User 23643 logged in
DEBUG | 2019-07-31 21:10:55 +1000 | another log
DEBUG | 2019-07-31 21:10:55 +1000 | another log again
DEBUG | 2019-07-31 21:10:55 +1000 | and another one
Pretty clean, right? So, what's happening here. Let's take a look:
logger.formatter = proc do |severity, datetime, progname, msg|
"#{severity} | #{datetime} | #{msg} "
end
Here, we're providing a formatter in the form of proc. A proc object is essentially like an encapsulated function that has been scoped to a local set of variables. In this case, we have access to the severity, datetime, progname, and msg variables, which map to the components of the original timestamp we saw earlier.
We simply put them together to return a string of our own choosing; in this case:
"#{severity} | #{datetime} | #{msg} "
Now, anytime we call a logger print function, this proc object is executed and the string we choose is the output.
Time Zones and UTC
The current server time zone is used for the timestamp. Simply changing your server's time zone will update the timestamps with the relevant time zone offset; however, you may also wish to include a UTC timestamp. Typically, services that deal with international requirements or integrate with external systems represent time as UTC time as it is not localized and is not specific to any particular country.
We can include a UTC timestamp in the preceding example by simply changing the output line to also print a UTC-cast version of the timestamp, as follows:
require 'logger'
logger = Logger.new(STDOUT)
logger.formatter = proc do |severity, datetime, progname, msg|
"#{severity} | #{datetime.zone}: #{datetime} | UTC: #{datetime.utc} | #{msg} "
end
logger.debug("User 23643 logged in")
This will output the following:
DEBUG | AEST: 2019-08-14 09:56:58 +1000 | UTC: 2019-08-13 23:56:58 UTC | User 23643 logged in
Log File Management
Log files tend to be one of those things that grow out of control over time.
Our application continues running, doing its job day in and day out until one day it crashes.
You respond and immediately start debugging the issue until you quickly realize there's nothing wrong with the application; the server ran out of disk space – an 80 GB log file being the root cause of the problem.
You can avoid this issue by configuring log retention and rollover. This will ensure that you keep only the number of logs that you specify and you "roll over" what you don't need.
You can take two different strategies here in regard to file retention.
Size-Based Retention
If you have limited disk space to work with, you can specify the exact size of the log files and the number of them to keep before they are erased from disk.
For example, you could say "I want my logs files to be no larger than 100 MB each, and I'll keep up to 5 of them, for a total maximum of 500 MB of log files."
You may wish to have a separate process, such as a cron job or a Windows scheduled job to copy or back up your log files to a storage location, such as Amazon S3 or another attached volume for historical records. Once the Logger class has reached the file retention limit, the oldest (what would now be the sixth in the preceding example) is deleted from disk.
A simple backup example might be to use a tool such as rsync to copy your files to another system for safekeeping.
Restricting the size of your log files is good if you have a fairly consistent workload and you attribute an amount of data to a rough timeline. Say, I know that 10 MB data is roughly half a day.
If you happen to log a lot of information, then obviously you may fill up this fixed size too quickly.
Let's look at the following example:
require 'logger'
log_size = 100 * 1024 * 1024
log_limit = 5
logger = Logger.new("log.txt", log_limit, log_size)
logger.debug("User 23643 logged in")
It's just that simple to implement log file size retention. We pass the number of files we wish to retain as the first argument followed by the maximum size of the files as the second argument, specified as a number of bytes (100 * 1024 * 1024 = 104857600, which in bytes is roughly 100 MB).
Note
The official Ruby documentation refers to these second and third parameters as the logs shift age and shift size logs.
The log file looks the same as usual, however, once the log file reaches the size limit (100 MB), then the Logger class will automatically create a new file named log.txt and rename the previous log file, which is now 100 MB in size, to log.txt.0.
This log file has now been "rolled over." So, what happens when the new log.txt file reaches 100 MB in size? The same process happens again except log.txt.0 is renamed to log.txt.1 and then log.txt is renamed to log.txt.0, and so on. Basically, you will end up with a history of log files named log.txt, log.txt.0, log.txt.1, log.txt.2, and log.txt.3.
Note
Some operating systems have this sort of functionality, built in. *nix systems, for example, can leverage a tool called logrotate to do a similar thing.
Time-Based Retention
The other option for log file retention is time-based retention. Simply put, this means we can roll over our logs on a daily, weekly, or monthly basis. This might be a better choice if the historical value of your logs is important.
For example, if you were informed that, on certain dates, your application was experiencing errors, it would be much easier to narrow down the logs to inspect if you kept daily log files rather than simply keeping 100 MB log files, which may contain any number of days' worth of logs. Here's how we do this:
require 'logger'
logger = Logger.new("log.txt", "daily")
logger.debug("User 23643 logged in")
Again, we just supply a second argument to the initializer or "shift age." Our options here are daily, weekly, and monthly.
Consider the following example:
logger = Logger.new("log.txt", "daily")
logger = Logger.new("log.txt", "weekly")
logger = Logger.new("log.txt", "monthly")
Internally, the Logger class will evaluate the timestamp of the file and determine whether it needs to roll over the log file or not. When it does, it will append a short timestamp to the end of the filename.
Upon roll over, we should see a file that looks like log.txt.20190731.
Note
If you are building an application in a Docker container, your application will need to write all its logs to STDOUT. You won't need to rotate log files at the application level.
Exercise 8.03: Creating a Rolling Log File
We've learned about log retention and how it can roll over log files at a specific time or size. Let's put this into practice by creating a log file that will "roll over." We'll set the size to 100 bytes so we can see the log files being created for ourselves each time we call the script:
- Create the log_test.rb file and write the following code:
require 'logger'
log_bytes = 100
log_limit = 5
logger = Logger.new("log.txt", log_limit, log_bytes)
logger.debug("Testing Log Rollover")
This will instantiate a new Logger class, specifying the log.txt file as the output. We're also configuring the number of log files to keep and the maximum size of each log file by supplying the second and third parameters to the initializer.
- Run the following script:
ruby log_test.rb
- In the current directory that the script resides in, you will now see a new log file named log.txt. There should be only one log.txt file. View the contents of this file.
- Run the script another six times and check the directory. You should see five files named as follows:

Figure 8.5: Rolling log output
Debugging
Debugging is one of the most important aspects of software development. Bugs are simply a fact of life for a software engineer. You can't avoid them, but you can get better at tracking them down and, most importantly, solving them quickly.
Even the best software engineers will write bugs from time to time. Having the right tools and knowing how to use them to solve a problem quickly is one of the most useful skills you can learn with any programming language.
When you start out writing Ruby, you will probably debug your application by simply writing puts statements everywhere, logging out the values of your variables to understand what's happening. This will become painful soon enough and you'll want to start using some more powerful tools and interacting with the code at runtime.
We're going to cover the basics of some of the most popular debugging solutions here, both from the command line and from the editor. By the end, you'll have a much better understanding of how to step through your code line by line, evaluate functions midway through program execution, and view the contents of variables without writing a single puts statement.
Let's get to it.
Debugging Concepts
We need to understand some basic debugging theory before we get started. This will be referred to throughout the chapter.
Breakpoints, call stacks, and debugger stepping are not specific to Ruby. These concepts are common to most languages, so it's worth taking a moment to grasp them properly.
Let's take a look at some fundamental debugging concepts we will want to grasp before we dive into debugging code.
Breakpoints
A breakpoint is a point in your code at which you can pause program execution and take a look around the current application state.
Variable values and application state will be available to view from your debugger at that particular point in time, which is incredibly useful for doing things such as inspecting the value of a variable or calling a particular function from a particular point in the code.
In an editor such as Visual Studio Code, a breakpoint is usually set and indicated by a red dot in the left-hand column of the editor.
The following screenshot shows an example of the Visual Studio Code editor with two breakpoints set on lines 7 and 14:

Figure 8.6: Breakpoints while debugging
When the debugger stops at a breakpoint, we will have access to the variables that have been assigned up until that point.
For example, in the preceding screenshot, when the debugger stops (often referred to as breaking) on line 7, we will be able to access the logger object, but not the users array. This is because the users array has not been assigned yet (we stopped on this line before it was executed).
Note
When we stop at a breakpoint, we have not yet executed that particular line of code. You must step to the next line in order to evaluate it.
However, when we stop on line 14, we will have access to the logger object and the users array because the users array has now been assigned in the previous lines. Furthermore, on line 14, we will have access to the locally scoped user variable for that iteration of the each loop.
Using breakpoints with Terminal-based debugging is a little different but works in much the same way. Using a Terminal debugger such as byebug or pry, we can achieve the same breakpoint functionality by inserting a call to byebug in our code, which will halt program execution once we reach it and provide us with a command line to look around and inspect the currently assigned objects and variables.
Note
Pry is a more powerful replacement version of IRB that offers some more advanced features, such as source code browsing and syntax highlighting.
Stack Trace/Call Stack/Back Trace
The call stack is the stack of operations at the current time of execution, whereas the stack trace can be thought of as a historical stack of operations that may not be current, it is a representation of a call stack. A stack trace is more likely to appear in an error log. A back trace is just another term for stack trace.
All of these equate to essentially the same thing for our purposes, which is a record of a trail of calling functions up until a given point of time, but for reference, when using a debugger, we're generally interacting with the call stack.
You will often hear people refer to these three interchangeably.
Imagine you drove through the middle of a busy city, turning left, then right, then right, then left again, then straight, then left, and so on. You can imagine that this may be hard to remember, but a call stack, in this example, would be a record of which turns you made at which streets in order to wind up where you are now.
Consider the following example:
require 'byebug'
def func1
func2
end
def func2
func3
end
def func3
byebug
end
func1
This simple example has three functions that each call the next: func1 calls func2, which calls func3. On line 12, we have inserted a breakpoint using byebug (we'll cover this more in a moment).
The program will halt at this line and allow us to inspect the environment. At this point, if we were to view the stack trace, we would see the functions listed, and the line numbers at which the code entered the functions, something like the following:
"debugger_stacktrace.rb:13:in 'func3'",
"debugger_stacktrace.rb:8:in 'func2'",
"debugger_stacktrace.rb:4:in 'func1'",
"debugger_stacktrace.rb:15:
These are sometimes referred to as the "frames" of a stack trace. As you can imagine, when you have a very large application with hundreds or thousands of files – say, for example, a payment processing system or a web application running on top of a framework with many layers of abstraction – a trace like this can be very helpful when tracking down problems. It's like a breadcrumb trail for your application's execution.
Viewing the Stack Trace
When you are stopped at a breakpoint or in a byebug session, you can view the stack trace by simply typing caller:

Figure 8.7: Stack trace using caller
The stack trace actually contains a lot more lines than we usually need, including internal Ruby code and debugger library code, but you can generally see your code listed toward the very end of the trace.
StepOver, StepInto, and StepOut
We've learned a little about the call stack now, which leads us to StepOver, StepInto, and StepOut. These are common terms used across all programming languages' debugging tools.
Sometimes, they are labeled differently or have slightly different sounding names, but in general they mean the same thing and that is to move about the call stack in some particular way, generally just referred to as stepping through your code.
Not all debuggers use the same terminology for stepping. The concept is the same but the icons or wording may be different.
StepOver generally means to move onto the next executable line of code; however, this will also step over function calls so we can debug the return value without stepping through the sub-function line by line. Consider the following example:

Figure 8.8: The StepOver output
In the preceding example, our breakpoint is set before calling the func1 method. If we were to StepOver at this point in time, func1 would be executed as normal and the program would end. The call to func1 will have been stepped over.
This does not mean the call to func1 was skipped from the program execution; the debugger just simply did not StepInto the function call.
StepInto means to step into a function and debug it line by line. Be aware that this may mean diving into framework and non-user application code. If you want to trace the full path of code execution, you'll want to use StepInto. Consider the following example:

Figure 8.9: StepInto output
Like our previous example, our breakpoint is set before the call to func1. This time, we have used StepInto instead and the debugger has now "stepped into" the lower function call. This may continue to go deeper and deeper depending on what functions are called next.
To StepOut, we'll step back out to the line where the current function was called.
Essentially, it's as if we had called StepOver instead of StepInto previously, but from a point in the code that we've already stepped into.
Debugging via the CLI with byebug
byebug is a Terminal-based debugger. It's very easy to set up and use and comes with enough useful features to cover most use cases.
To install byebug, simply install the gem package with the following:
gem install byebug
If you have ever programmed in JavaScript and used the debugger statement, byebug will feel similar but with a much more extensive set of features.
So, let's see it in action:
require 'byebug'
def reversed(name)
name.reverse
end
users = ["Matt", "Pete", "Brenton", "Geoff"]
users.each do |user|
byebug
end
Here, we have a basic example: an array of users, a basic function that returns a reversed version of the name parameter, and a loop that iterates over the users' names. We have added the byebug statement inside the loop, so we're going to get a byebug prompt on every iteration of the loop.
Calling byebug like this is a method call so it's not technically a breakpoint. It works in a similar way; however, byebug has a different meaning for what a breakpoint is internally and also offers the ability to set breakpoints via the byebug console.
Let's run this code. The output should look like the following figure:
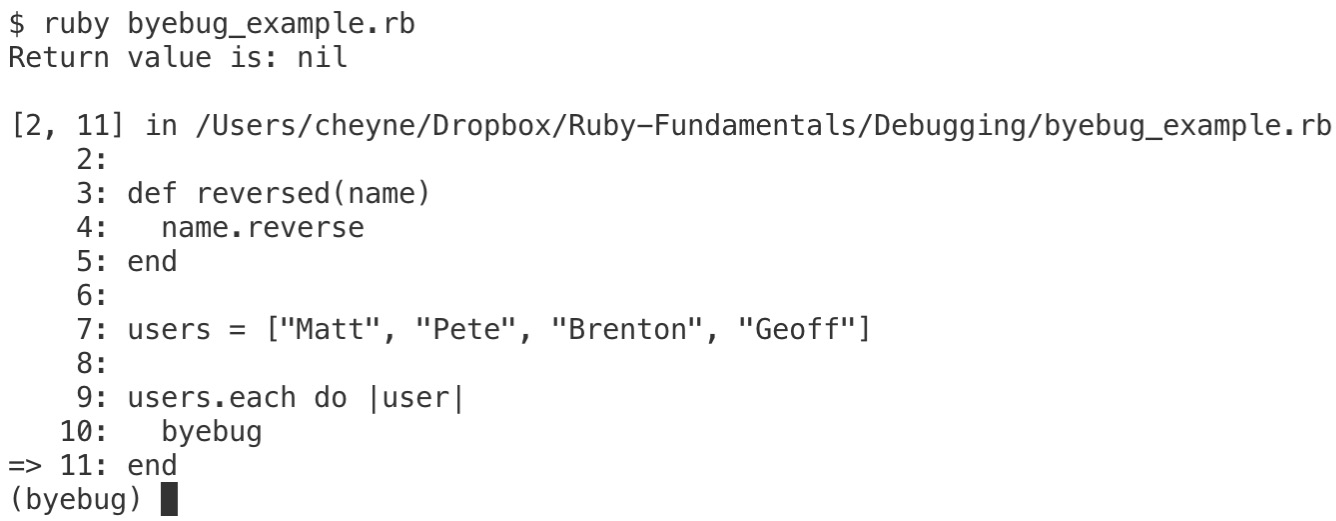
Figure 8.10: Debugging with byebug
As you can see, byebug has stopped on the line directly after our byebug statement. It then presents us with a prompt, with which we can inspect the current environment.
This session is what's known as a REPL, which stands for a READ EVAL PRINT LOOP. IRB and pry are other examples of a REPL in Ruby. REPLs allow you to type and evaluate code in real time without having to rerun the program:

Figure 8.11: Variable inspection in byebug
From this prompt, we can inspect variables, call functions, and pretty much do anything we would normally do in code.
You can see from the preceding screenshot that we're able to inspect the current user in the iteration by simply typing user. We grab the last user of the users array by calling the last method on the array, and we even call our own function by reversing the order.
A very useful command byebug offers us is the var command, which lists variable values for us. As you can see on the last lines of the preceding screenshot, running the var command, the local var local prints out the values of all local variables so we don't need to inspect them one by one. Pretty cool, right?
At this point, we want to move on with the program execution. We type continue or just c, which will continue the program execution until the next time a breakpoint or a call to byebug occurs.
In this case, it will be the very next iteration of the loop, which will be the next user in the users array:

Figure 8.12: Stepping from one breakpoint to another
In the preceding example, we're essentially stepping from breakpoint to breakpoint.
Conditional Debugging
Using byebug like this is not technically a breakpoint because we're actually just calling a function named byebug, which enters the debugging prompt.
This is actually very useful because if we're just calling a method, then we can use it like any other code, right?
Let's look at another example:
require 'byebug'
users = ["Matt", "Pete", ["John"], "Brenton", "Geoff"]
users.each do |user|
byebug if user.class != String
end
In the preceding example, we again have the array of users, except for one user in particular, which happens to be an array with a single element. In a real application, this is likely to cause problems and if we attempted to do any sort of string-specific operation on it, we would either get an error or some kind of undesired behavior.
Clearly, this is a bug. Maybe this list of users was generated by some other code and we're trying to track down the cause of an exception. Being able to break and inspect the environment at the exact element that's causing the issue is very useful.
We don't want to step through every single user – there could be hundreds or thousands of records, so instead we use a conditional statement to trigger byebug if we detect that the user is not a string.
When we run the code, we get the following:

Figure 8.13: Detecting odd characters in the array
As you can see, byebug has triggered on (and only on) the element in the array that was not a string, as defined by our condition, which has helped us to detect which of these elements is the odd one out.
Navigating with byebug
Byebug gives us a number of tools to navigate through our code. We can move up, down, back, forward, and any direction we need to. Here are a few of the most commonly used navigational commands:
- next (n): The next command will step to the next logical line of executable code, not just breakpoints or calls to byebug. This allows us to step through our code one line at a time and inspect it along the way. The next command will stepover function calls.
- step (or just s): The step command works the same as the next command although the step command will step INTO function calls.
- continue (c): This commands until the program ends, hits a breakpoint, or reaches a line. If there are no more breakpoints, the program will run to completion.
- up: Moves to a higher frame in the call stack. This may not be the previous line, more the previous calling function's line. If you remember the stack trace, we saw a little earlier, each of those lines are the "frames" this command will step through. You can move multiple frames at a time by passing an integer to the command; for example, up 3.
- Down: The opposite of up. This allows us to move down through the frames of the call stack. You can move multiple frames at a time by passing an integer to the command; for example, down 3.
- help: You can view the many features available in byebug by entering the help command from the prompt. You will see a listing of all the available options.
Pry can be integrated with byebug, which provides additional navigational commands:

Figure 8.14: Navigation commands in byebug
We've learned the basics of debugging with byebug, how to pause executions, and how to inspect the values of variables.
Let's try it out for ourselves now.
Exercise 8.04: Debugging with byebug
In this exercise, we will now use byebug to debug our code. Take the following steps to complete the exercise:
- Create the exercise_byebug.rb file and let's write some simple code to trigger a byebug session when we detect that an element in the array is not an integer:
require 'byebug'
nums = [1, 2, 3, "four"]
nums.each do |num|
byebug if num.class != Integer
end
- Run the script:
$ ruby exercise_byebug.rb
- At the byebug prompt, inspect the current var num by typing num. You should see the word four as the value of num:

Figure 8.15: Output for byebug debugging
Note
In this example, we are checking that the num class is not of type Integer. In Ruby versions prior to 2.4, this will be Fixnum. Ruby 2.4 and later replaced Fixnum and Bignum with Integer.
- Enter the letter c (to continue) and hit Enter. The program should run to completion:

Figure 8.16: Output for byebug debugging with completion
Thus, we have successfully used byebug to debug our code.
Debugging with Visual Studio Code
Debugging with a visual editor is generally a nicer experience, although it can take a little longer to set up.
Debugging with an editor provides you with an interface to click around in, which is a much more visual experience and can feel more comfortable to some users.
Using a similar example to before, here is what debugging within Visual Studio Code looks like:
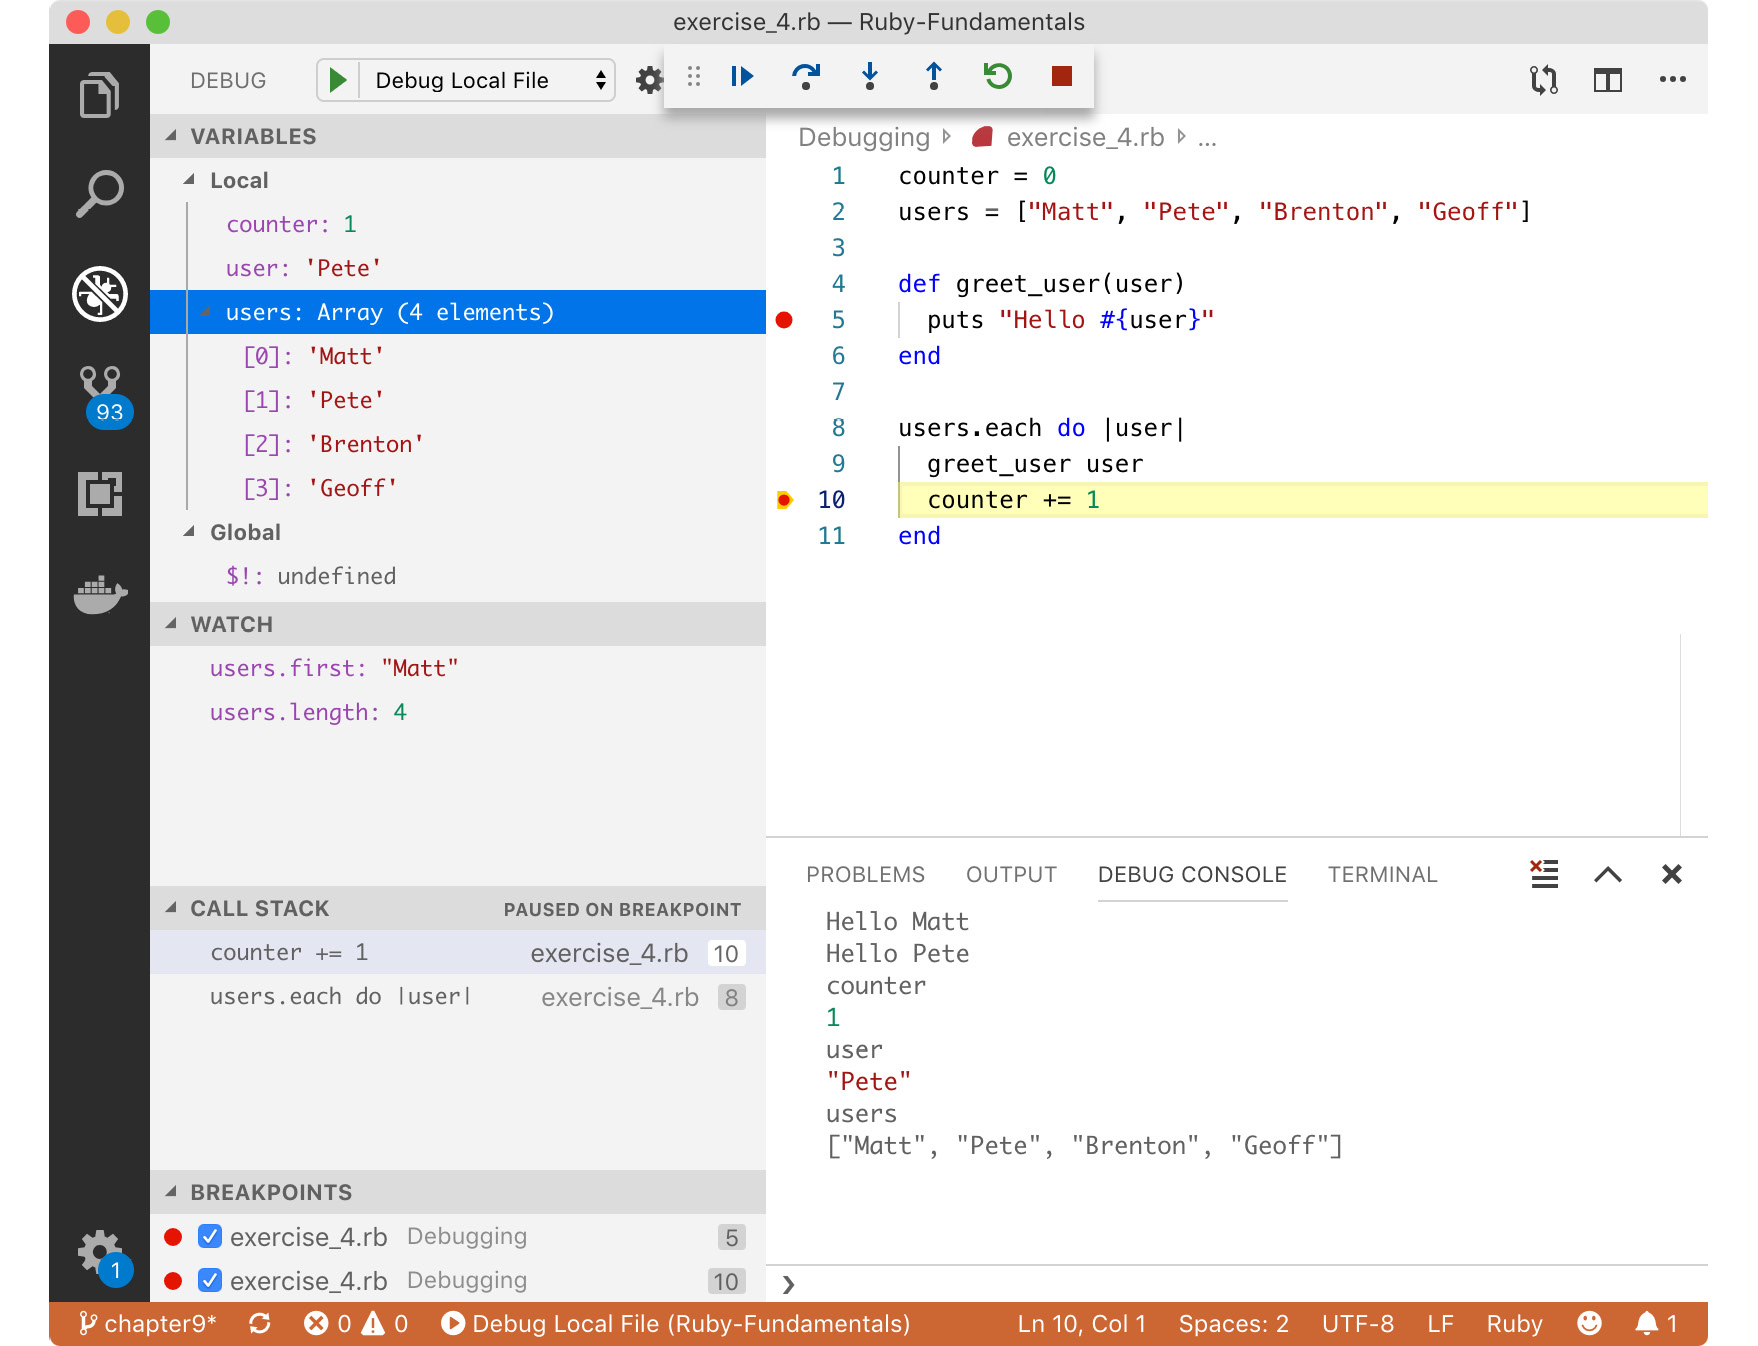
Figure 8.17: Debugging with Visual Studio Code
Here, we see a much more visual experience. All that information we previously had to type commands to reveal is now presented to us from a single interface. It might seem confusing but don't worry – it will make sense soon enough.
Let's take a look through this screen and understand what these individual panels are.
At the top of the main panel, we see a navigation bar with buttons we can click to continue, step over, step into, step out, and so on. There's no need to type any commands:
Figure 8.18 Navigation bar on Visual Studio Code
We can see the listing of local variables and what their current values are. These values are updated as we step through the code. You'll notice that the counter variable in this example has a value of 2. It has been incremented and the interface has been updated to reflect the change:

Figure 8.19: Variables list on Visual Studio Code
You can imagine that in a complicated application with more complicated data structures, this can be a very useful tool to see exactly what's happening during the execution of your application.
Below the local variables, we can see global variables. These can be accessed from anywhere in your program and are typically reserved for core Ruby language functionality.
Under the global variables, we have the watch panel. The watch panel is a useful place where you can pin expressions or variable names that you're interested in keeping track of. This panel will evaluate and display the expression or variable for you on each step. It's much like the local variables panel except that you can control what is kept and displayed in the watch panel. Think of it as a "Favorites" version of the variables panel.
We can use basic expressions as listed here:
- user == "James"
- user.class == String
- user.to_s
The expressions would look as follows in the watch pane:

Figure 8.20: The watch pane on Visual Studio Code
Under the watch pane is the call stack. The call stack or stack trace shows us the trace of method calls up until this point. On the right-hand side, we see the name of the file the breakpoint lives in (breakpoints across all files in your project will show up here as well as the line numbers those breakpoints are set at):

Figure 8.21: Breakpoint information on Visual Studio Code
Lastly, we have a listing of breakpoints, which is very handy when we have breakpoints spread out across multiple files. We can easily enable and disable breakpoints from this panel as we need for our whole project:

Figure 8.22: Breakpoints listing on Visual Studio Code
Setting Breakpoints
As we saw earlier in the chapter, the small red dots on the left-hand side of the main panel are our breakpoints. We can set breakpoints by simply clicking in this column on any line of our code, as shown in the following figure:

Figure 8.23: Setting breakpoints in Visual Studio Code
This is not specific to Ruby or Visual Studio Code and is generally the standard way that most editors, IDEs, and languages implement breakpoints.
Conditional Breakpoints
In the previous section, we were able to conditionally trigger byebug by simply adding some conditional logic to the following expression:
byebug if <expression>
This is a very useful tool and, thankfully, we can achieve the same functionality within Visual Studio Code.
To set a conditional breakpoint:
- Right-click in the left-hand breakpoint column on the main panel (like you were setting a breakpoint but right-clicking).
- From the pop-up menu, select Add Conditional Breakpoint.
- You'll now be presented with an expression input box in the right-hand pane, in which you can input an expression just like we did before. This expression can be any short snippet of code; for example, counter == 3 or counter.class != Integer:

Figure 8.24: Conditional breakpoint in Visual Studio Code
Now the breakpoint will only trigger when the counter equals 3.
Logpoints
Logpoints are much like breakpoints except they don't "break" into the debugger; they simply log the results out to the debug log for you. This is handy if you want to output some information but maybe don't want to interact with the debugger.
To set a log point, simply right-click, like we did for the conditional breakpoint, in the left column and select Add Logpoint:

Figure 8.25: Logpoints on Visual Studio Code
For example, maybe you want to view the value of a large list of items. Using breakpoints would be slow and require you to manually continue after each item. With logpoints, you can simply have it write to the debug log, and then inspect the results later.
Logpoints can be controlled like a normal breakpoint. They can be disabled, enabled, and conditionally triggered.
The Debug Console
In the last section, we used the byebug debug console. Debugging with a REPL console like this, as we saw previously, can be a powerful way to test functionality as we can call methods and interact with our code at any particular point of execution in real time, without the need to reload or restart the application:

Figure 8.26: Debug console on Visual Studio Code
Thankfully, we have access to a similar console with Visual Studio Code. Simply click the little Terminal icon in the top left-hand bar or click View > Debug Console and you'll see a pane appear at the bottom of the main panel:

Figure 8.27: REPL console
From here, we get access to a REPL console, much like byebug.
When we stop on a breakpoint from this debug console, we will have access to execute code and inspect the values of variables within the context of this line of code.
The debug console is an excellent tool for exploratory debugging when you're not quite sure what you're looking for and you want to have a poke around. Once you find what you're looking for, be it an expression or variable, you can add it to the watch panel for quick reference.
Note
The Visual Studio Code documentation covers these topics in greater detail. You can read more at https://packt.live/2VGaYwZ.
It's easier to learn by doing rather than reading in this situation, so let's set up the Visual Studio Code debugger and try it for ourselves.
Exercise 8.05: Debugging with Visual Studio Code
In this exercise, you will learn how to debug application code using Visual Studio Code.
In order to use the Visual Studio Code debugger, first, we need to install the Ruby language tools. We need to install the Ruby language extension. We do this by opening the Extensions tab in Visual Studio Code and searching for Ruby. It should be the first one listed, by Peng Lv. Click Install:

Figure 8.28: Installation of Ruby on Visual Studio Code
Now, perform the followings steps:
- Install the required debugging gems:
gem install ruby-debug-ide
gem install debase (or gem install byebug)
- Create a launch configuration for the Visual Studio Code debugger. This is essentially just a JSON file that tells Visual Studio Code how to execute the debugger and on what files. Click the Debug tab in the left-hand column, as shown in the following figure:

Figure 8.29: Debug option
- In the top dropdown of the debug panel, next to the play icon, click Add Configuration…, as shown in the following figure:

Figure 8.30: Adding configuration
- Select Ruby, then Debug Local File.
In the newly created launch.json file, change the program line to "program": "${file}". Changing this program line to ${file} simply tells Visual Studio Code that we want to debug the currently open file and not a fixed file (main.rb), which it was previously, as shown in the following figure:

Figure 8.31: The contents of launch.json file
- There are a number of other variables we can use here to target the correct file. For example, if our application always started with a file named run.rb at the root of our application directory, we would use ${workspaceRoot}/run.rb.
Note
You can read more about these options at https://packt.live/2IPf9RV.
You can add multiple launch configurations for different purposes. For example, one for debugging the application and one for debugging your tests.
- Create the exercise_vscode.rb file with the following code:
counter = 0
users = ["Matt", "Pete", "Brenton", "Geoff"]
def greet_user(user)
puts "Hello #{user}"
end
users.each do |user|
greet_user user
counter += 1
end
We'll keep things simple here for demonstration purposes.
This code will iterate over an array of names, calling the greet_user method each time, passing in the user's name, which will print Hello <user>, followed by incrementing a counter.
- Next, we need to set breakpoints. In the left-hand column (next to the line numbers) in Visual Studio Code, click to add a breakpoint for lines 5 and 10, as shown in the following figure:

Figure 8.32: Debugging with VS Code
- Step through and inspect the code.
Hit F5 on your keyboard or click Debug > Start Debugging from the application menu.The first breakpoint should be line 5. Inspect the value of user. It should equal the first element of the users array.Click the continue button to move on to the next breakpoint, which should be line 10. Continue to click continue and take a moment to inspect the variables and environment at each break. Observe the values changing in the Local Variables panel on the left.
Thus, we have successfully used Visual Studio Code to debug the code.
Activity 8.01: Perform Debugging on a Voting Application
In this activity, we'll refactor our voting machine application that we have been building since Chapter 5, Object-Oriented Programming with Ruby, to output a log trail that we can use for debugging purposes.
The voting machine application has reported duplicate votes and categories from our users.
What we would like to do is to have a historical log of when things are happening stored somewhere we can access without needing to see the screen output. What we need is a log file.
The following steps will help you complete the activity:
- The Logger class must be instantiated as method calls are made on the instance of the class. Our LoggerController module, is not a class, so we will need to instantiate the Logger class somewhere.
- We can do this by overriding the initialize method in the LoggerController module, instantiating the Logger class, and then calling super. This will ensure we call both the module and parent classes' initialize methods.
- Extend the ControllerLogger module to include a new log_to_file method that will write a timestamped log record to a file. Parameterize this method so that we can specify which log level we want the log message to be written out as (set the default to debug).
- Format the log output to something more user-friendly; it won't just be us reading it.
- We'll also call this method from our existing log method so that we also capture a timestamped version of any log messages in our general log method.
The output should be as follows:
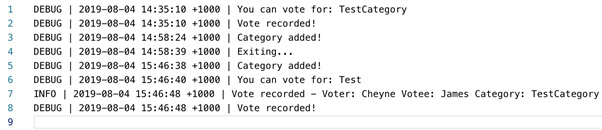
Figure 8.33: Output for the voting application
Note
The solution to the activity can be found on page 482.
Summary
Logging and debugging are essential tools for any software project, and while we are learning this in Ruby, the principles are the same for any language.
Logging is one of those things that you don't truly appreciate until you really need it, and when you need it, you'll be glad you spent that extra little bit of time setting it up properly. As we've seen in this chapter, it really doesn't take much effort to dramatically improve your application's logging; even less if you set it up correctly from the very start of a project. With handy classes such as the Logger class, we can achieve very useful results with minimal work. We also dipped our toes into the world of debuggers. This is another area that is easily overlooked until you really need it. Once the complexity of an application grows to a certain level, printing out the values of variables is simply not going to cut it.
The ability to step through code execution and inspect the environment along the way is incredibly powerful. It can save you a lot of time and headache when things go wrong. There is a multitude of other functionality built into the standard debugger – enough to fill a books worth of content alone. With these new tools at our disposal, we're ready to tackle any bugs that arise, be they in development or production.
In the next chapter, we will look at a more advanced programming concept, known as metaprogramming. Metaprogramming is like a subset of software engineering that allows code to use other code as input, or in some cases, code that can generate new code. This opens up a whole new world of programming possibilities and expands our software engineering toolbox with an array of exciting functionality and algorithms. When you're ready, let's take our skills up a notch and start learning about metaprogramming with Ruby in the next chapter.