Assessments
Chapter 1
- It is used to assist with the discovery and mapping of current security solutions, and to plan for the future state.
- The three main components are Azure Monitor, Azure Sentinel, and Logic Apps.
- The main platforms include Identity and Access Management (IAM), Endpoint Detection and Response (EDR), Cloud Access Security Broker (CASB), Cloud Workload Protection Platform (CWPP), and the Next Generation Firewall (NGFW).
- Third-party solution providers include AWS, Cisco, Palo Alto Networks, Fortinet, and Symantec.
- There are seven steps in the scenario mapping exercise.
Chapter 2
- The name of the query language is the Kusto query language (KQL).
- Azure Lighthouse enables the central management of multiple Azure tenants, usually deployed by managed service providers, but may also be used in complex environments.
- A few of the different layers of protection for securing data are: Microsoft-managed incident management process, data retention and deletion policies, per data source type, and data segregation and isolation, with geographic sovereignty.
- Log Analytics workspaces can be created via the web portal, PowerShell, and the command-line interface.
- Engineers should be provided with the role of Azure Sentinel Contributor and Log Analytics Reader.
Chapter 3
- The seven Vs of big data are Volume, Velocity, Variety, Variability, Veracity, Visualization, Value.
- The four types of connectors are native, direct, API, agent-based.
- The Syslog server acts as a central collector for logs that support Syslog or CEF data types, and forwards them on to the SIEM solution.
- Azure Sentinel will store data for 90 days as part of the service. If longer retention is required, a charge is applied based on the volume of data retained and the length of time (which can be up to 2 years).
- Alternative storage options include Azure Blob storage, Azure SQL, and Azure Data Lake Storage Gen 2.
Chapter 4
- Threat indicators may include IP Addresses, URLs, or specific files.
- ATT&CK stands for Adversarial Tactics, Techniques, and Common Knowledge.
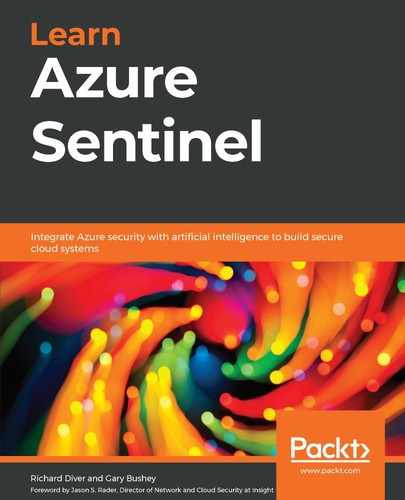
- The following Azure Sentinel components can utilize Threat Intelligence feeds:
- STIX and TAXII were developed as an open community effort, sponsored by the U.S. Department of Homeland Security, in partnership with the MITRE Corporation.
Chapter 5
- You need to filter the StormEvents table by all the states that are set to California (remember the case-sensitive versus not case-sensitive filters) and then get a count of those rows. You could cheat and look at the output of the first two lines of the following code in the ADE, but that isn’t really the best way to get the answer, which is 898:
StormEvents
| where State =~ “California”
| summarize count()
- This entails looking at the StormEvents table and getting just one instance of each State. Use the distinct operator for this:
StormEvents
| distinct State
- You will need to look at the DamageProperty field in the StormEvents table and make sure it is greater than 10,000 and less than 15,000:
StormEvents
| where DamageProperty >10000 and DamageProperty <15000
- You have three out of the four columns needed in the StormEvents table already. The fourth column, the one for the total amount of damage, can be created by adding the DamageProperty column and the DamageCrop property. In the following answer, it is called TotalDamage but it really does not matter what you call it as long as you use the same name in the extend and the project commands. Bonus points if you combined extend and project into one. While this is perfectly legal in KQL, if you want to use the variable again, then extend will be needed as the project just outputs the results:
StormEvents
| extend TotalDamage = DamageCrops + DamageProperty
| project State, DamageProperty, DamageCrops, TotalDamage
Chapter 6
- You can see pre-made queries by using the sample queries and the query explorer.
- Use the filter icon at the top of the result pane to show specific computers without changing the query.
- To see a preview of the log entries; go to the Tables pane, mouse over the desired log, and click on the eye icon.
- To change the number of results on a page when viewing all results pages, go to the page settings and change the Set # of rows per page dropdown to 200.
- To change the number of results on a page when viewing a single results page, go to the results footer and change the Items per page dropdown to 200.
Chapter 7
- The four different rule types are Scheduled, Fusion, Microsoft Security, and ML Behavior Analytics.
- To run a rule on a set interval, use the Scheduled rule type.
- Yes, you can have alerts from other Azure security systems create incidents in Azure Sentinel.
- To have a playbook run automatically, select a playbook from the Automated response page.
- To delete a rule that’s no longer required, you can hover your mouse over the rule and select Delete from the context menu or select the rule and click Delete in the header.
Chapter 8
- To create a new workbook, you either use a template or create one from scratch.
- To show user instructions on how to use the workbook, use the Text step type.
- To change how far back in time a query in a workbook will search, create a time parameter and change all the query steps to use the new parameter.
- Yes, you can have a workbook step only show when certain conditions are met. Enable the Make this item conditionally visible in the step’s advanced settings and then add a condition.
- To show two steps side by side, go to each step’s advanced settings and under the Style tab, enable Make this item a custom width and set each to 50%.
Chapter 9
- To change the incidents view to show In Progress only, go to the Search and Filtering section and under the Status dropdown, select In Progress.
- An incident’s severity can be viewed in two ways: the first way is by looking at the colored strip at the top of the page and the second is by looking at the Severity dropdown.
- In the Incident Detail pane, if the Investigate button is grayed out, this indicates this incident has no entities.
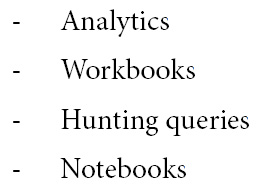
- To get the full details of an alert, follow these steps:
- To check for malicious URLs, go to the Investigation page, click on the Info button and then select the entity. Look at the DETONATIONVERDICT field.
Chapter 10
- To run a single hunting query, select the query and, in the details pane, click the Run Query button.
- To run all hunting queries, click the Run all queries button in the hunting page’s header.
- To view the results of a single hunting query, select the query and in the details pane, click the View query results link.
- To create a new bookmark, run the query on the Logs page, select the result(s) to add to a bookmark and then click the Add bookmark button.
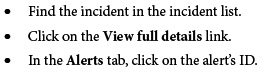
- To associate a bookmark with an incident, you can use one of two methods:
Chapter 11
- To use a Logic App as an Azure Sentinel playbook, it must use the Azure Sentinel connector.
- To tell if a playbook ran successfully, select the playbook from the playbook’s page and then look at the Run History section.
- When using a playbook’s workflow to get information about an incident, use the Alert | Get Incident action and pass in the necessary parameters.
- Dynamic content is information provided by either a connector or action that can change for each instance of the playbook; for example, the System Alert ID field that was used to get the incident in the Creating a simple Azure Sentinel playbook section.
- Yes, you can combine dynamic and static content in one field.
Chapter 12
- The purpose of an ITSM platform is to log, track, and communicate the coordination of efforts required by each of the solution areas and experts to resolve IT requests, issues, and especially security incidents.
- The tuning of alerts is necessary to ensure they are relevant, reduce noise, are still valid, and are not returning false positives.
- The risk of tuning alerts is the potential of missing true positives.
- When populating a ServiceNow dropdown field, the text being passed in has to exactly match what is in ServiceNow.
- An Expression is used when a computation is performed on a value before using it in a Logic App field.
Chapter 13
- The two roles are the SOC Engineer and the SOC Analyst.
- Both roles need to be involved in carrying out the scenario mapping exercise.
- The log ingestion rate and pricing tier should be checked at least once per month, carried out by the SOC Engineer.
- The SOC Analyst should check the Incidents page every day.
- You should look at ingesting logs the moment the instance is created. This will provide maximum visibility of security events.
..................Content has been hidden....................
You can't read the all page of ebook, please click here login for view all page.