Web-based or paper-based surveys: a quandary?
Abstract:
Over the last decade, the routine collection of stakeholder feedback has gradually become embedded in university quality systems throughout Australia. The most common practice is the use of surveys to evaluate student perceptions of their units (subjects), course (programme) and overall student experience. Initially, most surveys were paper-based and administered in class. Over time, web-based surveys have been introduced and while it is accepted that this survey mode delivers administrative efficiencies, a widespread view is that students are less likely to respond to web-based surveys. This chapter tests this assumption by examining the usage patterns of print-based and web-based student unit evaluation surveys and response rate trends over a period of three years at a large research-intensive university in Australia. While this analysis is restricted to one university's data, it points to some important findings for leaders in other universities who are responsible for making decisions about quality assurance policies, practices and budgets.
Introduction
With the growth of quality assurance in universities and an emphasis on quality of teaching and accountability, there has been a parallel growth in implementing effective stakeholder feedback mechanisms. Bennett and Nair (2010) reported that this significant increase is underpinned by four drivers: diagnostic feedback to aid in the development and improvement of teaching; research data to inform design changes in units, courses, curriculum and teaching; administrative decision-making activities (e.g. performance management and development appraisals); information for current and potential students in the selection of units and courses; and measurement of the quality of units and courses that is increasingly tied to external funding sources and formulas.
Stakeholder feedback is primarily collected by surveys utilising traditional paper-based administration and, more recently, online administration. This trend was documented in a study of American universities conducted in 2003 which suggested that around 45 per cent of universities are either actively engaged with web-based surveys, considering the use of web-based instruments or have planned to initiate web-based feedback in the next round of evaluations (Hoffman, 2003). This change is significant when compared to a study reported three years earlier by Hmieleski and Champagne (2000) where the data suggested online usage for surveys in universities was around 2 per cent.
One possible explanation for this increase in online surveys is that learning environments are more flexible than previously, which in turn requires the evaluation systems to keep pace with the change. Students increasingly have more flexibility in how, where and when they study and the requirement to attend class is largely disappearing in the new global learning environment. Utilisation of web-based surveys is also linked to an increase in the take-up rates of mobile digital communication devices. As society, and students in particular, becomes more reliant and comfortable with iPhones, personal tablets, laptops and other mobile devices, they prefer many of their routine interactions with the university to be conducted online. Despite the popularity of mobile digital devices, the use of web-based surveys has met with resistance, especially from some academic staff, who cited low response rates and unreliability of results as reasons for their concerns (e.g. Dommeyer et al., 2004).
This chapter examines web-based surveys from the point of view of administration, response rates and usefulness of student feedback. Trend data from a large Australian research-intensive university, which used both print-based and web-based surveys over a three-year period, are analysed. The findings provide some valuable observations on paper-based and web-based survey tools for institutions and university leaders. The findings also highlighted the need for further research on the use of paper-based and web-based survey tools across other universities in order to investigate whether the findings from this single case can be generalised to the wider higher education sector.
Administrative considerations
Practice and data strongly support the view that administration of web-based surveys has many advantages over administration of print-based surveys. Some of these advantages include:
![]() Cost. Although web-based approaches may initially require large development costs, the operational costs are relatively low compared with print-based systems. The savings come from not having to print questionnaires, especially high-quality questionnaires suitable for optical scanning. There are also considerable savings from not having to employ staff to distribute, collect, clean questionnaires for scanning, scan, transcribe comments, re-enter responses on damaged questionnaires and to store data (Bennett and Nair, 2010; Dommeyer et al., 2004; Bothell and Henderson, 2003; Johnson, 2003).
Cost. Although web-based approaches may initially require large development costs, the operational costs are relatively low compared with print-based systems. The savings come from not having to print questionnaires, especially high-quality questionnaires suitable for optical scanning. There are also considerable savings from not having to employ staff to distribute, collect, clean questionnaires for scanning, scan, transcribe comments, re-enter responses on damaged questionnaires and to store data (Bennett and Nair, 2010; Dommeyer et al., 2004; Bothell and Henderson, 2003; Johnson, 2003).
![]() Class time. Web-based surveys are typically not conducted during class time, unlike print-based surveys, thus web-based surveys do not infringe on valuable time set aside for teaching (Dommeyer et al., 2004; Sorenson and Reiner, 2003).
Class time. Web-based surveys are typically not conducted during class time, unlike print-based surveys, thus web-based surveys do not infringe on valuable time set aside for teaching (Dommeyer et al., 2004; Sorenson and Reiner, 2003).
![]() Accessibility. Many surveys are administered near the end of the term when some participants are absent from the classroom. The availability of surveys online allows greater opportunity for participants to complete them at a time when it suits them (Ardalan et al., 2007).
Accessibility. Many surveys are administered near the end of the term when some participants are absent from the classroom. The availability of surveys online allows greater opportunity for participants to complete them at a time when it suits them (Ardalan et al., 2007).
![]() Data processing and storage. With online collection, the data are processed as soon as they are entered. There is also less need to clean the data collected online (Dommeyer et al., 2004; Sorenson and Reiner, 2003). Unlike paper-based surveys which are bulky to store, web-based surveys can be stored electronically, which also makes them easier to retrieve.
Data processing and storage. With online collection, the data are processed as soon as they are entered. There is also less need to clean the data collected online (Dommeyer et al., 2004; Sorenson and Reiner, 2003). Unlike paper-based surveys which are bulky to store, web-based surveys can be stored electronically, which also makes them easier to retrieve.
![]() Anonymity and confidentiality. Compared to paper surveys, online surveys have a distinct advantage in that participant handwriting does not appear on completed questionnaires. Although this ensures student anonymity, as pointed out by Dommeyer et al. (2004), other studies have indicated that anonymity is still an issue as log-ins can be matched to individual students via the student management systems (Avery et al., 2006).
Anonymity and confidentiality. Compared to paper surveys, online surveys have a distinct advantage in that participant handwriting does not appear on completed questionnaires. Although this ensures student anonymity, as pointed out by Dommeyer et al. (2004), other studies have indicated that anonymity is still an issue as log-ins can be matched to individual students via the student management systems (Avery et al., 2006).
![]() Provide more information. Researchers comparing online and paper-based responses have shown that participants provide more information to open-ended questions in an online environment compared to paper-based format (Ardalan et al., 2007; Dommeyer et al., 2004; Hmieleski and Champagne, 2000; Layne, DeCristoforo and McGinty, 1999).
Provide more information. Researchers comparing online and paper-based responses have shown that participants provide more information to open-ended questions in an online environment compared to paper-based format (Ardalan et al., 2007; Dommeyer et al., 2004; Hmieleski and Champagne, 2000; Layne, DeCristoforo and McGinty, 1999).
Further, an added advantage of most online tools is that they allow participants to return to their responses and edit them before final submission.
![]() Freedom to provide feedback without external influence. Dommeyer et al. (2004) argued that in web-based surveys there is less opportunity for faculty or other interested parties to influence the evaluation. Further, research literature also asserts that the presence of the teacher in or near the classroom when questionnaires are administered in-class can impact on the evaluation outcome (Ardalan et al., 2007).
Freedom to provide feedback without external influence. Dommeyer et al. (2004) argued that in web-based surveys there is less opportunity for faculty or other interested parties to influence the evaluation. Further, research literature also asserts that the presence of the teacher in or near the classroom when questionnaires are administered in-class can impact on the evaluation outcome (Ardalan et al., 2007).
![]() One response per participant. Another advantage of web-based surveys over paper-based surveys is that safeguards can be built in to prevent multiple completions of surveys by a single participant.
One response per participant. Another advantage of web-based surveys over paper-based surveys is that safeguards can be built in to prevent multiple completions of surveys by a single participant.
![]() Closing the loop. With a faster turn-around time in producing reports, which is facilitated by web-based surveys, it is possible to enable participants in the surveys to view their feedback at the same time these reports are viewed by teachers, managers and administrators.
Closing the loop. With a faster turn-around time in producing reports, which is facilitated by web-based surveys, it is possible to enable participants in the surveys to view their feedback at the same time these reports are viewed by teachers, managers and administrators.
The previous discussion has identified many administrative advantages of web-based surveys. However, a key disadvantage that is often cited in literature is that online responses typically elicit lower response rates than 'in-class' administration of surveys (Dommeyer et al., 2004; Porter, 2004). The issue of response rates with respect to print and web-based surveys is investigated in the following section.
Survey response rates
Several studies have suggested possible reasons for low response rates to web-based surveys. The reasons ranged from the fear that student responses can be tracked back through to student apathy and technical impediments (Avery et al., 2006; Dommeyer et al., 2004; Sorenson and Reiner, 2003). The type of technical barriers raised included: low levels of computer literacy among certain cohorts; slow modem speeds; unreliable internet connections; low-end or outdated browsers; limited accessibility to computers at convenient times for the students to complete and submit the surveys; and other accessibility problems, in particular for disabled students (Dommeyer et al., 2004; Cummings et al., 2001; Ravelli, 2000; Sorenson and Reiner, 2003).
However, current thinking suggests that low response rates are more likely due to the lack of engagement of students in the process than technical issues (Coates, 2006; Nair et al., 2008). Consequently, a variety of strategies designed to encourage greater student participation have been explored in the literature. These include: systematic reminder emails; the practice of requiring students to complete surveys before they can get access to online registration of new courses or obtain other information from the institution's web pages; and the use of enticements to elicit greater interest from potential respondents (Coates et al., 2006; Dommeyer et al., 2004; Porter, 2004). The evidence on incentives has been somewhat varied, with no indication that an incentive always results in a higher response rate (Dommeyer et al., 2004). Major disadvantages and ethical questions in having incentives have also been identified. These included, for instance, the cost of reasonable incentives according to the needs of the cohort and the compliance with international gambling laws (Bennett and Nair, 2010).
While the above studies may point to some factors which contribute to low response rates, there is an emerging view that low response rates are highly correlated to a lack of follow-up action. In other words, response rates are generally quite low where there is little evidence of action being taken in response to feedback (Harvey, 2003; Leckey and Neil, 2001; Powney and Hall, 1998). Leckey and Neil (2001) argued that 'closing the loop' is an important issue in terms of total quality management: 'If students do not see any actions resulting from their feedback, they may become sceptical and unwilling to participate' (p. 25). Harvey (2003) supported this finding, adding that students need to be convinced that change has occurred based on their feedback. Bennett and Nair (2010) also suggested that there was a need to provide more information to students about the purposes and the subsequent use of evaluations in the quality process.
Naturally, those who are involved in analysis and discussion of survey results are interested in response rates and the difference between web-and print-based surveys. However, several studies reported that there was little evidence to suggest that online surveys with lower response rates produce biased evaluations (Coates et al., 2006; Layne et al., 1999; Porter, 2004). Other studies which looked at the difference between online versus paper-based surveys showed similar mean scores, factor structures and reliabilities (Buchanan and Smith, 1999; Fouladi et al., 2002).
Bennett and Nair (2010) reported similar findings in a study carried out at an Australian research-intensive university on unit evaluation data for first-year Business and Economics students. In this study, the initial online survey was re-run in a paper-based format. The response rate for the paper-based survey was 65 per cent and for the online survey 36 per cent. The differences in the results for items relating to the overall unit were not found to be statistically significant. The conclusion from this work was that the generic results from the unit evaluation questionnaire were reliable, despite the smaller sample size for online surveys compared to the print-based surveys.
Analysis of trend data
The previous section of this chapter documented growth in web-based surveys across the higher education sector and discussed the administrative benefits of this mode of collecting student feedback. It also challenged perceived concerns of the effects of lower response rates on the reliability of the feedback. The next section explores these discussions further by analysing trend data from a large research-intensive Australian university which has administered both print-based and web-based surveys for over three years.
The university has more than 55,000 students. It operates across six Australian and two international campuses in Malaysia and South Africa and offers many courses in partnerships in other countries including Singapore, Hong Kong and Indonesia. The data utilised are from student unit (subject) evaluations, which is the core quality feedback tool administered at the university. The unit evaluation survey contains ten core items common to all unit evaluations with up to ten additional quantitative items nominated by a faculty. The surveys are administered each semester but each unit is evaluated at least once in the year it is offered.
In 2005, the institution invested significantly in implementing a state-of-the-art electronic evaluation system, which facilitates both online and paper-based administration of surveys (Nair and Wayland, 2005). The evaluation system has a number of advantages, including the ability to store all data in a central database as well as providing accessibility of surveys to the visually handicapped.
Online unit evaluations are administrated over a five-week period towards the end of each semester. Paper-based evaluations are administered on a schedule developed by faculties and usually conducted during the last week of each semester. Administrators other than the instructors oversee the completion of surveys during class time. On average, a typical full-time student would be asked to complete four evaluations each semester.
Students in units selected to be electronically evaluated are notified by e-mail at the start of the five-week period. The evaluations are accessed through the student portal, which is linked to the relevant unit evaluation questionnaires. Students completing web-based evaluations can complete the survey at the time of their choice within the five-week period. Reminder e-mails are sent weekly to students who have not responded. Students are advised in the e-mails that their responses remain anonymous and confidential and their student identity is not linked to their responses in the database. Results of the student evaluation of units are posted on a common website for all staff and students to review at the end of the survey period.
Results
Student evaluations of units are undertaken for each unit, in the year they are offered. Table 7.1 summarises the number of units that were evaluated using the web and paper-based modes of administration for the years 2006, 2007 and 2008. The decrease in the overall number of units evaluated from 2006 (8,243) to 2008 (7,698) is a result of a major review of units offered during this time. The number of units evaluated in 2009 was 5,926 (semester one).
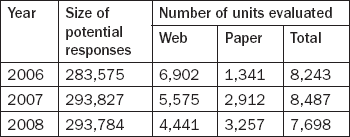
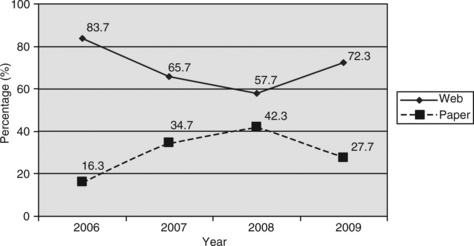
Figure 7.1 tracks the usage pathways for print-based and web-based surveys. It illustrates the decrease in the number of web-based surveys between 2006 with over 80 per cent to about 58 per cent in 2008. It shows paper-based surveys as a mirror image of the web-based trends. Although the full data for 2009 was not yet available at the time of writing this chapter, early indicators suggest that the trend to increased print-based and reduced web-based surveys in 2007 and 2008 will be reversed in 2009, where a greater preference for web-based surveys has re-emerged (web-based surveys for semester one stand at around 72 per cent; see Figure 7.1).
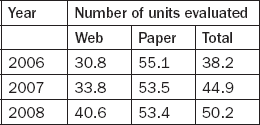
The data on response rates for web-based and print-based surveys also reveal some notable trends. Firstly, there was a gradual increase in overall response rates for unit evaluation surveys. Table 7.2 indicates a steady climb from 38.2 per cent in 2006 to 50.2 per cent in 2008. Another noteworthy aspect to point out is that while paper-based response rates reached a plateau around the mid to low 50 per cent, the response rate for web-based surveys has grown from 30.8 per cent in 2006 to 40.6 per cent in 2008.
Discussion
The data presented in this chapter suggested that in 2006 there was a remarkably high preference (over 80 per cent) for web-based evaluation surveys among academic staff, which contradicts the concerns about low response rates and subsequent unreliability of the data reported in the literature. This suggests that staff and decision-makers at this university were either unaware of the literature or felt that the advantages of web-based administration of surveys outweighed the concerns. It may also reflect a staff profile which is technologically informed and attuned to student communication preferences and technology usage patterns.
Although the demand for web-based surveys in the university declined from 2006 to 2008, the number of web-based surveys requested was still very strong, with over 4,441 units (57.6 per cent) evaluated using a web-based survey in 2008. In addition, the data available for 2009 semester one suggest a strong swing to web-based surveys with around 72.2 per cent of units nominated for web-based administration.
The data on response rates for web-based and print-based surveys revealed some noteworthy trends. The overall response rate increased from 38.2 per cent in 2006 to over 50 per cent in 2008, while the total number of units evaluated and the population size remained fairly constant. These figures would appear to diminish the fears of those who promote theories of the so-called 'survey fatigue'. This evidence strongly suggests that students were still willing to complete surveys, and indeed participation was growing rather than diminishing.
The response rate for the print-based surveys over the period was around 53 per cent, while the web-based response rate improved by 10 per cent (from 30.8 per cent to 40.6 per cent). This trend of web-based evaluations yielding higher response rates over time supports Avery et al.'s (2006) findings. Interestingly, like other studies, such as Dommeyer et al. (2004), which suggested utilising incentives to boost participation rates, the unit evaluation process described in this study did not utilise any form of incentives except the approach of informing students that their feedback will be used for improvements and students will be informed of the changes (Bennett and Nair, 2010).
The data analysed in this study support other research findings that suggest that web-based surveys are likely to produce lower response rates than traditional paper-based methods. The reasons for the higher response rates for paper-based surveys reported in the literature tend to be centred on the benefits of having a captive audience in the classroom, where there is little competition for the attention or time of the student. Furthermore, there is a view that higher response rates in the surveys administered in the classroom may be a result of the influence of instructors in class requesting that the evaluations be filled out. On the other hand, web-based evaluations are usually completed in one's own time, in the personal space of the respondent, and are not subject to pressures to respond which may be present in the classroom environment.
Table 7.2 suggests that response rates for paper-based surveys have reached a plateau. There are a number of possible reasons for this flattening out. On average, a student completes four unit evaluations at the end of each semester, along with other teacher evaluations. Class observations conducted by these authors indicate that students were often not able to distinguish between teacher and unit evaluations, which resulted in some students' not responding to a second questionnaire in the same class. Another plausible explanation is that in the current higher education environment many students do not attend class regularly because of work commitments and the availability of learning materials online. Instructors have reported this growing trend as a reason for lower than expected response rates in paper-based surveys. Online surveys, on the other hand, have shown a steady increase (see Table 7.2).
The authors are aware that this chapter draws conclusions based on data from a single institution. Therefore, further research is needed to investigate the wider applicability of the findings regarding the increase in online survey response rates presented here. There are a number of factors which should, however, be noted. Firstly, current students are more attuned to electronic forms of surveying, thus the cohorts are more technology-savvy. Secondly, a number of units have online components which make it very convenient for students to complete web-based surveys, as they work online on a regular basis. Thirdly, online surveys have a distinct advantage of enabling participants to complete the survey at a time and place of their choosing. This sits well with the current student cohort, where many students not only take online units but are also frequently off-campus due to employment and family commitments. Further, there is greater acceptance that web-based surveys provide a confidential and anonymous way to give feedback.
Staff in higher education institutions are often critical about online surveys. This is often based on an assumption that online surveys tend to produce significantly fewer responses than paper-based surveys. Table 7.2 indicates that this gap may be closing and is likely to continue to reduce as web-based surveys become more embedded in the higher education system. The work of Bennett and Nair (2010) suggests that implementation of effective communication and engagement strategies is effective in increasing student participation rates. Such strategies include regular communication with students on the use of survey data, assuring the student body that the surveys are confidential and anonymous and demonstrating that student feedback is used to initiate change by providing specific examples of improvements.
The findings reported in this study need to be viewed within the following limitations. Firstly, the data reported on in this study was drawn from one university and only relates to student unit (subject) evaluations. Secondly, no formal student interviews were conducted to explore possible reasons for the generally lower but steadily increasing response rates for web-based surveys. Further, research is required to delve into the reasons behind the growing popularity of web-based surveys. The use of student focus groups may be one way of further investigating the dynamics of web-based surveys.
Conclusions
University leaders and quality managers are acutely aware of the need to listen regularly to the student voice. Evaluation surveys are one of the most popular ways of routinely collecting student feedback, and the decision whether to use print-based or web-based surveys – or indeed a combination of both – is a constant challenge. In many cases, low response rates from web-based surveys limit the use of data that has been collected. The findings presented in this chapter suggest that web-based evaluations are not only an effective form of surveying students but that there is a tendency of response rates increasing over time.
Similarly to other research findings, this study found that web-based evaluation methods (compared to paper-based approaches) produced lower response rates. However, the evidence in this chapter suggests that web-based surveys still provide valuable information and that, over time, they are likely to yield higher response rates due to student preferences for mobile and digital methods of communication.
While further research is required to test this assumption, the authors are of the view that, at the case study university, practical changes in the way web-based surveys were administered (including a strategic communication plan) led to increases in response rates. This chapter suggests that, to increase web-based survey response rates, it is important to engage with stakeholders in the media of their choice.
References
Ardalan, A., Ardalan, R., Coppage, S., Crouch, W. A comparison of student feedback obtained through paper-based and web-based surveys of faculty teaching. British Journal of Educational Technology. 2007; 38(6):1085–1101.
Avery, R.J., Bryan, W.K., Mathios, A., Kang, H., Bell, D. Electronic course evaluations: Does an online delivery system influence student evaluations? Journal of Economic Education. 2006; 37(1):21–37.
Bennett, L., Nair, C.S., A recipe for effective participation rates for web-based surveys. Assessment and Evaluation in Higher Education. 2010;35(4):357–365. http://pdfserve.informaworld.com/347850_751308601_913269474.pdf [Available online at:, (accessed February 2010).].
Bothell, T.W., Henderson, T. Do online ratings of instruction make sense?' In D.L. Sorenson and T.D. Johnson (Eds.), 'Online student ratings of instruction. New Directions for Teaching and Learning. 2003; 96:69–80.
Buchanan, T., Smith, J.L. Using the Internet for psychological research: Personality testing on the World Wide Web. British Journal of Psychology. 1999; 90:125–144.
Coates, H., Student engagement in campus-based and online educationUniversity connections. London: Taylor & Francis, 2006.
Coates, H., Tilbrook, C., Guthrie, B., Bryant, G. Enhancing the GCA National Surveys: An examination of critical factors leading to enhancements in the instrument, methodology and process. Canberra, Australia: Department of Education, Science and Training; 2006.
Cummings, R., Ballantyne, C., Fowler, L., Online student feedback surveys: encouraging staff and student useSanthanam E., ed. Student Feedback on Teaching: Reflections and Projections, Refereed Proceedings of Teaching Evaluation Forum. University of Western Australia: Crawley, Australia, 2001:29–37. http://www.csd.uwa.edu.au/spot/forum/forum_monograph.pdf [Available online at:, (accessed May 2010).].
Dommeyer, C.J., Baum, P., Hanna, R.W., Chapman, K.S. Gathering faculty teaching evaluations by in-class and online surveys: their effects on response rates and evaluations. Assessment and Evaluation in Higher Education. 2004; 29(5):611–623.
Fouladi, R.T., McCarthy, C.J., Moller, N.P. Paper-and-pencil or online? Evaluating mode effects on measures of emotional functioning and attachment. Assessment. 2002; 9:204–215.
Harvey, L. Student Feedback. Quality in Higher Education. 2003; 9(1):3–20.
Hmieleski, K., Champagne, M.V., Plugging into course evaluation. The Technology Source. 2000. http://technologysource.org/article/plugging_in_to_course_evaluation/ [Sept/Oct. Available online at:, (accessed March 2010).].
Hoffman, K.M. Online course evaluations and reporting in higher education'. In D.L. Sorenson and T.D. Johnson (eds), 'Online student ratings of instruction. New Directions for Teaching and Learning. 2003; 96:25–30.
Johnson, T.D. Online student ratings: will students respond?'. In D.L. Sorenson and T.D. Johnson (eds), 'Online student ratings of instruction. New Directions for Teaching and Learning. 2003; 96:49–60.
Layne, B.H., DeCristoforo, J.R., McGinty, D. Electronic versus traditional student ratings of instruction. Research in Higher Education. 1999; 40(2):221–232.
Leckey, J., Neill, N. Quantifying quality: the importance of student feedback. Quality in Higher Education. 2001; 7(1):19–32.
Nair, C.S., Adams, P., Mertova, P. Student engagement: the key to improving survey response rates. Quality in Higher Education. 2008; 14(3):225–232.
Nair, C.S., Wayland, C. Quality and evaluation: a universal system for a quality outcome. In: Engaging Communities: Proceedings of the Australian Universities Quality Forum. Melbourne, Australia: Australian Universities Quality Agency; 2005:127–130.
Porter, S.R. Overcoming Survey Research Problems. San Francisco: Jossey-Bass; 2004.
Powney, J., Hall, J. Closing the Loop: The impact of student feedback on students; subsequent learning. Edinburgh: Scottish Council for Research in Education; 1998.
Ravelli, B., Anonymous Online Teaching Assessments: Preliminary Findings, 2000.. http://eric.ed.gov/PDFS/ED445069.pdf [Available online at:, (accessed July 2010).].
Sorenson, D.L., Reiner, C. Charting the uncharted seas of online student ratings of instruction'. In D.L. Sorenson and T.D. Johnson (eds), 'Online student ratings of instruction. New Directions for Teaching and Learning. 2003; 96:1–24.