Inclusive practice in student feedback systems
Abstract:
Web-based or online surveys in general have a number of advantages in terms of the ease of administration, data collection and storage, resulting in financial and time savings. Despite these advantages, the usual shortfall to such surveys hosted on the web has been the generally lower response rates. This chapter initiates a discussion concerning inclusive practice in student feedback systems. It outlines a case of a research-intensive university which moved towards online administration of its surveys with the introduction of a new Survey Management System (SMS).
Introduction
Students are among the most important stakeholders for any university and yet for many years universities did not take seriously into account their views of the teaching and learning environment. Further, over the years, the student landscape has experienced significant shifts, creating fundamental changes to the student population. Students now display much more varied levels of academic, cultural and linguistic preparation for tertiary study. They also exhibit a more diverse range of expectations and needs.
With the growth of the quality assurance process in universities and an emphasis on the quality of teaching and accountability, there has been an increase in the implementation of effective stakeholder feedback mechanisms. Although paper administration has been the mode most often utilised in the past to elicit such feedback, the trend in universities is to opt for online administration. Hoffam (2003), in a study of US universities, suggested that around 45 per cent of universities are either actively engaged with online surveys, considering the use of online instruments or have planned to initiate online feedback in the next round of evaluations. When this study is compared to an earlier review reported by Hmieleski and Champagne (2000), the data suggested online usage for surveys in universities was hovering around just 2 per cent. A possible reasoning for this increase is that learning environments in universities are more flexible than they used to be, which in turn requires the evaluation systems to keep pace with the change. Students currently have the flexibility in how, where and when they study. In other words, the requirement to attend class is no longer a prerequisite in the new global learning environment.
Literature outlines numerous advantages of web-based surveys when compared to paper administration. A list of such advantages is outlined in Chapter 7 (see ‘Administrative considerations’).
Although there are many advantages which support the use of online administration, a key disadvantage that is often cited in the literature is that online responses typically elicit lower response rates than ‘in-class’ administration of surveys (e.g. Dommeyer et al., 2004; Porter, 2004). Literature cites numerous possibilities of why online response rates are low. This ranges from the fear of students concerning the possibility of tracking their responses, student apathy and technical issues (e.g. Avery et al., 2006; Dommeyer et al., 2004; Sorenson and Reiner, 2003). Researchers suggest many reasons relating to technical issues. These include the low levels of computer literacy among certain participant cohorts, slow connection speeds, low-end or outdated browsers, lack of accessibility to computers at convenient times for the students to complete and submit the surveys, and accessibility problems in particular for disabled students (Dommeyer et al., 2004; Cummings et al., 2001; Ravelli, 2000; Sorenson and Reiner, 2003).
A contributing factor to response rate, though not significant, is the participation of the visually impaired in online surveys. Although literature points to difficulties faced by the visually impaired in using the Internet and the development of tools to help in their accessibility (e.g. Macias and Sanchez, 2001; Murphy et al., 2007; Leporini et al., 2004), little has been reported on how institutions tailor their evaluation system to allow for the effective participation of these students.
However, more recent research suggests that low responses are generally due to the lack of engagement of stakeholders in the process (Coates, 2006; Nair et al., 2008). A variety of strategies have been explored in literature and include systematic reminder e-mails, ‘forcing’ students to complete surveys prior to online registration of courses or obtaining other information from the institution’s web pages and the possibility of enticements in the form of incentives to elicit greater interest from potential respondents (e.g. Coates et al., 2006; Dommeyer et al., 2004; Porter, 2004).
Generally, response rates are pivotal when survey results are discussed. A thorough discussion on the factors effecting and the importance of response rates is provided in Chapter 7.
In general, feedback from stakeholders is considered critical in a good-quality system. With this importance and the increasing demand for undertaking continuous improvement, the emphasis has been on obtaining feedback from a spectrum of activities in universities. A factor that has always been discussed at institutions is that, for evaluation data to be of value, response rates need to be sufficiently high to be representative of the stakeholder cohort. This chapter describes how the central quality unit within one large Australian research-intensive university identified a technical issue that potentially limited the responses of students who completed the semester unit (subject) evaluations via online surveys. The technical change was first applied to unit evaluation surveys and then expanded to apply to all online surveys hosted by the university’s survey management system.
Institutional approach to unit evaluation
The university described in this chapter is a large research-intensive and highly internationalised institution which is home to more than 55,000 students from around 130 countries. The diversity of the university’s operation is reflected in its activities across six Australian and two international campuses (in Malaysia and South Africa), and it offers many courses in partnerships in countries such as Singapore, Hong Kong and Indonesia.
Units or subjects are the vital ‘building blocks’ of the curriculum in any university. For this university, the importance of embedding a systematic way of monitoring units was identified as a major recommendation in the institutional self-review Still Learning in 2002 (Monash University, 2002).
The policy governing unit (subject) evaluation was developed in 1998 and revised in 2005. Two stages are identifiable up to 2005. Prior to 2002, unit evaluation was conducted mostly utilising an item bank system where academics created their own unit questionnaires from a selection of over 100 items in the item bank. This produced a system where academics took ownership of the timing of evaluation and the reports produced were usually in a singular aggregated format for individual units. The second stage, introduced in 2002, saw a shift of responsibility from the academic to the faculty. In this stage, faculties were required to design a common faculty-wide questionnaire and to conduct an evaluation of each unit at least every five years. This second stage saw a patchy uptake by faculties, resulting in a mixture of both processes in this period. This gave rise to a broad combination of questions which did not provide a way to benchmark or to monitor and improve units within the university. Further, the results of the surveys were not always available within the faculty for review.
In 2005, a new evaluation system was approved by the Academic Board, which had significant operational and design changes. These included:
![]() ten core items common to all unit evaluations across the university;
ten core items common to all unit evaluations across the university;
![]() the addition of up to ten quantitative items by a faculty in order to produce a report common to the faculty;
the addition of up to ten quantitative items by a faculty in order to produce a report common to the faculty;
![]() student evaluation to be undertaken of each unit each year they were offered;
student evaluation to be undertaken of each unit each year they were offered;
![]() results of the student evaluation of units posted on a common website for all staff and students to review;
results of the student evaluation of units posted on a common website for all staff and students to review;
![]() results from the evaluations to be systematically considered by faculties in each semester with reporting to a central committee on the improvements.
results from the evaluations to be systematically considered by faculties in each semester with reporting to a central committee on the improvements.
With this significant shift in policy and demand, the university invested sizeable resources in re-engineering the technology to back the increasing need for data in the monitoring stage of the quality life cycle. To facilitate the administration of the survey, the university’s central quality unit introduced a new Survey Management System (SMS), replacing the legacy system that used optical scanning technology. The new SMS system allowed for the first time either paper-based or online surveys for all units to be processed. The software utilised in the SMS was chosen to line up with the university’s commitment to inclusive principles as spelled out in the Inclusive and Practice Disability Plan:
The aim of the Plan is to achieve universal accessibility mainly by ensuring that all planning (including the physical, learning, teaching, research and IT) identifies and eliminates barriers to participation of all people including those who have a disability. Monash University (2004)
Discussion
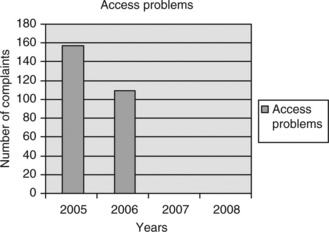
At the time of the implementation of the new SMS system at the university, web-based questionnaires for unit evaluation were produced in the Portable Document Format (PDF). This format allowed participants to view the survey instrument as a PDF document, while giving them the ability to fill it in without downloading. PDF formatting was inherent to the SMS, which was part of the commercially available tool introduced at the university. This type of format, although appealing in its presentation, was found to be ‘clumsy’ in its practical application, evidenced by the numerous issues that were raised by the students. In the first year of administration, 157 students or about 0.3 per cent of students surveyed took the time to lodge their dissatisfaction (see Figure 8.1). A similar number of students reported issues in the second year (108 students or just around 0.2 per cent of those surveyed). Anecdotal evidence by faculties suggests the numbers of students having difficulty accessing the PDF were significantly higher.
Further, students who were visually handicapped highlighted their inability to complete surveys online, although the software was one that had passed compliance with survey development for the visually impaired. A concern was raised by visually impaired students that the PDF format was not accessible when using screen readers and was not user-friendly. Visually handicapped students wishing to complete online surveys had to first identify themselves and, following this, an evaluation team member would provide one-to-one assistance to complete the evaluation. This was initially accomplished by reading the questions to the students, usually over the phone, and completing the online survey on their behalf. Later, surveys were customised to utilise screen readers. These approaches were individually-based solutions that required visually impaired students to identify themselves, thus compromising their anonymity and failing to support the principles of inclusive practice.
In general, students raised a numbers of areas of concern in accessing this type of survey. These included the unfamiliarity with PDF documents being fillable online, which resulted in many students downloading the form and trying to submit their responses. The following comment is representative of the concerns.
I am having trouble completing the online unit evaluations. I can open the PDF file, but once there I can’t select the options that I want. This is the second time that I have tried, so not sure what is wrong?
Furthermore, this difficulty was supported by a number of students forwarding a printed form of their response to the central quality unit to lodge their feedback.
The second concern related to incompatibilities of some versions of the browser used by the students to access the survey. To compound this problem, some areas of the university also had older versions of the browser that did not allow access for students, even though they were using university machines. The following comments are indicative of these concerns:
I am unable to click the response in the questionnaire. I am sure that I access the evaluation forms by using Internet Explorer 6.0 and Adobe Reader 7.0. I also set Adobe Reader to display PDF forms in the browser. Please help me. (Student 1)
I attempted to complete this form; however, I got an error message – something to do with my web browser. (Student 2)
Finally, the set-up of the web browser that required the PDF to be displayed within a browser window was raised by a number of students. To assist the students to correct the display, requiring them to adjust control panel settings, step-by-step instructions were sent to those with problems.
During the first two years of the surveys, these issues of accessibility were lodged repeatedly by students. The new evaluation process ensured that every student had the opportunity to provide feedback. As a result of these concerns, the survey platform utilised in the new SMS system was altered to deliver the online questionnaire in HyperText Markup Language (HTML) format, designed using a survey tool specifically developed to be compliant with the World Wide Web Consortium (W3C) accessibility standards. The tool was developed entirely within the university using freely available source code and only functionality that conformed to accessibility standards.
This change was trialled with visually handicapped students, prior to being introduced as the new platform for all surveys. Feedback from these student trials was positive, particularly in that it could be read using any of the screen readers available and was presented in a clear and logical format and, consequently, that it was easy to complete for these students. Working with an expert in accessibility standards, the system was designed to meet all requirements of W3C. This also included the design of a wide variety of question types, with each type being carefully assessed to ensure that it was fully accessible for all students.
Information from other Australian universities suggests that the change in technology illustrated in this chapter to include all participants in the process, especially those with disabilities, places the university at the forefront of applying inclusive practice in the evaluations area. All online surveys hosted by the university now bear the Web Content Accessibility Guideline (WCAG) Conformance logo in line with the W3C requirements.
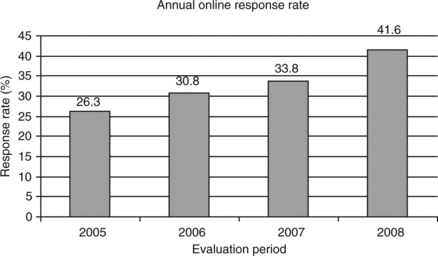
The change had two significant results. First, there were no complaints from students on using the online questionnaire (see Figure 8.1), and second, there has been a significant increase in web-based responses from 30.8 per cent to 41.6 per cent. Despite this, the overall survey response rate only showed around a four percentage point increase after the first year of implementation. A possible reason as to why the response rate did not increase more significantly was that students who had used the system prior to the change had not returned to complete the surveys the following year because of their negative experiences with the evaluation system. Although other factors (such as an effective communication strategy with the students, engagement of students and staff in the survey process and survey item design) play a part in the increase in response rate (e.g. Bennett and Nair, 2010; Nair et al., 2008), the contention of this chapter is that the change of the presentation platform had a positive impact to assist in the rise in response rate (see Figure 8.2) and is a factor that needs consideration in web-based surveys.
Concluding remarks
The results suggest that feedback from students relating to the tool that is utilised for surveys is critical to the success of online evaluations. This is in line with earlier studies that suggest surveys that are easily and readily accessible and easy to use are valued by students (e.g. Dommeyer et al., 2004; Layne et al., 1999; Ravelli, 2000). These studies further report that if students run into technology-related issues, or they have difficulty in navigating the system or do not understand how the system operates, they are less likely to complete the web-based surveys. This was apparent in the initial system that was implemented at the large Australian university, where students were reluctant to return to the site to complete the surveys when they had difficulty understanding and using the PDF format of the questionnaire. Further, it was also resource-intensive for the university’s central quality unit to resolve each issue raised by students on an individual basis.
The driving force for the change in the system was the realisation that students with disabilities, especially those who were visually impaired, were excluded from the evaluation process because of the incompatibility of the technology (screen readers) they were utilising to access these surveys. This limitation in the system also worked against the university’s desire to give all students the opportunity to provide confidential and anonymous feedback when surveyed.
This chapter has underlined the idea that all institutions have a duty of care to enable all their students to access and provide feedback to the institutional surveys, thus enabling an inclusive evaluation system that does not discriminate among its key stakeholders. Addressing the needs of all students would therefore further the progress of equity and fairness within the university community. The chapter has further highlighted the fact that any quality system employed at an institution must consider the effectiveness of the evaluation system that is employed at the institution. To this effect, it needs to take on board the feedback from its stakeholders and improve the services they provide by changing the process so as to accommodate the needs of all its stakeholders. The data from the university presented here suggest that students found a change of platform for web-based questionnaires in the institution user-friendly, which in turn had a positive influence on response rates.
In summary, a system that is inclusive of the needs of all stakeholders reinforces the notion that all stakeholders are of equal importance, which in turn sends a message of inclusivity in the feedback process.
References
Avery, R.J., Bryan, W.K., Mathios, A., Kang, H., Bell, D. Electronic course evaluations: does an online delivery system influence student evaluations? Journal of Economic Education. 2006; 37(1):21–37.
Bennett, L., Nair, C.S. A recipe for effective participation rates for web based surveys. Assessment and Evaluation in Higher Education. 2010; 35(4):357–365.
Coates, H. Student Engagement in Campus-based and Online Education University connections. London: Taylor & Francis; 2006.
Coates, H., Tilbrook, C., Guthrie, B., Bryant, G. Enhancing the GCA National Surveys: An examination of critical factors leading to enhancements in the instrument, methodology and process. Canberra, Australia: Department of Education, Science and Training; 2006.
Cummings, R., Ballantyne, C., Fowler, L., Online student feedback surveys: encouraging staff and student useSanthanam E., ed. Student Feedback on Teaching: Reflections and Projections, Refereed Proceedings of Teaching Evaluation Forum. University of Western Australia: Crawley, 2000:29–37 Available online at:. http://www.csd.uwa.edu.au/spot/forum/forum_monograph.pdf [(accessed February 2010).].
Dommeyer, C.J., Baum, P., Hanna, R.W., Chapman, K.S. Gathering faculty teaching evaluations by in-class and online surveys: their effects on response rates and evaluations. Assessment & Evaluation in Higher Education. 2004; 29(5):611–623.
Hmieleski, K., Champagne, M.V., Plugging into course evalaution. The Technology Source, Sept/Oct. 2000 Available online at. http://technologysource.org/article/plugging_in_to_course_evaluation/ [(accessed February 2010).].
Hoffman, K.M., Online course evaluations and reporting in higher educationSorenson D.L., Johnson T.D., eds. Online course evaluations and reporting in higher education. Online student ratings of instruction; 96, 2003:25–30.
Layne, B.H., DeCristoforo, J.R., McGinty, D. Electronic versus traditional student ratings of instruction. Research in Higher Education. 1999; 40(2):221–232.
Leporini, B., Andronico, P., Buzzi, M., Designing search engine user interface for the visually impaired. Proceedings of the 2004 international cross-disciplinary workshop on web accessibility (W4A), 2004:57–66 Available online at. http://portal.acm.org/citation.cfm?id=990668 [(accessed 20 August 2009).].
Macias, M., Sanchez, F., Improving Web accessibility for visually handicapped people using KAI. Proceedings of the 3rd International Workshop on Web Site Evolution, 2001:49–54 Available online at:. http://ieeexplore.ieee.org/stamp/stamp.jsp?tp=&arnumber=98878S&isnumber=21298 [(accessed 20 August 2009).].
Monash University, Still Learning: The Report of our Self-Review, 2002. Available online at. http://www.adm.monash.edu.au/cheq/reviews/still-learning/contents.html [(accessed February 2010).].
, Inclusive Practices: Disability Plan 2004–2008, 2004. Available onlilne at:. http://www.adm.monash.edu/sss/equity-diversity/disability-liaison/inclusive-practices-plan.html [(accessed 21 August 2009).].
Murphy, E., Kuber, R., McAllister, G., Strain, P., Yu, W. An empirical investigation into the difficulties experienced by visually impaired Internet users. Universal Access in the Information Society. 2007; 7(1–2):79–91.
Nair, C.S., Adams, P., Mertova, P. Student engagement: the key to imporving survey response rates. Quality in Higher Education. 2008; 14(3):225–232.
, Overcoming Survey Research Problems. S.R. Porter. Jossey-Bass, San Francisco, 2004.
Ravelli, B. Anonymous Online Teaching Assessments: Preliminary Findings. Available at: http://enc.ed.gov/PDFS/ED44S069.pdf, 2000. [(accessed July 2010)].
Sorenson, D.L., Reiner, C. Charting the uncharted seas of online student ratings of instruction’. In D.L. Sorenson and T.D. Johnson (eds), ‘Online student ratings of instruction. New Directions for Teaching and Learning. 2003; 96:1–24.