CHAPTER 3: BUSINESS IMPACT ANALYSIS AND RISK ASSESSMENT
These elements are really pivotal in a good BCMS. Without them, there can be no assurance that all potential interruption scenarios have been taken into account, nor that the resilience, response and recovery capabilities are comprehensive, and based on the true priorities of the organisation.
Business impact analysis
The simple premise of business impact analysis (BIA) is that the BCM arrangements for each activity should be commensurate with the impact of interrupting that activity. This section looks at what BIA is for, and how to conduct it.
What is BIA?
As its name suggests, BIA involves the analysis of the impacts sustained when activities are interrupted. Of course, there are many other types of impact and situations when they may be sustained, but, in the context of BCM, this is what BIA is.
In order to analyse these impacts, it is necessary to understand what we are looking for. When an activity is interrupted, there is likely to be a negative impact, perhaps not immediately, but after a certain period of time. In commercial organisations, that impact might conveniently be expressed in financial terms, but, elsewhere, other ways of measuring impact may also be required.
It is also usually the case that the longer the interruption continues, the greater the impact, so that each activity has a time-based impact profile. At a very basic level, it is then possible to see, and understand, the impact that would be sustained if some, or all, of an organisation’s activities were interrupted, regardless of the cause.
Figure 3 illustrates a simple, impact timeline, showing the equivalent financial impact for each of five different activities, should they be interrupted, at selected points along the timeline, starting from the Business as Usual (BaU) level of zero.
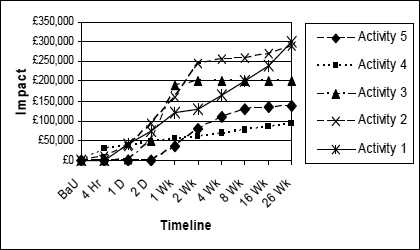
Figure 3: Impact profile 1
This sort of data can be very useful in revealing the relative importance, or criticality, of individual activities. It can also then be used to look at the cumulative impacts, for example, if the entire organisation were to be interrupted.
However, in many organisations, the interdependence and complexity of activities is such that analysis of these activities individually, is rather difficult to do, and very often the total impact is not the same as the sum of the parts, as you can see in Figure 4 .

Figure 4: Impact profile 2
Whilst the BIA can be useful in calculating the maximum impact, or loss, in the event of complete organisational interruption, its real purpose, in BCM terms, is to establish the relative priority for recovering different activities or business processes.
Non-financial impacts
Impacts that are not immediately identifiable as financial in nature, may carry more weight in some organisations than in others. Of course, for the majority of commercially-driven organisations, these impacts eventually have some financial impact, perhaps as customers gradually turn to other suppliers, or market confidence leads to a reduction in the share price.
In these, and other organisations, it is important to understand, and assess, all types of impact that interruptions might have.
Non-financial impacts might include:
- Reputational damage
- Reduction in levels of customer service
- Loss of accreditation or certification
- Environmental damage
- Reduction in corporate and social responsibility
- Corporate governance failure.
The relative weight of these impacts must be considered carefully in drawing up a standardised set of impact criteria. These criteria are essential in ensuring that assessments of the impact resulting from a range of interruption scenarios are objective, and not unduly skewed by any individual’s ideas about how critical particular activities may be.
The starting point is to establish a scale of impact levels;the most common approach in the context of BCM is a five-point scale. Against this scale, a broad definition for each level is needed, so that assessors can judge, as accurately as possible, how severe a particular impact is. The table in Figure 5 shows how this might result.
It is for each organisation to decide whether impact definitions, such as those in Figure 5, are suitable for it, though they are likely to be fairly close to the mark for the majority.
Level |
Name |
Definition |
5 |
Catastrophic |
Loss of business value that is liable to terminate the organisation’s existence |
4 |
Intolerable |
Loss of business value exceeding the organisation’s tolerance, but from which it is likely, eventually, to recover |
3 |
Major |
Major loss of business value |
2 |
Significant |
Significant loss of business value |
1 |
Minor |
Minor loss of business value |
Figure 5: Scale of impact levels
In practical terms, though, it may be more useful to translate these impact levels into more specific indicators, not least so that individuals with a narrower perspective on the organisation can select levels in terms that they more readily understand.
The table in Figure 6 shows an impact criteria table, with three different types of impact. This kind of table enables anyone conducting an impact assessment to assign an impact scale of between 1 and 5, in a number of different ways.
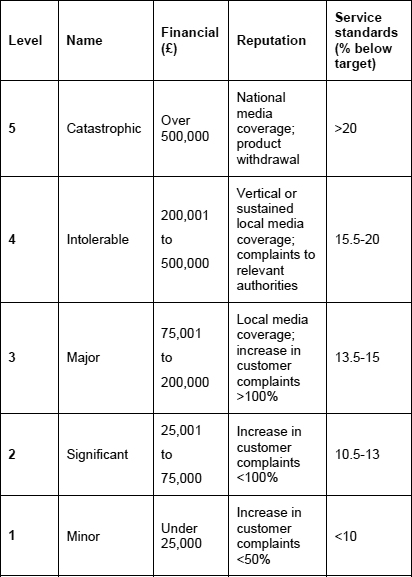
Figure 6: Impact criteria table
Figure 7 shows that applying these criteria to the example in Figure 3, would give a similar, though more granular picture, of the organisation’s time-based impact profile. The small version of the original is included for reference.
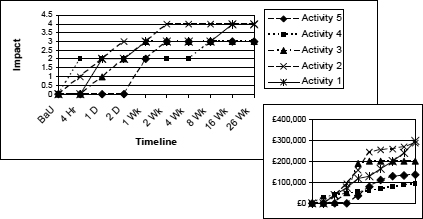
Figure 7:Impact profile 3
Impact treatment
In a case where there are a number of different impact types, the way in which impacts are treated should be standardised, so that it can be built into the data collection methodology.
The options for assessment include:
- Deciding whether a given activity is most sensitive to a particular impact type, and collecting only that data.
- Recording the highest impact from one of the types, at each point on the timeline.
- Recording impacts in all types, then choosing the highest during analysis.
- Recording impacts in all types, and then calculating a simple, or weighted average, during analysis.
It may be tempting to try to collect impacts of every type, at every point on the timeline, for every activity, but this needs to be balanced against the need to get the job done; to minimise the additional workload for otherwise busy people.
A simple and reasonably successful approach is to present the assessor with a table, showing the meaning of all the impacts, so that they can then choose one level at each timeline point. If the impact criteria table has been well constructed, it should not matter whether the chosen impact level is financial, for example, or reputational in scale.
Identifying the activities
This is perhaps the most challenging aspect of conducting a BIA. Having established some standardised criteria for assessing the impact resulting from interruptions to activities, surely one could simply give these to the people responsible for managing those activities, and let them make the best assessment? This may work in some organisations, but, more often, it immediately raises questions about what is actually being assessed. What are the activities, or processes, that are to be assessed in this way?
Many practitioners in BCM, and the Standard itself, suggest that organisations execute some activities which are critical, and others which are not. This binary approach to identifying activities is questionable, particularly when one considers the Standard’s definition of critical activities as:
...those activities which have to be performed in order to deliver the key products and services which enable an organisation to meet its most important, and time-sensitive, objectives.
The majority of organisations feature activities with varying levels of importance or criticality, and ‘critical’ is not an absolute term – some things are more critical than others.
So the question arises: Does one decide, first, which activities are critical, then assess the impacts arising from their interruption; or does one assess the impacts arising from the interruption of all, or most, of the organisation’s activities, thus establishing a scale of criticality of all processes?
A potential danger of the former approach is that certain activities which, if assessed, would turn out to be quite critical, are missed, because, in the absence of any analysis, they are deemed to be non-critical.
The starting point is therefore usually the scope, referred to in Chapter 2, which may have narrowed the focus of the BCM activity down to various operational parts of the organisation that are covered by the BCM programme, and therefore the BIA. However, there then has to be some classification of activities, or business processes, that can be assessed for impact.
This is individual to every organisation, and can be a major piece of work in itself. At this point, the temptation often arises to simply decide what the recovery priorities and requirements are for the various organisational functions, but it must be remembered that the Standard calls for the results of the BIA to inform the planning process.
There can be no standard way of identifying activities, but it makes sense to keep things as simple as possible. Some organisations operate a number of almost independent teams, departments or functions, that can be easily identified and analysed separately, but, in many others, these entities are interdependent, and all contribute to the same eventual products and services that the organisation exists to deliver.
If there is a rule of thumb, it is probably that one should start at the top of the organisation, and look at the main divisions or departments, to see whether each could be assessed for impacts as an entity, or whether it comprises many different activities that should be assessed individually. Working down through the organisation’s structure, it should be possible to find the highest, common denominator, which may well be at different levels between, and within, main divisions or departments.
Where physical processes are involved, the primary difference will usually be that they depend upon different resources from administrative-type activities. In a manufacturing business, for example, one might assess a complete production line, rather than one individual machine within the line.
This approach, based on the jobs that people or, in some cases, machines do, should result in the minimum number of assessments being required. It should also ensure that all the organisation’s activities are considered. Figure 8 illustrates one way of establishing an organisation’s activities, which can then be assessed for interruption impacts.
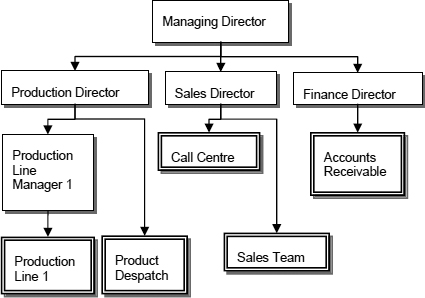
Figure 8:Organisational activities
In this rather simplified example, activities are indicated by a double-lined box. Defining activities in this context is both intuitive and reiterative. It is quite likely that, once an activity has been defined, analysis of the impact of it being interrupted, reveals that it would be much easier to assess it as two separate activities.
The importance of this becomes clearer when one considers the resource requirements for individual activities. Following an interruption, a team of people who execute a number of activities, might need to be operational within a short timescale, because of the criticality of one of their activities. The other resources required for this one activity, such as IT applications, telecommunications, information sources, and so on, would also be required in that short timescale. However, the resources required for other activities that the team performed, might not be required so quickly, because these other activities were not as critical. Higher or quicker availability of resources often means more cost, and cost-effectiveness is usually an objective in any BCM programme.
So, there is a balance to be struck between identifying a manageable number of activities on the one hand, and achieving cost-effectiveness of resource contingencies on the other.
The job of setting out what the activities actually are, may be done by one person, by a BCM team, or, indeed, by those responsible for the activities themselves. This, as with many other disciplines, will depend upon the nature of the organisation and how it is managed.
From the BCM practitioner’s point of view, it is desirable that managers of activities decide, and set out, what the activities are, though in many cases, they will need some rules and guidance from the BCM practitioner or co-ordinator.
Suppliers
Many organisations outsource some of their activities to suppliers or providers, often including activities that support products and services. These suppliers’ services should also be treated as activities within the BIA, since their interruption will have the same impact on the organisation, whether executed by the organisation, or by a third party.
Where this is the case, it will be important to establish a suitable, supplier assurance activity in respect of BCM (see Chapter 9).
Collecting the data
At the most basic level, this can be done by way of a spreadsheet, with a simple table into which impact levels may be entered, as in Figure 9.
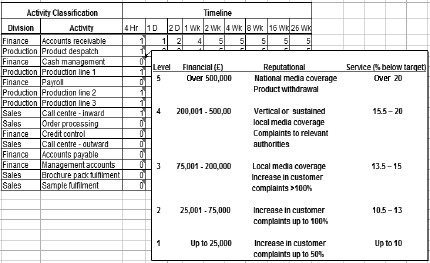
Figure 9:Simple BIA spreadsheet
In reality, of course, there would be considerably more activities to be assessed than this, but the example shows how impact assessments can be captured simply, and, most importantly, based on standardised criteria, so they are as objective as possible.
This collected data can then be analysed, and used to inform the strategy and response planning processes, by determining the time-frame for recovery of the activity(ies) in question, or of their outputs, dependent upon the strategy. BS25999 referred to this time-frame as the ‘maximum tolerable period of disruption’ (MTPD), and whilst this term is included in ISO22301’s list of terms, it isn’t used in the Standard itself. Nonetheless, it remains a perfectly valid term to describe, in the context of the new standard, the time-frame within which activities must be recovered, in order to prevent intolerably, high impacts accruing.
Impact data analysis
Figure 10 shows a graphical representation of the data from Figure 9.
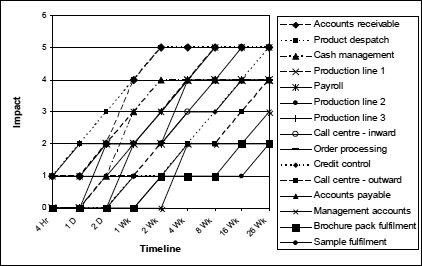
Figure 10: Impact profile 4
What can now be analysed is the impact profile, that is to say, the rate at which the impact for each activity increases over time.
If we were to set an impact threshold and apply it to all the activities in Figure 10, by drawing a horizontal line across the chart at the impact threshold level of 2, we would then be able to see what the MTPD was in each case. The results are shown in Figure 11.

Figure 11:Impact threshold applied
Now, by sorting this data in ascending order of MTPD, we can create a recovery timeline which can then directly inform the planning process, as shown in Figure 12.
This is precisely how the results of a BIA can be used to inform the strategy selection and planning processes, though it should be remembered that, in this example, the setting of the impact tolerance threshold at 2 is somewhat arbitrary.
If a threshold of 3 were to be tried instead, this would give the results shown in Figure 13.
What can be seen, is that the priority order is different between the two, which is because of the way that the impacts for each activity change over time.
The resulting timeline can now form the basis for a BCP. First, however, the availability of the resources required to support these activities must be established.
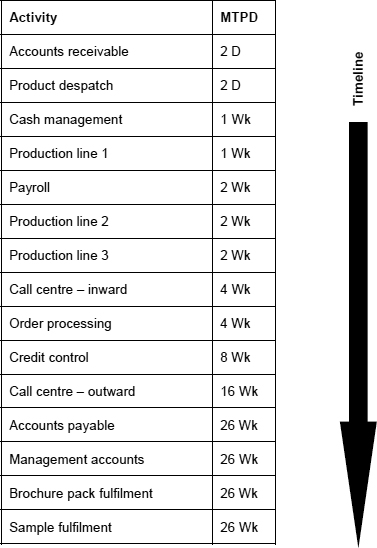
Figure 12: Recovery timeline 1
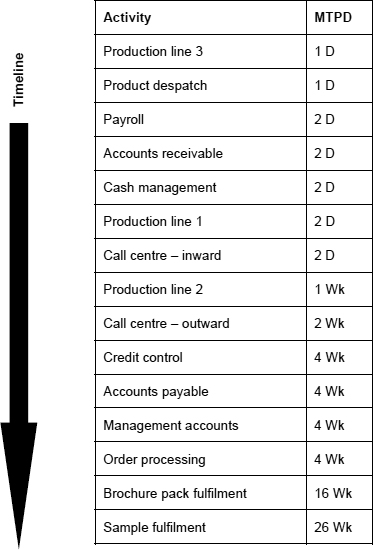
Figure 13: Recovery timeline 2
Recovery time objectives
The maximum tolerable period of disruption is based upon the impact resulting from interruption reaching a threshold, or maximum tolerable level. It may make sense, in many cases, to set an objective for partial, or complete, recovery of the activity in question that is within this MTPD timescale. For example, if a team of people are redeployed to a temporary location equipped with the resources that they need, it may take some time for them to reconcile information and make other preparations, before they are able to execute the relevant activity in more or less the usual way. Many organisations feel they would simply prefer to build some time contingency into their recovery plans, and, for these reasons, the recovery time objective (RTO) may be shorter than the MTPD.
Ultimately, ISO22301 stipulates a requirement for a ‘prioritised time-frame’, and the use of any suitable term, including RTO, should cause no concern.
Partial and full recovery
Whilst most organisations would prefer to recover their activities fully, as soon as possible after an interruptive incident, the extent to which this is achievable will depend upon many factors, and, in some cases, is simply not feasible. However, in order that DR and other contingency resources can be established, a statement of the minimum activity- or service-level, is an important consideration, otherwise the resources will drive the activity rather than vice versa.
This minimum, activity level is often unwritten, but, in order that the adequacy and effectiveness of the BCM arrangements can be verified, it should be stated wherever possible.
A statement of normal activity levels is also helpful, so that plans can provide clear information about the extent to which further recovery is required.
The standard does require plans to return from the temporary arrangements used in response, though it stops short of saying ‘to the original operational state’, referring instead to ‘support normal business requirements’. In the context of BIA, this reinforces the need to document normal levels of activity as the starting point, or baseline.
Tools
Depending upon the complexity of the organisation, it may be appropriate to invest in an appropriate IT tool with which to conduct BIA.
Here, caution is advised. At the time of writing, there are few tools available that have been developed specifically for this purpose, and which actually deliver the required results. There are numerous offerings available, and it is quite likely that one could find a spreadsheet template for sale that purports to be a comprehensive, BIA tool.
An appropriate tool should include, at least, the following functionality:
- Standard impact assessment criteria, and the ability to assess activities against them, without having to remember the definition of each level.
- Activity- or business-process records, in a variety of categories and subcategories.
- Ability to show interdependency between activities.
- Calculation and/or presentation of time-based impact profiles.
- ‘What if?’ impact tolerance modelling, presenting MTPD/RTO profiles based on different thresholds.
Other areas of functionality, applying to the resource planning element of ‘understanding the organisation and its context’, are discussed in Chapter 2. If a tool does not offer at least some capability to analyse the impacts, then one should ask whether it is worth the price, or indeed the investment in time to learn how to use it.
The role of insurance
In assessing the impact attributable to interrupting activities, it may be appropriate to consider the mitigating effect of business interruption insurance. Where there is a straightforward loss of gross profit resulting from an incident, this type of insurance cover would generally reduce that loss, which could lead to the MTPD being increased. Extreme caution is advised in this area, as insurance policy conditions may vary widely, and an organisation that does nothing to limit its losses in the event of an incident, may well find it difficult to achieve settlement of its claim.
More important than this, though, is the fact that virtually all business interruption insurance policies provide no indemnity against the loss of future business, resulting directly, or indirectly, from an interruptive incident.
Many policies may also exclude a variety of reasons for loss, such as failure of an IT system. In some cases, the failure of an IT system may bring the organisation to a halt operationally, thus losing gross profit in the process, and yet the business interruption insurance policy may not cover this type of interruption.
In the most severe cases, some loss of profit is inevitable, so insurance certainly has its place, but organisations should consider the relative value of BCM, as potentially a more cost-effective way of mitigating the losses more generally attributable to interruptive incidents.
Disaster recovery resources
It goes virtually without saying that organisations require resources to enable their activities to be conducted. For many, these would comprise:
- People
- Information
- Information processing tools
- A working environment.
For others, they might include:
- Handling and processing facilities
- Plant and equipment
- Distribution capability.
Many people have experienced a short-term loss of one or more of these resources, and so are familiar with the disabling effect it can have on conducting business as usual. All the same, there are many ill-conceived business continuity plans in existence that seem to take little account of the need to have these resources in place.
We should also distinguish between normal levels of activity, utility and comfort, and an interim recovery environment designed to enable a minimum, or perhaps reduced, level of activity to continue.
A sensible starting point is often to record, or map, the resources that are available to, and used by, each defined activity. This can be an endless exercise, particularly when one considers, not just the primary resources, such as computers, desks, telephones, information, vehicles and so on, but also the wide variety of lesser items, such as stationery, books and hand tools.
Decisions need to be taken on the categorisation of resources, so that those responsible for managing activities can clearly identify what they would need in the event of a disruption.
Again, this is specific to the organisation, but there are a number of fairly obvious categories that apply to the vast majority, including:
- Workspace
- ‘Seats’ (desk, chair, etc.)
- Meeting and presentation facilities
- Utilities and other services
- Computers or terminals
- IT applications and data
- Hard copy information, including unique documents
- Printers and other peripherals
- Stationery
- People
- Telephones
- Voice and data telecommunications capability
- Money and cash
- Vehicles
- Machines, plant and equipment
- Raw materials
- Consumables used in processing, packaging and distribution.
The simple logic here is that the resources, whether the original ones or replacements, need to be available for use when the activity in question requires them. Availability usually costs money, and there is a relationship between the level of availability (how much, how soon) and cost. This means that the identification of when replacement resources are actually required, is an important process.
As intimated previously, a very common mistake with BC planning is to set out what resources would be required in the event of a significant disruption, without putting in place arrangements that will ensure, as far as possible, that the required resources will actually be available, together with the procedures or instructions for invoking those resources.
Mapping and analysis
Depending upon the size, nature and complexity of the organisation, this can be a relatively straightforward process.
Mapping means assigning resources to activities that use them and, whilst BaU resource levels may be pertinent, it is the resources required to deliver the minimum acceptable level of activity that are most important. Figure 14 shows how basic resource information can be collected using a spreadsheet, together with a simple, data validation function that allows users to select only valid names for resources.
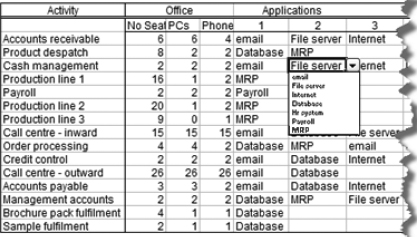
Figure 14: Basic resource mapping spreadsheet
Of course, desks, telephones, computers and most peripherals, are relatively generic items which can usually be obtained on a contingency basis from a suitable DR provider. The sort of resources that are used in processing, and the like, are not usually so readily available. In formulating the recovery strategy (see Chapter 4), it is generally important to capture relevant information about resources that would normally support these activities.
This information should be useful in establishing the availability of alternative resources, even down to the level of spare parts that might be required to get a processing or manufacturing facility running again after a failure.
Ultimately, the providers of resources, whether internal departments (such as IT, facilities management and engineering), or third-party providers, will need to be in possession of a list of recovery resource requirements, including timescales, with which to cost and then arrange their availability. Again, this may well be a reiterative process, as the cost of providing the resource availability required is identified as being too high, or outside the budget. In that event, one would ideally go back to the analysis of impact data and raise the impact threshold, so that MTPDs increase and, with them, the availability requirements for some, or all, resources. This approach effectively applies budgetary limitations evenly across the resource availability spectrum, and is likely to have the most even effect on activity recovery times. The principle behind this is that it is better to marginally increase the recovery timescale for all activities than to significantly increase it for one, or a small number, of activities.
More sophisticated modelling might be able to produce the optimal resource availability combination, but it is unlikely that sufficient data on the different levels and costs of resource availability would be available for this purpose.
Ultimately, this is an area where judgement and intuition, combined with the application of the principles, is likely to result in the most pragmatic solution.
Identifying resources
This is another area where judgement is required; at one extreme, one could list every single computer, monitor, keyboard, printer, and so on, as well as furniture, and all sorts of other resources supporting the activity. On the other hand, one could be too brief, referring, for example, to ‘the accounts office’ as a resource.
As ever, balance is required, and, for office or administrative resources, things are relatively straightforward. Referring to a ‘seat’, which means a desk and chair, possibly with a telephone and PC or terminal, will work for many organisations. If, however, different users have different specifications of PC, then it may be necessary to refer to ‘high’ or ‘standard’ spec PCs.
Keeping it generic usually makes the mapping and planning process simpler, but, ultimately, both the provider(s) of those resources, BaU and contingency, and the users, will need to understand exactly what is meant by a ‘high spec PC’ or a ‘35 CFM air compressor’.
A sensible starting point is the people or departments that provide the resources, typically IT, facilities, engineering, human resources, and so on. These people are usually well placed to set out the semi-generic descriptions of the resources that the organisation uses from day to day. Owners, or managers, of the activities can then state, or confirm, which items they actually depend upon, and with which ones they could deliver the minimum, acceptable level of activity.
Many resources, though, may have a ‘tolerance’ associated with them. That is to say that the activity in question would need the given resource, but that the activity could be recovered, or resumed, a specified amount of time before that resource is available. This may be important from a cost-effectiveness point of view, since, as we have already seen, availability usually costs money, and savings could be made if a resource that is not required immediately upon resumption of the activity, is made available later, reducing the cost of availability.
Conflicts
There are some fairly common traps to fall into when it comes to DR or resource contingency planning. Particularly in larger organisations, planning may be conducted in ‘silos’, so that one department or division assumes that a resource that is known to exist would be available to it as a contingency. However, at the same time, another department may make the same assumption. These assumptions may be accidentally safe, but, unless all the assumptions used in BC planning are tested, the plans themselves cannot truly be considered robust.
This is an area where computer-based tools, discussed in the next section, can make a very valuable contribution, particularly if they are collaborative in nature.
Tools
We have already looked briefly at tools in the context of analysing impacts, but it generally makes sense that any tool should also be capable of analysing the resource requirements to respond to the contingency.
Ideally, the tool would be capable of presenting a comprehensive schedule of contingency resource requirements, showing conflicts and gaps, and should also have the ability to model variations in availability levels against costs. It should be able to do this for the entire organisation, as well as at division, department or other structural level, and to consider the relative robustness of resources shared between physically separate sites.
Again, at the time of writing, there is no known tool available that provides this level of functionality. All the same, at the opposite end of the spectrum from simple templates purporting to be suitable tools, no doubt some providers of enterprise-level software would at least claim to be able to provide this sort of functionality within their products. IT Governance Ltd (www.itgovernance.co.uk) says that it is developing just such a tool, but it was not available for review, or testing, at the time of finalising this book.
Risk identification, assessment and management
What is risk?
There are many books, articles, papers and opinions, written about risk. In every, single thing that all of us do, all the time, there is a risk that things will go worse than we had hoped or expected.
A risk comprises two things: the likelihood that an unexpected, or undesirable, event will occur, and the negative impact likely to be experienced if it does.
The widely accepted definition of risk is:
Risk (score) = Likelihood (%) x Impact
To illustrate this, let us look at a well-known example of Chance (see Example 2).
Example 2 illustrates the practical value of quantifying a risk, rather than assessing it intuitively – the results are often different. Please see the Introduction for an interpretation of the patterns used in place of colours in the printed version of this book.
Example 2: Risk, likelihood and impact
A bet of £2.00 on horse A, at odds of 5:1, would result in winnings of £10.00. Odds of 5:1 (against winning) mean that the likelihood of the horse winning the race is 20%.
Similarly, a bet of £4.00 on horse B, at odds of 5:2, would also result in winnings of £10.00. Because this horse is 40% likely to win the race, many of us would be prepared to risk more money for the same winnings.
But looking at the negative aspect of this risk, the likelihood of losing on horse A is 80% and the impact would be £2, and the likelihood of losing on horse B is 60% and the impact would be £4.
These risks are represented in Matrix A, below:
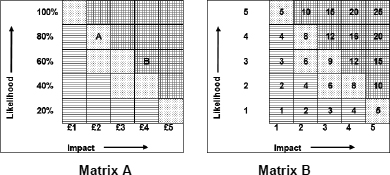
However, if we look at the accepted definition of risk, where risk = likelihood x impact; risk A is £1.60 and risk B is £2.40. It is worse, or higher, than risk A. This corresponds with a typical, risk scoring matrix (Matrix B) where, on impact and likelihood scales of 1 to 5, the highest risk score is 25 and the lowest is 1. In these terms, risk A would be scored at 8 and risk B at 12.
Risk appetite (willingness to take a risk) depends, to some extent, upon whether we have to perform the risky activity ourselves. In the example of betting on a horse, most of us do not gamble for a living, so it does not matter if we do not do it. But in the organisational context, be it a commercial business or, perhaps, a public sector organisation, it does matter if we do not do what we are there to do.
This is where we should start to look at the different types of risks that organisations face.
Example 3 concerns a property developer who buys houses, improves them, and then sells them.
Example 3: Operational and strategic risks
The developer faces core business risks: that a given house does not increase in value as expected, and, when sold, does not generate the required profit, or even makes a loss.
It also faces operational risks, such as a building contractor going out of business, or a material supplier ordering the wrong materials, extending the project completion time. It is relatively easy to see, in this example, that the operational risks amount to business interruption or business continuity risks. But to suggest that a bad purchase, which also makes a significant impact, is a business continuity risk, would almost certainly be wrong. These sorts of risks are usually described as ‘speculative’ risks; the sort of risk from which either profit or loss can occur. The type of risks that are the proper subject of BCM are the ‘non-speculative’ risks, the risks from which only loss or harm can follow. It is this approach that is reflected in the spirit of the Standard.
Practical operational risk management
As we have seen, the positive aspect of speculative risk really amounts to doing what the organisation is there to do. From a BCM perspective, we need only consider the negative aspects of these risks, the non-speculative risks, which is why we are looking at the likelihood of an unwanted event and negative impact, if it occurs.
All organisational activities carry a variety of risks – arguably more so in the case of commercial organisations. Risk management though, is not particularly scientific. It is simply the case that activities may have vulnerabilities that may be exploited by threats, which, should they materialise, will give rise to some negative impact. These really are the key words of risk assessment, and the Standard also refers to the risk assessment approach set out in ISO/IEC 27001:2005
We have already looked at a numerical technique for scoring risks; however, in order to conduct risk management at the organisational level, a structured approach is required.
Risk identification
In the context of BCM, the first step is to identify the risks of business interruption, which the policy will define. We will see later the importance of the objective assessment of risk, and this is also facilitated by the development of a risk register, which will be discussed later in this chapter.
The risk register is a sensible repository for business interruption risk information, our area of interest here, though it can also be used for any type of risk.
Depending upon the nature, size and complexity of the organisation, the risk register may be a simple list of risks that have been identified, and which can subsequently have attributed to them an objective assessment of the severity of that risk.
Essentially, one or more individuals have got to consider the organisation, and identify things that could go wrong, that fall within the scope of BCM and would lead to an interruption of the organisation’s activities. These risks may conveniently be categorised in a number of ways, including:
- Major incidents – fire, explosion, flood, structural collapse, terrorist acts, including chemical, biological, radiological and nuclear (CBRN) contamination.
- Resource failures – utilities, information systems, telecommunications, supply chain, processing facilities.
- Environmental – extremes of weather, gas leaks, other contamination, infestation.
- Denial of access – security incidents, legal disputes, access closures, accident or crime investigations.
- Civil emergencies – pandemic influenza or other disease, civil unrest.
- Product compromise – deliberate or accidental contamination, extortion.
There are likely to be more risks of business interruption, depending upon the nature of the organisation, its customers, suppliers, location, markets, and so on.
Risk identification should be as comprehensive as possible; ideally every risk that the organisation faces should be identified. However, there is no guaranteed way of identifying every risk, not least because there are usually so many. Those involved in identifying risks have to come up with things that could go wrong, and that would then make a significant impact on the organisation – at least to the lowest level on the standardised impact scale.
Techniques for identifying risks include the following:
- Questionnaires
- Brainstorming workshops
- Building and site inspections
- Input from other management systems, such as quality, environmental and security
- ‘Whistle-blowing’ policies
- Use of third-party assessors.
There can be no guarantee that every single risk that an organisation faces has been identified, but the spirit in which this should be approached, is one of ‘best endeavours’ and reasonableness. So, if you make a proper effort to identify every risk, and simply miss something because no one thought of it, then, from a corporate governance or audit point of view, that is probably acceptable; nobody should be accused of negligence.
Scope
BCM is widely understood to be a discipline that protects the organisation against the impacts of unforeseen incidents and events of an operational or, perhaps, physical nature. The Standard emphatically focuses on products and services, which means that the BCMS should deal with the organisation’s ability to continue delivering its products and/or services.
The inference from this, is that risks posed by threats that, although they might adversely affect the organisation, would not compromise its ability to continue delivering products and/or services, should not be included in the scope of risk assessment, or of BCM generally.
However, it must ultimately be for the organisation to decide if certain risks, whether operational, financial, strategic or anything else in nature, should be controlled to some extent by the BCMS and the BCM programme.
The vast majority of organisations exist to provide products, services or both, so the Standard’s emphasis on these is not unreasonable. On the other hand, financial threats, for example, could also pose risks to the organisation’s ability to continue delivering products or services.
A company might supply a certain product to a major customer, as well as some smaller ones. If the major customer stopped demanding that product, this could result in the organisation then not being able to supply the product to the smaller customers, because of cost escalation or component shelf-life. In that case, the risk is not truly operational in nature, but it would, nonetheless, have an adverse impact on the continued provision of products.
Each organisation should decide upon its scope for BCM and for risk identification in this context. Importantly, the inclusion of non-operational risks should not mean that its BCMS cannot meet the requirements of good practice and of the Standard.
Custom and practice
In the context of business continuity, we are dealing principally with the organisation’s ability to execute its normal functions in an operational sense – its operational risks. Other risks, strategic, commercial or business, that are also vulnerable to threats, are less likely to fall within the scope of BCM, but, most importantly, the BCM policy should set out which risks are being controlled wholly, or in part, by BCM.
ISO22301 defines risk as ‘effect of uncertainty on objectives’, but does go on to add that it is often expressed as a combination of consequences and the associated likelihood.
If the occurrence is more likely, we consider the situation more risky. If the impact is greater, we also consider the situation more risky. We can, therefore, consider a risk as the product of likelihood and impact; this is widely adopted as a sound approach to risk assessment.
Threats
Threats are an essential component in risks as, without them, the risks do not really exist. In the process of identifying risks, we have already identified the principal threat; this can often lead to the assessment of similar threats, as well as other activities that are vulnerable to the same threat. This is one of the ways in which brainstorming sessions often work quite well.
What needs to be established about a given threat is how likely it is to occur – its likelihood. In the examples earlier in this chapter, we looked at percentages of likelihood and the application of these to a scale of 0 to 5. But any scale of likelihood can be used if desired; it is a question of balance between accuracy and the workload required to achieve it.
The risk matrix also featured earlier in this chapter, which uses likelihood and impact scales of 1 to 5, is widely used, because experience indicates that it achieves a reasonable balance. Scales of 1 (or 0) to 100 could be used, but they would result in a large matrix, and it is doubtful whether much would be gained from this approach.
In some cases, it may be appropriate to consider likelihood in forms other than percentage. The frequency of occurrence may be considered so, just as different forms of impact are considered. A similar approach may be taken with likelihood, as in Figure 15.
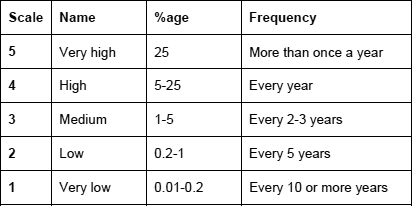
Figure 15: A typical likelihood scale
There is no scientific relationship between the percentage and frequency levels. It is a matter of judgement for each organisation to set their own set of criteria, but the activity should provide objectivity, as every threat is being assessed in the same way. ISO27001 refers to ensuring that risk assessments are ‘reproducible’, and this concept should also apply to the BCMS risk assessment. In other words, if a risk assessment is repeated by someone else, it should give the same results as before.
Multiple threats
In some cases, an incident could be caused by one of a number of threats, or by a combination of them.
Example 4 uses the example of a large tree that is next to a small office building.
Example 4: Multiple threats
There is a risk that the tree might fall, putting the office building out of use for some time. But the reasons that the tree might fall are really the threats. These reasons might include: very strong winds, prolonged, heavy rain, disease, being felled by mistake, and being struck by a large vehicle.
Each of these threats would exploit the same vulnerability: the fact that the tree is wooded and rooted in the earth.
Here, we are looking at five separate risks, because the likelihood that any of these threats will materialise is likely to be different for each. However, we can also combine the probabilities associated with each threat, because the result is effectively the same.
The likelihood (L) that the tree will fall on the building can be expressed as:
L = Lw + Lr + Ld + Lf + Lv
where the suffixes represent each of the threats listed above (wind, rain, disease, felling, vehicle).
If the likelihood of each threat materialising were 2%, the likelihood of the tree falling would, therefore, be 10%. This is, of course, only relevant if the organisation, or some of its activities, are vulnerable to the tree falling.
On the other hand, if the tree could only fall if all of the threats were present, then the likelihood would be expressed as:
L = Lw x Lr x Ld x Lf x Lv
which, in this case, would be 0.00000032%.
The likelihood of this event occurring is below even the lowest level on the scale in Figure 15 (0.01-0.2%), so Example 4 would fall outside the scope of the risk assessment.
Risk assessment
To assess risks, therefore, we must assess the threats against the organisation and its activities, and the extent to which they are vulnerable to these threats.
The most, basic approach to risk assessment is simply to judge whether a situation is of high, medium or low risk. This is rather subjective, in most cases, as it depends, firstly, upon the view of an individual about how likely it is that something (the threat) will happen – in other words, the likelihood. Secondly, it depends upon the individual’s assessment of what the impact of that threat is likely to be;this, whilst less subjective, is nonetheless open to a certain amount of judgement.
We have already looked at the definition of risk and the likelihood of a threat materialising. A similar approach is required for assessing impact. What is required here is a set of standardised assessment criteria, such as can be found in Figures 5 and 6.
The risk assessment process consists, in applying impact and likelihood scales against each identified risk, to result in a risk ‘score’.
The risk matrix
Example 2, earlier, contained the commonly-used 5 x 5 risk matrix. Each square contains a numerical value, or ‘score’, the product of the impact multiplied by the likelihood.
We have seen how conveniently scales of 1 to 5, for example, can facilitate different ways of looking at both impact and likelihood, so that all risks can be compared with each other.
Figure 16 gives a tabular view of an example in which eight different risks have been assessed using a standard set of likelihood and impact criteria, with scales of 1 to 5.

Figure 16: Assessed risks
Figure 17 shows the same results, sorted in order of their scores. So, it is then relatively easy to select the most serious risks, and deal with them.
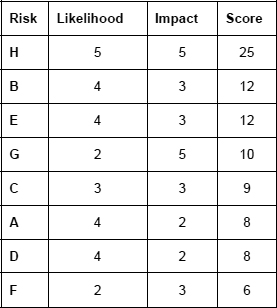
Figure 17: Assessed risks, prioritised
But, a more sophisticated way of presenting this information would be to continue the use of the risk matrix, which, without any colour coding, would look like Figure 18.

Figure 18: Risk matrix 1
Even in this format, we get a reasonable picture of which risks are the most severe, but, as we have seen earlier in the chapter, the use of coloured or patterned zones provides a much better visual representation, as in Figure 19.
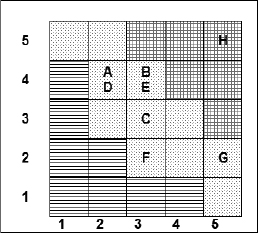
Figure 19: Risk matrix 2
There is no absolute standard for what is a low, medium or high score; on a scale of 1-25, it seems reasonable to suggest that 1-4 is low, 5-12 is medium and 13-25 is high.
Risk appetite
In the context of BCM, risk decisions are not usually about whether to engage in a particular activity, though in some cases a proper, risk assessment exercise may reveal an unduly, risky activity which has escaped management’s attention, but about whether to invest in better risk controls.
An organisation with a very high risk appetite, would, after conducting its initial risk assessments, simply accept all the risks, as they are to save money on risk controls expenditure.
This risk matrix is one commonly used in risk management, though the ‘grainy’ diagonal risk bands of red, amber and green (the RAG classification), or the corresponding patterns, are a matter of judgement and choice. The important decision is the one which determines the organisation’s risk appetite – the level of risk which, as a board, they are prepared to tolerate. If the Board decides that it can tolerate all risks that fall into the green area, it would not seek to introduce controls to limit the impact of those risks.
Controls (usually defined simply as countermeasures for risks) are applied to mitigate a risk, to reduce either the likelihood, or the impact of an identified risk, in such a way that it comes below the level of risk acceptance. In BCM terms, the treatment of risks through the BC planning process, should reduce what is called the residual risk (the risk that remains after treatment), to a level that is acceptable to the Board.
Interestingly, if one were to divide the three bands equally, or, at least, to the nearest whole number, so that low is 1-9, medium 10-17, and high 18-25, the resulting matrix would be as shown in Figure 20.
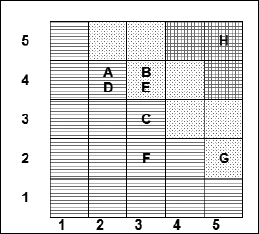
Figure 20:Risk matrix 3
In many respects, it does not matter where the red, amber and green zones are. What is important is, firstly, that risks with the same score should be treated in broadly the same way, and that, secondly, the Board approves the risk acceptance criteria.
Risk analysis
In most organisations, the use of the risk matrix described above will soon become impractical for individual risks, as more and more risks fall within the same square on the matrix. This is where the risk register, mentioned earlier in this chapter, becomes extremely useful.
The risk register is a widely used and accepted approach to risk management. It is a list of identified risks, with information about each, which may include:
- Nature of risk (including threat, vulnerability and impact)
- Likelihood
- Impact
- Risk score
- Findings – narrative information about the risk
- Current controls and their effectiveness
- Proposed controls
- Previous assessments.
The risk register is, arguably, the best way, not only of maintaining records about risks, but also of ensuring objectivity and consistency of treatment.
At a basic level, a risk register can simply be a list of risks, with associated assessments and scoring. It could be in the form of a spreadsheet, providing more functionality in terms of calculating, sorting and filtering data. At higher levels, it could be a powerful IT application capable of generating complex and comprehensive reports, and, perhaps, modelling data to determine optimum risk control activity.
An example of a spreadsheet-based risk register can be found in Appendix 3.
The risk register should be capable of some simple analysis to enable the prioritising risks for control, and to provide information for reporting purposes, so that the governing body is made aware of the organisation’s risk exposure.
Risk control and treatment
Having identified and assessed all of the risks that fall within the defined scope, and, possibly, created a risk register, the organisation is presented with a reasonably, comprehensive picture of how exposed it is to operational risks, and business interruption risks in particular.
It is a good idea to develop a policy in respect of risks, so that resources for controlling them can be applied in a systematic way.
Having decided upon its risk acceptance criteria, and a classification of, say, high, medium and low (risks that are below the risk acceptance threshold), the policy could be as follows:
- Red risks must be reduced by way of controls within three months, so that they become amber (or green) within six months.
- Amber risks must be reviewed monthly and their controls (if any) also reviewed for effectiveness.
- Green risks must be reviewed every six months to ensure that they have not moved above the risk acceptance threshold.
Risk controls are simply measures that can be implemented in order to reduce the likelihood, or impact, of an event. They could be something as simple as a written procedure aimed at preventing mistakes, or something much more physical, for example, a flood-prevention or automatic fire-extinguishing system.
Risk controls may also be financial in nature, such as the insurance policies mentioned earlier in this chapter, or provisions in the profit and loss account.
The ‘4 Ts’ approach to risk management controls uses the words: Tolerate – Treat – Transfer – Terminate.
Apart from the dubious credibility of lists of things that all begin with the same letter, one should also consider the practicality of these options. This approach is mentioned here more to acknowledge that it exists, than to promote it.
Clearly, if a risk is deemed intolerable, then ‘tolerating’ it is, at best, counter-intuitive. At the other end of the scale, ‘termination’ really means terminating the activity, rather than the risk;this may, in exceptional circumstances, be appropriate, but, generally, some control or treatment is likely to be the appropriate response.
Few organisations have either the budgetary capacity, or the management resource, to be able to control every single risk, and there must always be a level of tolerance of risks.
Preventative and curative measures
The adage ‘prevention is better than cure’, is generally true, but there are, of course, a great many threats in existence. Preventing them all from occurring is beyond the resources of the vast majority of organisations.
Some threats or incidents can be prevented – for example, the use of a firewall to prevent an attack on the IT system.
Such controls are called preventative controls. But other situations require a curative, or corrective, response, should they happen. Let’s look at the example of a food manufacturing company (Example 5).
Example 5: Food manufacturer
This company uses a large quantity of mains water, on an almost continuous basis. Historically, the water supply has always been there, apart from the odd incident where some maintenance or construction work has interrupted the supply for a short time.
But, if the water supply were to be cut off for several weeks, the company simply could not operate, and would sustain an enormous financial impact.
There are a number of reasons why the supply could be cut for a prolonged period, and, in many circumstances, it may be possible to procure water in other ways.
The company’s strategy now includes the potential use of a mobile water services provider. These companies are licensed to draw mains water from around the UK, and often provide this type of service for major events, where a mains supply does not exist.
In the event of the food manufacturer’s normal mains supply being cut off, a mobile water services provider could supply, by tanker, sufficient water to keep the manufacturer going.
It would take some time, perhaps a couple of days, to establish this interim supply, but the company’s BCP is now built around that knowledge.
The planning process also includes some minor modifications to the water pipework, so that, should it be required, the mobile supply could be connected without delay.
This is a curative (or corrective) control which would incur some cost if invoked, but this additional cost may well be covered by business interruption insurance, and, in this case, would be very much less than the eventual financial impact of letting customers down.
The risk management process
In simple terms, risk management involves:
- Identification
- Description and classification
- Recording
- Assessing
- Application of mitigating controls
- Management review
- Reporting.
We have already looked at the first five of these elements, which may be described as the ‘active’ parts of the process. However, the majority of organisations, and all those seeking certification under ISO22301, also require a management review and assurance process, which is referred to in Chapter 2.