Aside from formatting, our report is still missing something. Remember that what we want to see is a distribution of sales value among the territories. The bars do not really tell that story. We want to see the percentage distribution.
Let's do just that.
Select the bar, and then right-click on it to display the Series Properties context menu. Select Show Data Labels as shown in the following screenshot:

When the label appears on the bar, select and right-click on it to display its context menu. Select Series Label Properties as shown in the following screenshot:

On the Series Label Properties dialog box, click on the expression button next to Label data drop-down textbox, and enter the following expression:
=Fields!TotalSales.Value/Sum(Fields!TotalSales.Value, "ds_DataBars")
Please take note of the parameter ds_DataBars in the expression. That is the name of your report dataset. If you have a different name for the dataset, use that instead.
Now, if you click on OK, a Confirm Action dialog box is displayed asking you if you want to set the UseValueAsLabel property of the Series Label to False:

By clicking on Yes, we're essentially telling the report designer "yes, we want to use this expression instead of the value of the field (SalesTotal) as the label".
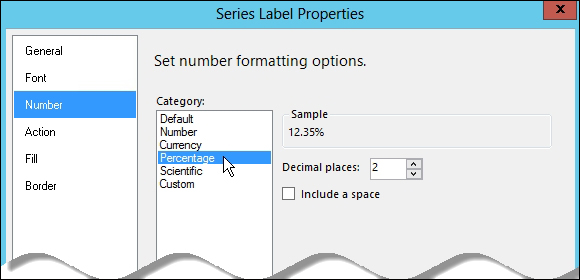
Format the value of our expression as a percentage by selecting Percentage from the Category drop-down list:
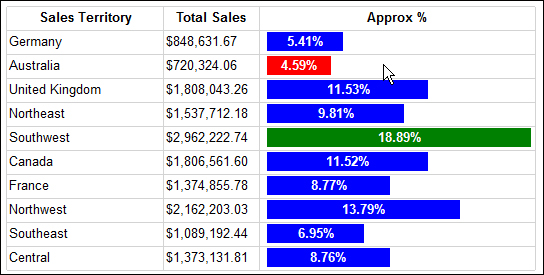
After a few format settings, the report now looks something like the following illustration, showing the percentage of each sales territory against all other territories: