
In the theme and data visualization options, we can set the criteria of aggregation we want for our map, and also the color rule. We can change both on the report designer if we decide to change the aggregate or color later.
- Select the Generic theme.
- For the Field to visualize option, select [Sum(LineTotal)] from the drop-down textbox.
- Select Green-Yellow-Red for Color rule.
- Select the checkbox next to Display labels; and for Data field select #STUSPS, which adds state code labels on the map as shown in the following screenshot:
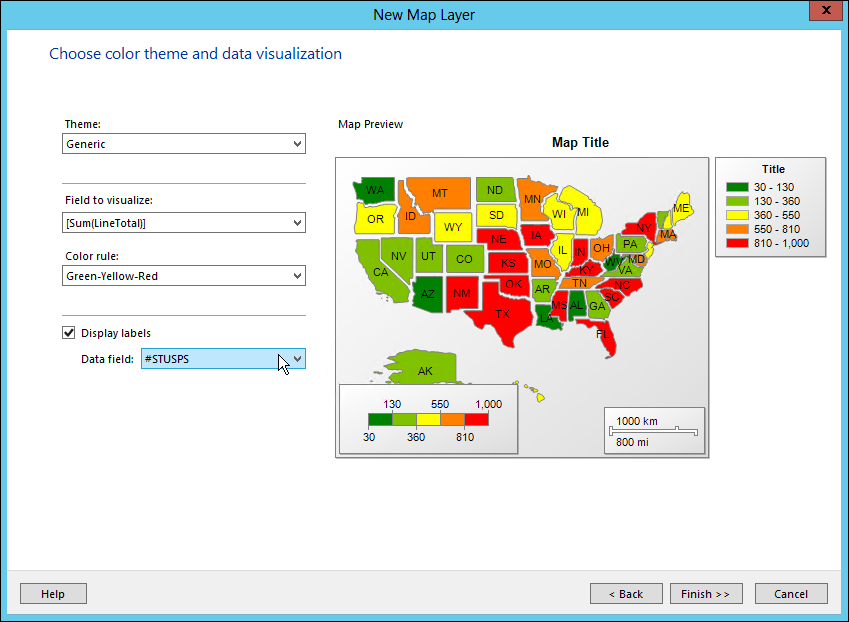
- Click on Finish when done.
..................Content has been hidden....................
You can't read the all page of ebook, please click here login for view all page.