
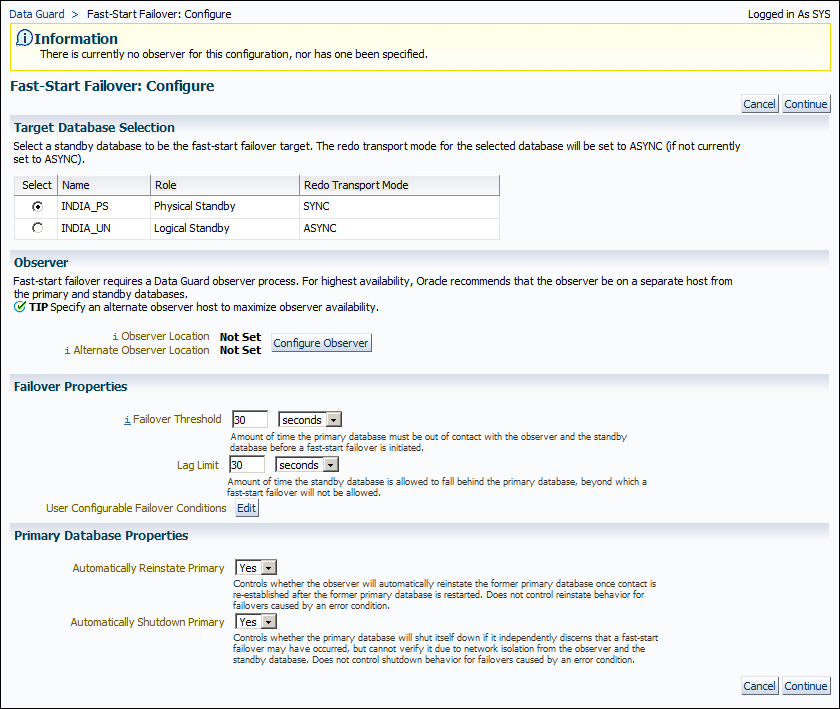
- The fast-start failover feature, which can be used for automated failovers in standby databases in the case of a primary database outage, can be enabled and disabled using Cloud Control. On the Data Guard Administration home page, in the Overview section click on Disabled in the Fast-Start Failover field. This will enable us to access the fast-start failover configuration page. At the top of the page, it's indicated that there's no specified Observer for the Data Guard configuration. Select the standby database that will be the fast-start failover target, and then click on Configure Observer.
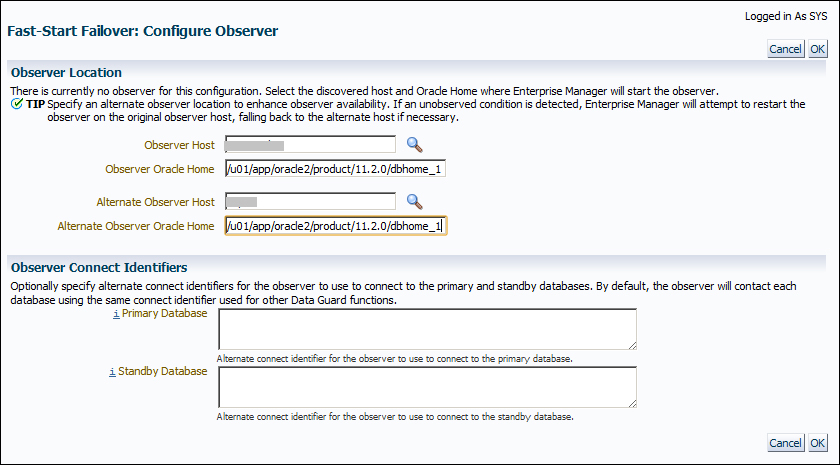
- Fill the observer hostname and Oracle Home information for the primary and alternate observers. If a problem on the observer is detected, Enterprise Manager will restart it on the primary observer host and fall back to the alternate host when necessary. (We can optionally specify connect identifiers for the primary and standby databases.) If not, the observer will use the connect identifiers used in the Data Guard configuration. Click on OK to continue.
- We'll return to the fast-start failover configuration page. At the bottom of the page, we'll see the Failover Properties and Primary Database Properties sections.
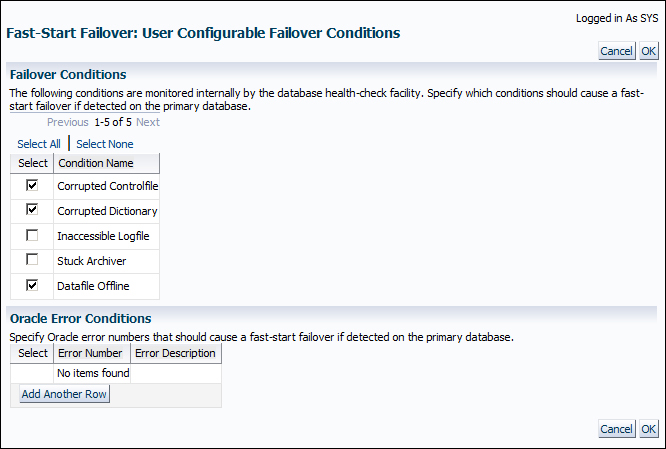
There are two properties in the Failover Properties section; they are set to 30 seconds by default, but can be changed. The Failover Threshold property is the amount of time that the primary database must be unreachable to initiate the failover, and Lag Limit is the maximum lag between the primary and standby databases, beyond which a fast-start failover will not be allowed. Now click on Edit next to User Configurable Failover Conditions. We're able to specify conditions that should cause a fast-start failover if detected on the primary database in this page. Click on OK to apply any changes and go back to the fast-start failover configuration page.
- Check all the fast-start failover settings and click on Continue. The following steps will require OS credentials to connect primary and alternate observer hosts.
- Now we must enable flashback logging on the primary and standby databases if it has not yet been enabled. We need to specify the Flash Recovery Area path, Flash Recovery Area Size, and Flashback Retention Time if flashback logging is not enabled. If it's enabled, we can see the current values. Specify the values and click on Continue.
- The last page will request a confirmation about enabling flashback logging, starting the observer on the specified host, and enabling a fast-start failover. Click on Yes to continue.
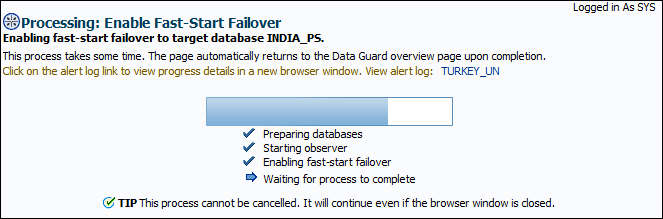
- We can see the progress as shown in the following screenshot. If it is accomplished successfully, we'll see the message, The fast-start failover mode has been successfully changed. Also, the fast-start failover status will show Enabled to INDIA_PS and the observer hostname will appear on the Data Guard Administration home page.
We've seen which properties of Data Guard can be changed with the Enterprise Manager Cloud Control interface. We've also examined the steps and options for enabling a fast-start failover using Cloud Control.
Now enable and disable the real-time query (Active Data Guard) option on the physical standby database using Cloud Control. At the same time, check the standby alert log file to track the statements run on the database.
Enterprise Manager Cloud Control offers a separate screen to monitor Data Guard performance. We can access this screen by clicking on Availability and then on Data Guard Performance on the database home page. Here's a screenshot of the Data Guard Performance page:
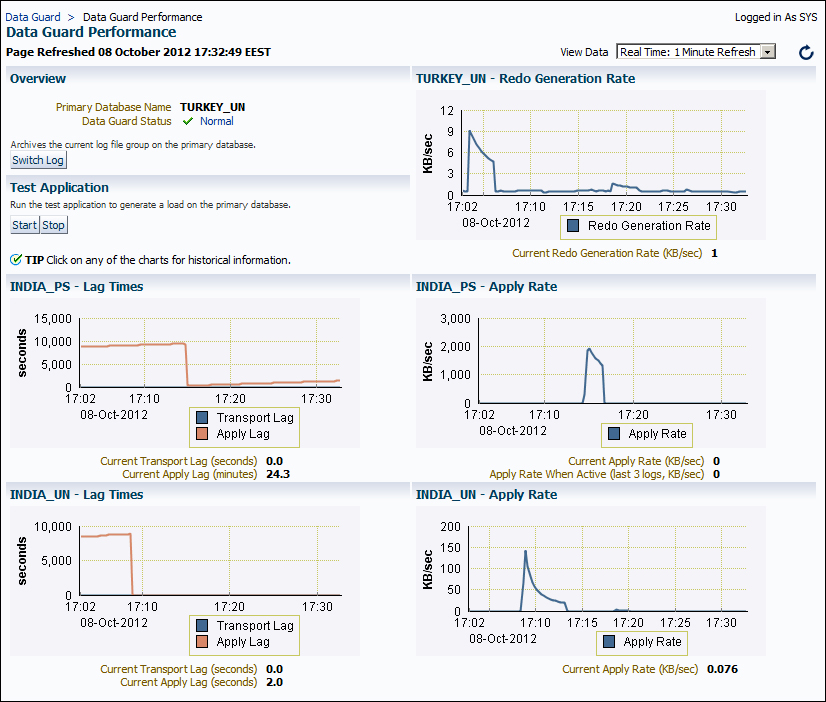
We will see the following information on the performance page:
- The redo generation rate of the primary database
- The lag times for all the standby databases
- The Redo Apply rate for all the standby databases
The redo generation rate of the primary database and the Redo Apply rates of the standby database are important information for Data Guard management. We can use this information to calculate how much time it takes for resynchronization when there's a lag. Also, we can use this information to calculate Recovery Time Objective (RTO) when a physical standby is opened as a snapshot standby or when we stop synchronization for maintenance operations.
Note
Note that the apply rate on this screen is not the Redo Apply capacity of the standby database. It shows the current state of Redo Apply. So if the load on the database is low, we'll see lower apply rates than its actual capacity. We can determine the Redo Apply capacity of a standby database when the Redo Apply process does not wait for a new redo to arrive. So we can achieve this by stopping Redo Apply for a while and starting it again or increasing the redo generation rate on the primary database to a higher value.
On the Data Guard Performance screen, we can click on the charts to reach the historical information.
The Data Guard Performance screen of Cloud Control has another part named Test Application. We can see the Start and Stop buttons here. When we start a test application, it generates a load on the primary database. Then we can pause or stop it at any time. This is useful if you want to see the behavior of a low-load Data Guard configuration under heavy load.
Enterprise Manager Cloud Control 12c provides a centralized incident management console called Incident Manager. This console is an advanced interface to track, diagnose, and resolve default and user-defined incidents. Additionally, it provides features to help rectify the root causes of recurring incidents. Incident Manager also provides lifecycle operations for incidents. It's possible to assign the ownership of an incident to a specific user, set the priority for an incident, escalate it or suppress it for a later time, and track an incident's status.
From the Data Guard management perspective, Incident Manager can help administrators be informed about the issues related to Data Guard, and help track and resolve them. We can define thresholds to default Data Guard metrics and also create user-defined metrics using SQL statements. When the current state of a metric reaches its threshold, an incident is created automatically.
To access the default metrics of Data Guard on the database home page, perform the following steps:
- Click on Oracle Database.
- Click on Monitoring.
- Click on All Metrics.
- Expand the Data Guard Failover, Data Guard Fast-Start Failover Observer, Data Guard Performance, and Data Guard Status (only in the primary database) categories to see all the related metrics. The primary and standby databases have different metrics as we can see in the following screenshot:
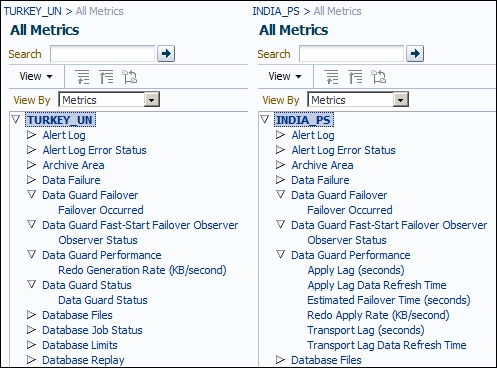
It's possible to define the thresholds of some of these metrics. We can define two values: the Warning and Critical thresholds. However, some of them are not editable because they're simple 0/1 controls such as Observer Status or Failover Occurred.
These metrics produce incidents; we can see the details of an incident on the Incident Manager page, which is accessible from the Enterprise menu, select Monitoring, and then Incident Manager. It's also possible to monitor incidents for a specific database by clicking on the Oracle Database menu and then going to Monitoring | Incident Manager on the database home page.