So far, we have learned how ReSharper can help you write code and improve navigation around your project. In this chapter, we will focus on one of the most notable ReSharper features—code analysis.
In this chapter, we will cover the following topics:
- Code quality analysis
- Eliminating errors and code smells
The fact that you can compile your code does not mean your code is good. It does not even mean it will work. There are many things that can easily break your code. A good example is an unhandled NullReferenceException. You will be able to compile your code and you will be able to run your application, but there will be a problem.
ReSharper v8 comes with more than 1400 code analysis rules and more than 700 quick fixes, which allow you to fix detected problems. What is really cool is that ReSharper provides you with code inspection rules for all supported languages. This means that ReSharper not only improves your C# or VB.NET code, but also HTML, JavaScript, CSS, XAML, XML, ASP.NET, ASP.NET MVC, and TypeScript.
Apart from finding possible errors, code quality analysis rules can also improve the readability of your code. ReSharper can detect code that is unused and mark it as grayed, which prompts you that maybe you should use auto properties or objects and collection initializers, or use the var keyword instead of an explicit type name.
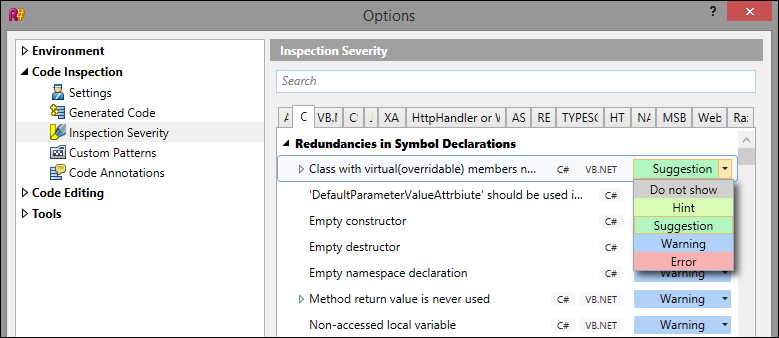
ReSharper provides you with five severity levels for rules and allows you to configure them according to your preference. Code inspection rules can be configured in the ReSharper's Options window. A sample view of code inspection rules with the list of available severity levels is shown in the following screenshot:
One of the best features in terms of code quality in ReSharper is Background analysis. This means that all the rules are checked as you are writing your code. You do not need to compile your project to see the results of the analysis. ReSharper will display appropriate messages in real time.
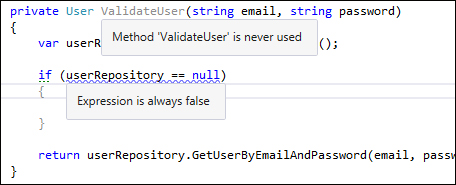
By default, the described rules are checked locally, which means that they should be checked in the current class. Because of this, ReSharper can mark some code as unused if it is used only locally; for example, there can be any unused private method or some part of code inside your method.
These two cases are shown in the following screenshot:
Additionally, for local analysis, ReSharper can check some rules in your entire project. To do this, you need to enable Solution-wide inspections. The easiest way to enable Solution-wide inspections is to double-click the circle icon in the bottom-right corner of Visual Studio, as seen in the following screenshot:
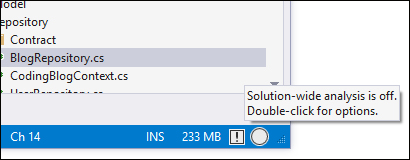
With enabled Solution-wide inspections, ReSharper can mark the public methods or returned values that are unused.
With ReSharper v8, you can easily mark some part of your code as code that should not be checked by ReSharper.
You can do this by adding the following comments:
// ReSharper disable all
// [your code]
// ReSharper restore all
All code between these two comments will be skipped by ReSharper in code inspections. Of course, instead of the all word, you can use the name of any ReSharper rule such as UseObjectOrCollectionInitializer.
You can also disable ReSharper analysis for a single line with the following comment:
// ReSharper disable once UseObjectOrCollectionInitializer
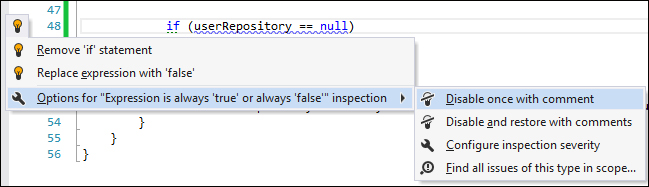
ReSharper can generate these comments for you. If ReSharper highlights an issue, then just press Alt + Enter and select Options for "YOUR_RULE" inspection, as shown in the following screenshot:
You can also an ad-hoc run code analysis. An ad-hoc analysis can be run on the solution or project level.
To run ad-hoc analysis, just navigate to RESHARPER | Inspect | Code Issues in Solution or RESHARPER | Inspect | Code Issues in Current Project from the Visual Studio toolbar.
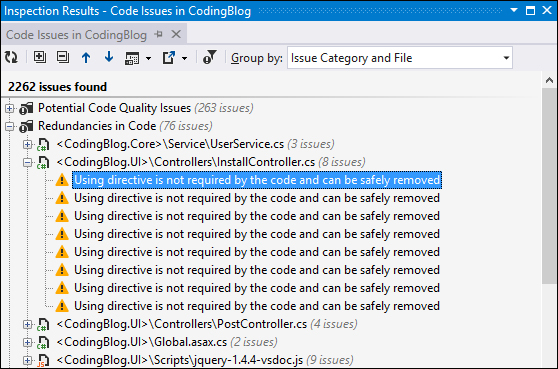
This will display a dialog box that shows us the progress of analysis and will finally display the results in the Inspection Results window. You can filter and group the displayed issues as and when you need to. You can also quickly go to a place where the issue occurs just by double-clicking on it.
A sample report is shown in the following screenshot: