
Engineering Reliable Mobile Applications
Modern mobile apps are complex systems. They mix multitiered server architecture run in data centers, messaging stacks, and networks with sophisticated on-device functionality both foreground and background. However elaborate, users perceive the reliability of the service through the devices in their hands. Did the application do what was expected quickly and flawlessly? At Google, the shift to a mobile focus brought SRE to emphasize the true end-to-end user experience and the specific reliability problems presented on mobile. We’ve seen a number of production incidents in which server-side instrumentation taken by itself would have shown no trouble, but where a view inclusive of the user experience reflected end-user problems. For example:
-
Your serving stack is successfully returning what it thinks are perfectly valid responses, but users of your app see blank screens.
-
Users opening your maps app in a new city for the first time would see a crash, before the servers received any requests at all.
-
After your application receives an update, although nothing has visibly changed, users experience significantly worse battery life from their devices than before.
These are all issues that cannot be detected by just monitoring our servers and datacenters. For many products, the user experience (UX) does not start or reach the server at all; it starts at the mobile application that the user employs to address their particular use case, such as finding a good restaurant in the vicinity. A server having five 9’s of availability is meaningless if your mobile application can’t access it. In our experience, it became increasingly important to not just focus our efforts on server reliability, but to also expand reliability principles to our first-party mobile applications.
This report is for people interested in learning how to build and manage reliable native mobile applications. In the sections that follow, we share our experiences and learnings from supporting and developing first-party native mobile applications at Google, including:
- Core concepts that are critical to engineering reliable native mobile applications. Although the content in this report primarily addresses native mobile applications, many concepts are not unique to these applications and are often shared with all types of client applications.
- Phenomena unique to mobile applications, or to integrated stacks that service them.
- Key takeaways from actual issues caused by or related to native mobile applications.
Because they’re a critical part of a user-facing stack, mobile applications warrant SRE support. By sharing what we’ve learned along the way as we’ve designed and supported mobile applications over the years, we hope to equip you to deal with the challenges particular to your own mobile application production environments.
How to SRE a Mobile Application
We can compare a mobile application to a distributed system that has billions of machines—a size three to four orders of magnitude larger than a typical large company’s footprint. This scale is just one of the many unique challenges of the mobile world. Things we take for granted in the server world today become very complicated to accomplish in the mobile world, if not impossible for native mobile applications. Here are just some of the challenges:
- Scale
-
There are billions of devices and thousands of device models, with hundreds of apps running on them, each app with multiple versions. It becomes more difficult to accurately attribute degrading UX to unreliable network connections, service unreliability, or external factors.
- Control
-
On servers, we can change binaries and update configurations on demand. In the mobile world, this power lies with the user.
-
In the case of native apps, after an update is available to users, we cannot force a user to download a new binary or configuration. Users might consider upgrades to be an indication of poor-quality software and assume that all the upgrades are simply bug fixes. Upgrades also have tangible cost—for example, metered network usage—to the end user. On-device storage might be constrained, and data connection might be sparse or nonexistent.
- Monitoring
-
We need to tolerate potential inconsistency in the mobile world because we’re relying on a piece of hardware that’s beyond our control. There’s very little we can do when an app is in a state in which it can’t send information back to you.
-
In this diverse ecosystem, the task of monitoring every single metric has many possible dimensions, with many possible values; it’s infeasible to monitor every combination independently. We also must consider the effect of logging and monitoring on the end user given that they pay the price of resource usage—battery and network, for example.
- Change management
-
If there’s a bad change, one immediate response is to roll it back. We can quickly roll back servers, and we know that users will no longer be on the bad version after the rollback is complete. On the other hand, it is impossible to roll back a binary for a native mobile application on Android and iOS. Instead, the current standard is to roll forward and hope that the affected users will upgrade to the newest version. Considering the scale and lack of control in the mobile environment, managing changes in a safe and reliable manner is arguably one of the most critical pieces of managing a reliable mobile application.
In the following sections, we take a look at what it means to be an SRE for a native mobile application and learn how to apply the core tenets of SRE outside of our datacenters to the devices in our users’ pockets.
Is My App Available?
Availability is one of the most important measures of reliability. In fact, we set Service-Level Objectives (SLOs) with a goal of being available for a certain number of 9’s (e.g., 99.9% available). SLOs are an important tool for SREs to make data-driven decisions about reliability, but first we need to define what it means for a mobile application to be “available.” To better understand availability, let’s take a look at what unavailability looks like.
Think about a time when this happened to you:
- You tapped an app icon, and the app was about to load when it immediately vanished.
- A message displayed saying “application has stopped” or “application not responding.”
- You tapped a button, and the app made no sign of responding to your tap. When you tried again, you got the same response.
- An empty screen displayed or a screen with old results, and you had to refresh.
- You waited for something to load, and eventually abandoned it by clicking the back button.
These are all examples of an application being effectively “unavailable” to you. You, the user, interacted with the application (e.g., loaded it from the home screen) and it did not perform in a way you expected, such as the application crashing. One way to think about mobile application reliability is its ability to be available, servicing interactions consistently well relative to the user’s expectations. Users are constantly interacting with their mobile apps, and to understand how available these apps are we need on-device, client-side telemetry to measure and gain visibility. As a well-known saying goes, “If you can’t measure it, you can’t improve it.”
Crash reports
When an app is crashing, the crash is a clear signal of possible unavailability. The user’s experience might be interrupted with a crash dialog, the application might close unexpectedly, or the user might be prompted to report a bug. Crashes can occur for a number of reasons when an exception is not caught, such as a null-pointer dereference, an issue with locally cached data, or invalid server response, thereby causing the app to terminate. Whatever the reason, it’s critical to monitor and triage these issues right away.
Crash reporting solutions such as Firebase Crashlytics can help collect data on crashes from devices, cluster them based on the stack trace, and alert you of anomalies. On a wide enough install base, you might find crashes that occur only on particular app or platform versions, from a particular locale, on a certain device model, or according to a peculiar combination of factors. In most cases, a crash is triggered by some change, either binary, configuration, or external dependency. The stack trace should give you clues as to where in the code the exception occurred and whether the issue can be mitigated by pausing a binary rollout, rolling back a configuration flag, or changing a server response.
Service-Level Indicators
As defined in Site Reliability Engineering, by Betsy Beyer, Chris Jones, Jennifer Petoff, and Niall Richard Murphy (O’Reilly, 2016), a Service-Level Indicator (SLI) is “a carefully defined quantitative measure of some aspect of the level of service that is provided.” Considering our previous statement about servicing users and their expectations, a key SLI for an app might be the availability or latency of a user interaction. However, an SLI is a metric, and usually an aggregation of events. For example, possible definitions of SLIs for the “search” interaction might be as follows:
An application can be equipped with client-side telemetry to record events as well as attributes (e.g., action, location) and qualities (e.g., the end state, error code, latency) of a user interaction. There are performance monitoring solutions such as Firebase Performance Monitoring that capture and transport logged events from mobile devices and generate client-side SLI metrics like those we just presented for production monitoring or analytics. As with other user data, monitoring data should be collected and stored in a privacy-compliant way—for example, to adhere to policies such as the European Union’s General Data Privacy Regulation (GDPR). Here is an example log event, to capture the performance of a voice search interaction:
{
  "producer": "apps/search",
  "task": {
    "time": {
      "seconds": 1541666363,
      "nanos": 563117717
    },
    "action": "VOICE_SEARCH",
    "country": "us"
  },
  "result": {
    "code": "OK",
    "latency": {
      "nanos": 157291863
    }
  }
}
To derive an SLI metric from an event, we need a formal definition of which set of events (e.g., the critical user interactions from versions within a support horizon) and the event success criteria (e.g., code = OK). This model allows the telemetry to be durable to changes, where events logged on clients can contribute to one or more SLIs. These logged events can also apply to different success criteria. It supports more advanced use cases such as slicing an SLI metric along dimensions like country, locale, app version, and so on. Furthermore, it allows for more sophisticated definitions of reliability; that is, an Availability definition in which success is “code = OK AND latency < 5s” is more consistent with user-perceived availability and thresholds for abandonment.
After you have high-quality SLI metrics, you might consider setting the overall reliability goals in the form of SLOs—the number of 9’s you’d expect to deliver. SLOs can be very useful in the context of real-time monitoring and change management, and they also can help set engineering priorities. If an application is not meeting its reliability goals, the time spent in feature development can be diverted to performance and reliability work (or vice versa, when an app is consistently exceeding its goals).
Real-Time Monitoring
SRE teams love real-time metrics: the faster we see a problem, the more quickly we can alert on it, and the quicker we can begin investigating. Real-time metrics help us see the results of our efforts to fix things quickly and get feedback on production changes. Over the years, many postmortems at Google have looked at the early symptoms of an incident and called for improvements in monitoring to quickly detect a fault that, in retrospect, was pretty obvious.
Let’s look at server monitoring as an example. For this example, most incidents have a minimum resolution time that is driven more by humans organizing themselves around problems and determining how to fix them rather than the promptness of the alerting. For mobile, the resolution time is also affected by the speed with which fixes, when necessary, can be pushed to devices. Most mobile experimentation and configuration at Google is polling oriented, with devices updating themselves during opportune times of battery and bandwidth conservation. This means that even after submitting a fix, it might be several hours before client-side metrics can be expected to normalize.
In spite of the latency just discussed, we do find that on widely deployed apps, even if the majority of the installed population doesn’t see the effects of a fix for hours, client telemetry is constantly arriving. Therefore, it becomes a near certainty that some of the devices that have picked up a fix will also, by chance, upload their telemetry shortly afterward. This leads to two general approaches for actionable feedback:
- Design low-latency error ratios with high-confidence denominators (to control for normal traffic fluctuation), so after pushing a fix, you can immediately begin looking for a change in error rates. There’s a small cognitive shift here: an SRE looking at an error ratio curve needs to mentally or programmatically scale the change they see by the fix uptake rate. This shift comes naturally with time.
- Design metrics such that the metrics derived from device telemetry include the configuration state as a dimension. Then, you can constrain your view of error metrics to consider only the devices that are using your fix. This becomes easier under experiment-based change regimes, in which all client changes are rolled out through launch experiments, given that problems almost always occur in one or another experiment population, and the ID of the experiment that caused the problem (or that contains a fix) is consistently a dimension in your monitoring.
We typically employ two kinds of real-time monitoring, white-box and black-box, which are used together to alert us of critical issues affecting mobile apps in a timely manner.
White-box monitoring
When developing an app, we have the luxury of opening a debug console and looking at fine-grained log statements to inspect app execution and state. However, when it is deployed to an end-user’s device, we have visibility into only what we have chosen to measure and transport back to us. Measuring counts of attempts, errors, states, or timers in the code—particularly around key entry/exit points or business logic—provides indications of the app’s usage and correct functioning.
We have already alluded to several standard types of monitoring, including crash reports and SLI metrics. We also can instrument custom metrics in the app to monitor business logic. These are examples of white-box monitoring, or monitoring of metrics exposed by the internals of the app. This class of monitoring can produce very clear signals of an app’s observed behaviors in the wild.
Black-box monitoring
Black-box monitoring—testing external, visible behaviors of the app as if the user performed those actions—is complementary to white-box monitoring. Generally, probing is a kind of black-box monitoring in which a regularly scheduled “test” is performed. For applications, this entails starting a current version of the binary on a real or emulated device, inputting actions as a user would, and asserting that certain properties hold true throughout the test. For example, to exercise the search “user journey,” a UI test probe would be written to install and launch the app on an emulator, select the input box, type a search term, click the “search” button, and then verify that there are results on the page.
Black-box monitoring gives us a signal about the UX. A continuously running prober can give us success or failures for particular user journeys in the application that can be attributed to the application itself or any number of external factors that affect it, such as a dependent server endpoint. Even though black-box monitoring has more coverage of failure modes, it does not easily indicate whether the failure is internal to the application. This is why we view white-box and black-box monitoring to be complementary and why we use them together for better coverage of the app.
Performance and Efficiency
When was the last time your phone ran out of battery at the most inconvenient time? The battery is arguably the most valuable resource of a mobile device—in fact, it is what enables the device to be “mobile” in the first place. Mobile applications on a device share precious resources, such as the battery, network, storage, CPU, and memory. When one application abuses or wastes those shared resources, it does not go unnoticed. No application wants to be at the top of the battery or network usage list and attract negative reviews. Efficiency is particularly important if you expect your app to be used on lower-end devices and in markets where metered network and other resources have nontrivial cost to the user.
The platform as a whole suffers when shared resources are misused, and, increasingly, the OS places limitations to prevent abuse. In turn, platforms provide tools (such as Android Vitals) to help attribute and pinpoint problems in your own app. Google’s internal applications have incentives to care about system health factors that affect user happiness, such as battery life. In fact, feature launches that would have decreased mean device battery life by as little as 0.1% have been blocked from launching precisely because of their negative effect on user happiness. Many small regressions across applications, features, and platforms create a tragedy of the commons and poor overall experience. Antipatterns that lead to issues with performance and efficiency, dubbed as “known bads,” are identified and published on internal and external developer guides (e.g., Android Developer Guide).
Teams at Google are required to identify their use cases—both when the screen is on and when it is off—that might affect performance metrics. These include use cases such as key user flows, frequently encountered flows, and the use cases expected to have high resource usage. Teams do a variety of internal testing to collect statistics on mobile system components such as battery, memory, and binary size. Any unexpected regressions are triaged and fixed before launch, and any expected regressions beyond predefined thresholds are approved only after careful consideration of the trade-offs vis-à-vis the benefits a feature user would acquire. As a result of this process, much of the system health testing is automated and reports are easily prepared for review.
Change Management
We recommend a number of best practices when releasing client applications. Many of these practices are based upon the principles expressed in Site Reliability Engineering. Best practices are particularly important to SRE because client rollbacks are near impossible and problems found in production can be irrecoverable (see “Case Studies”). This makes it especially important to take extra care when releasing client changes.
Release safety is especially critical because a broken new version can erode user trust, and that user might decide to never update again.
Staged rollout
A staged rollout is a term used in Android development that refers to releasing an update to a percentage of your users that you increase over time. iOS refers to this practice as Phased Releases. All changes should go through some sort of staged rollout before releasing fully to external users. This allows you to gradually gather production feedback on your release rather than blasting the release to all users at once. Figure 1-1 shows an example of a release life cycle, including a staged rollout.
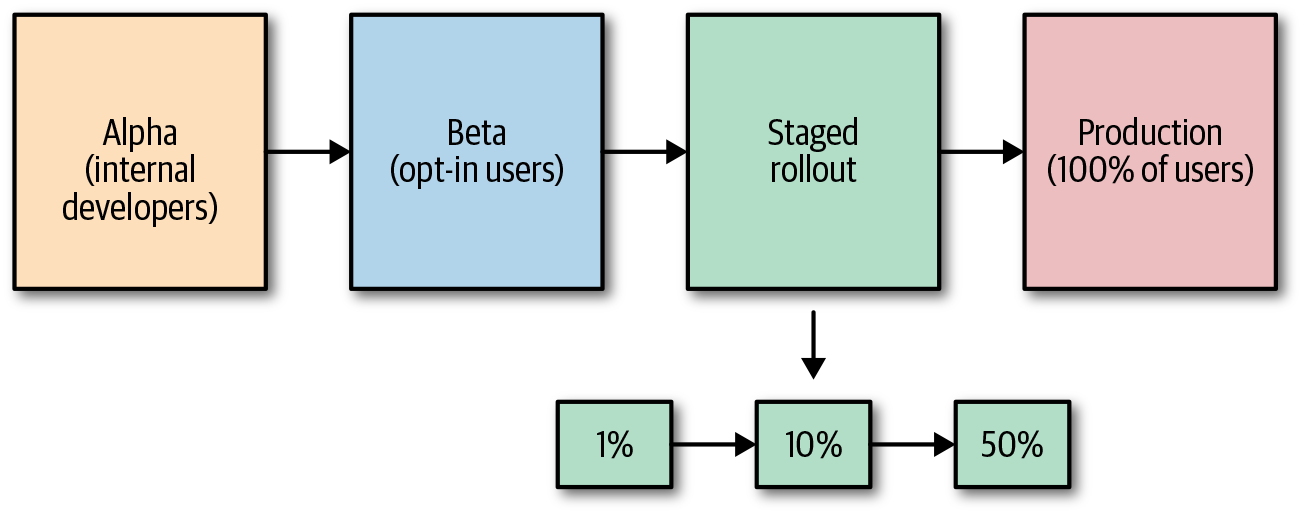
Figure 1-1. Release life cycle with a staged rollout in which 1% of users receive the new version, then 10% of users, then 50% of users, before releasing to all users
Internal testing and dogfooding (using your own product internally) is rarely enough to fully qualify a release because developer devices are not typically representative of the actual user population. If the platform supports it, it can be useful to add an extra stage between internal and external users in which you release to a subset of external users that choose to receive beta versions of your application (open beta in Android or TestFlight in iOS). This widens the pool of devices and users, meaning that you can test on a larger set of users while not affecting the entire world, and adds an extra step of release qualification.
Experimentation
Unlike traditional services, client applications tend to exist in a very diverse ecosystem. Each user’s device differs from the next, depending on platform version, application version, locale, network, and many other factors. One issue we’ve noticed when conducting a staged rollout is that some metrics, such as latency, can look great on the newest version for the first few days but then change significantly for the worse after a week. Users who have better networks and/or devices tend to upgrade earlier, whereas those who have worse networks and/or devices upgrade later. These factors make it less straightforward to compare metrics of the newest version to the metrics of the previous version and tend to result in manual inspection of graphs, with low confidence in the correctness of the signal.
When possible, we recommend releasing all changes via experiments and conducting an A/B analysis, as shown in Figure 1-2, over a staged-rollout process. This helps reduce the noise significantly and enables simpler automation. Control and treatment group selection should be randomized for every change to ensure that the same group of users are not repeatedly updating their applications.
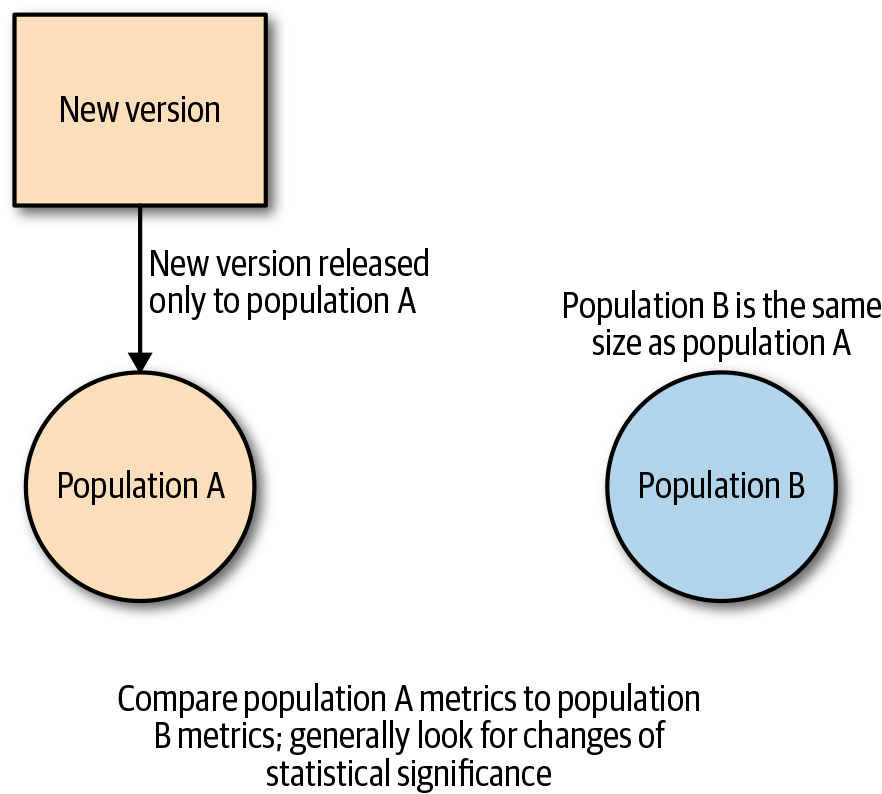
Figure 1-2. A/B experiment analysis for mobile change
New code is released through the binary release and should be disabled by using a feature flag by default.
Warning
Feature flags are another tool to manage production changes, and you need to use them according to the relevant distribution platform’s rules (e.g., Apple’s App Store has specific rules on allowed changes).
Releasing code through the binary release makes the feature available on all users’ devices, and launching the feature with a feature flag enables it for a smaller set of users that is controlled by the developer, as illustrated in Figure 1-3. Feature flags are generally the preferred way to make changes to the client because they give the developer more control in determining the initial launch radius and timeline. Rolling back the feature flag is as simple as ramping the launch back down to 0%, instead of rebuilding an entire binary with the fix to release to the world.
When using feature flag-driven development, it is especially important to test that rolling back the flag does not break the application. You should perform this testing before the flag launch begins.
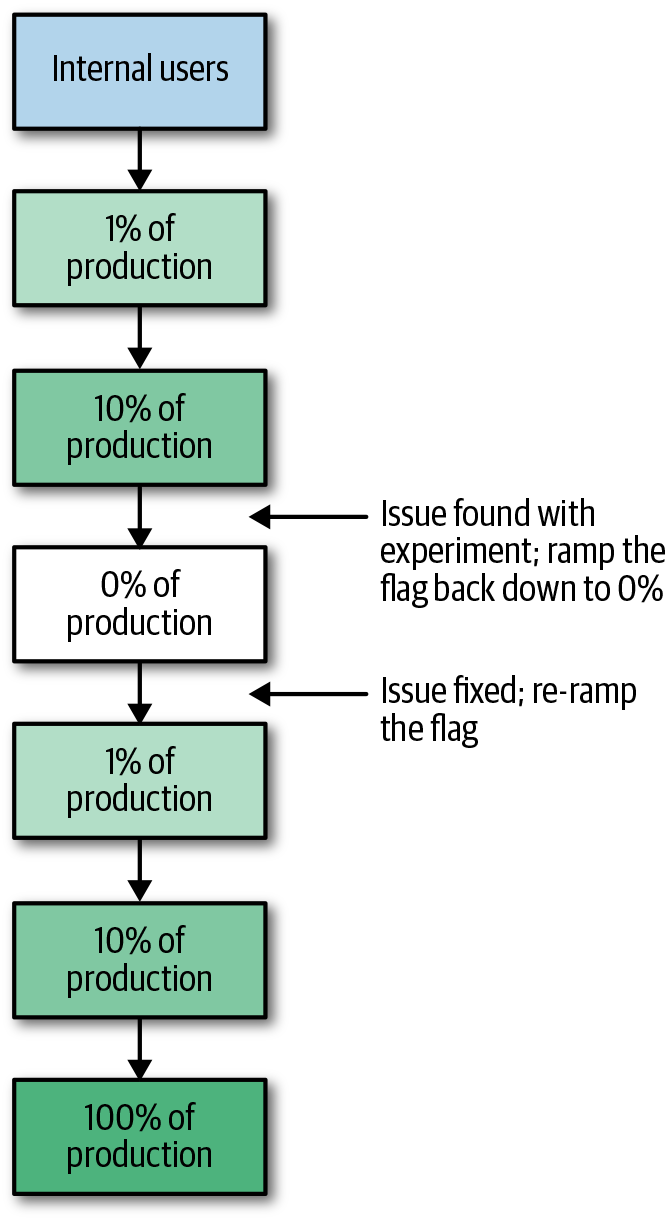
Figure 1-3. Example stages of a feature flag ramp: A feature flag’s functionality is tested first on internal users before rolling out in stages to production users. If an issue is found on a subset of production users, it can be rolled back and the code is fixed before ramping the feature flag to 100%.
Upgrade side effects and noise
Some changes can introduce side effects simply by the process of upgrading to the newest version of the code. For example, if the change requires a restart to the application, the experiment group (the group that received the change) needs to take into account the side effects of restarting an application, such as the latency increase caused by cold caches.
One way to address side effects is to create something like a placebo change in which the control group receives a no-op update, and the users go through much of the same behavior as the experiment group without receiving the change. You need to do this carefully because there can be negative user effects like excessive battery or data consumption.
Support Horizons
The power lies with the user to update a client application, which means that as newer versions of a particular application are released over time, we can never quite remove the older versions. Users might not update for a variety of reasons, such as the device having no more available storage space, or users making the explicit choice to disable autoupdates. However, there can be a strong motivation to update an application, such as for security or privacy fixes. Some applications even force an update to remain usable or show an update dialog to encourage the user to update.
As client applications grow and add more functionality and features, some things become impossible to do in older versions. For example, if you add a new critical metric to your application in version 2.0, that metric will be available only in versions 2.0 and up. It is not sustainable for SRE to support all possible versions of a client, especially when only a small fraction of the user population is on older versions, over time. Because supporting too many older versions resembles archaeology more than systems management, we deliberately limit SRE’s support horizon and place the choice of handling older versions into the hands of product development teams. These teams have a better understanding of how old code behaves under current circumstances. It depends on the update rate, but from our experience, limiting SRE support to about one or two years and then letting the development teams handle older versions of code has been a good rule of thumb to follow.
Server-Side Impact
When making client changes to apps that have a server-side component, it is important to keep in mind the impact that those changes have on the server side. There can be thousands of clients talking to your servers at any given time. There is a very real possibility of a bug or outside phenomena suddenly overloading your servers—we have seen a number of these events.
The number of daily requests is, to some extent, proportional to the population of the application, and your servers are likely scaled to that population already. Problems arise with unintended phenomena such as time synchronization causing requests to spike at regular intervals, or large global events causing an unexpectedly high number of requests. Client releases can also cause unintended consequences if new or changed remote procedure calls (RPCs) are introduced in the latest version and the servers are not appropriately configured to handle them. Consider proving during release qualification that no unexpected RPCs will occur in new releases. If possible, your release qualification should include a fully productionized release run with no test conditions required. At Google, we’ve had cases in which exercising the live APIs exposed problems in app release candidates not revealed by hermetic testing.
Note
To learn more about how to handle these kinds of issues, refer to the section “Thundering Herd Problems”.
Case Studies
In this section, we address the topics covered in the previous section through several concrete examples of client issues that we’ve encountered. We discuss practical takeaways for each case study, which you can apply to your own applications.
SLIs and SLOs: Learning to Monitor the (Very, Very) Long Tail
In 2018, an SRE team at Google was in the early stages of onboarding a component of Google Play Services, one of the most widely deployed Android packages. Similar to onboarding a production service, we devised questions to come up with a reasonable definition of what job the software was meant to do, ways to measure how well it did that job, and what levels of reliability were consistent with the success of the product. The first question helped identify “actions” that the software was meant to perform, the second helped determine the SLIs that measure how well it’s performing them, and the last question set the SLOs—the goals against which the most valuable SLIs are assessed.
If this had been a classic server, we might have mapped the service actions to the RPCs exported, identified which RPCs represented user-critical actions, selected SLIs to measure RPC failures and latency, and established SLOs around which failure ratio or latency is tolerable given its user exposures. More sophisticated servers tend to group sequences of user interactions together into “critical user journeys” and contextualize user interactions, to inform which SLOs go with the users in different contexts (e.g., an infrequently used Settings page versus the primary display pane in your email). Server frameworks at Google have evolved to make actions uniform and automatically expose the appropriate SLIs, which simplifies putting critical user journeys and SLOs together.
Unfortunately, our mobile component did not fit this mold. First, the mobile component’s function was to carry metrics and monitor telemetry from other apps while being as gentle as possible on the user’s bandwidth, flash wear, and battery life. Although its actions were often derived from user actions, users never interacted with it directly. Fine, we thought. Google has lots of backend systems no one ever sees, and the actions-SLI-SLO approach still works for them. We sketched out an RPC-like SLO derived from telemetry actions taken by apps, and began measuring it. Almost immediately, we ran into a significant finding: by the simple ratio of successful actions versus attempted ones, our component was failing almost half the time. This discovery triggered an extensive investigation. Was the measurement broken, or was the component itself failing that much? Our component was the instrumentation system—was this metamonitoring misleading or blinding in itself? How was this problem distributed among an installed population of billions? We eventually made two important observations:
- The range of potential failures at the tail is enormous
-
We’d actually anticipated this going into onboarding but never attempted to measure it before. For almost any given dimension, through our monitoring data, we could find problems somewhere on the axis. Older OS versions with long-fixed bugs or compatibility quirks? Yes, more susceptible to failure. Older versions of our own software component? Also more affected. Devices with less RAM? Definitely more likely to fail. Devices whose only telemetry was recorded in safe-boot or other recovery states? Also likely to fail. Were specific versions of our software affected? Some more than others, but not enough to explain the overall issue. What about known bugs or those bugs found during the investigation? Also involved. Many of these factors affect one another—for example, older OS versions tend to be found on aging hardware. We eventually built a huge map of suspected contributing causes and their potential overlaps so that we could attribute failures among a known set of causes. We then could say with some confidence that we’d accounted for enough of the failures so that if all those problems were fixed, we’d be happy with the result.
- Usage of your software is a leading cause of failure in your software
-
Telemetry systems need to put data somewhere—they need a working free storage, a working network, or both. When we assessed the distribution of failure among our device populations, rather than compute simple failure ratios, we found that a near majority of all telemetry data globally was being lost. In spite of this, however, we noticed that most devices were, in fact, totally healthy and experiencing no loss at all—the loss, even among our dozen known causes, was concentrated in only about 2% of the devices. Furthermore, those devices were, in fact, producing (or trying to produce) more telemetry data than the other 98% combined. In some cases, the failure was external (e.g., failing flash storage), but in many other cases, the failure itself was the result of pathological cases in logging and measurement, which was causing pushback from our component and as a result, amplifying the losses on a modest population of broken devices.
Key takeaways
- If a component’s functionality is shared across multiple apps on the same device, badly broken installations of apps should not interfere with other applications on the same device. In our case, we designed a more intelligent pushback mechanism and simple isolation rules to limit cross-app impact. We also added instrumentation to clearly indicate when a failure is actually caused by just one misbehaving app.
- Metamonitoring should, to the extent possible, have failure modes independent of monitoring so that you’re not trying to explain skews in your data with other skewed data. Here, we designed a new metamonitoring system to be robust in the face of most known faults, including full filesystems, various forms of filesystem metadata corruption, and most crash loops, and capable of producing a viable signal when the main telemetry system is broken or impaired.
- It helps to define SLIs and SLOs based around “device hours” when the telemetry system was working rather than whether any given event was handled successfully. In effect, this is a mobile-ification of the “happy users” SLO design principle: you base your SLO around the users your software serviced well rather than how users’ individual actions affected your code.
- It’s also valuable in defining your SLOs to measure “conformant” situations in which correctly written software should be expected to perform well, and nonconformant ones when it cannot realistically do so: for example, count periods when the filesystem was full or situations in which the device never had a usable network and separate them for SLO purposes from those in which SRE would make a reactive intervention to fix things. Nonconformant cases are still interesting and generate ideas for product improvements, now that they’re well understood. For an SRE team, though, they are projects for future improvements, not causes for alerts.
- Set expectations that future releases and experiments are gated on acceptance criteria derived from the SLOs. In other words, software changes have a neutral-or-better effect on SLO compliance, given the conformance criteria. This helps catch future cases of “slow burn” SLO slippage.
Doodle Causes Mobile Search App Errors
Google Doodles are an iconic piece of Google’s brand, and are implemented by a harmless UI change. In one specific incident however, a new doodle was released without a configuration field set, causing the Google Search mobile application to fail whenever the user tried to access a view with a doodle, such as the search results page.
Doodles go live in a certain country when the time for that country hits midnight, and the search app results graph showed sharp increases on the hour mark as the doodle reached more countries, as shown in Figure 1-4. The shape of the increase indicated some kind of server-side configuration change, but it was unclear which configuration was the cause.

Figure 1-4. Graph showing client app failures as the problematic doodle hits new regions
Engineers found the offending errors in logs, and from there they were able to find the root cause. The configuration was fixed and released, but errors did not go down immediately. To avoid calling server backends, the client code cached the doodle configuration for a set time period before calling the server again for a new configuration. For this particular incident, this meant that the bad configuration was still on user devices until the cache expired.
A client-side fix was also submitted to prevent the client from crashing in this situation. However, a few months later, there was a similar outage with a similar root cause—except this time the outage only affected versions without the fix. After that, server-side guards were put in place to prevent a bad configuration from being released.
Key takeaways
-
Multiple teams might be contributing code to your application or releasing changes that affect your client in unexpected ways. It’s especially important to have clear documentation on your clients’ dependencies, such as server backends and configuration mechanisms.
-
Because there was a lack of defense-in-depth in the original fixes, this resulted in a similar issue happening later. Client-only fixes are often not enough because your application will almost always have users on older versions that don’t receive the fix for a variety of reasons (e.g., they never update their application). When possible, we recommend implementing a server-side fix, as well, to increase the coverage.
Always Have Multiple Ways out of Trouble
One fine afternoon, a Google engineer made a simple four-character change to a configuration file. It was tested on a local device, run through automated testing, committed to production, and rolled out. Two issues subsequently emerged: (1) due to a build error, the change was applied to old application versions that could not support it; and (2) the configuration change was rolled out to a wider population than intended. When the problematic configuration was downloaded to a user’s device, sufficiently old versions would fail on startup, and once they failed, they would continue to fail by reading the cached configuration before they were able to fetch a new, fixed version of the configuration. Thus, affected devices were stuck and required manual intervention (see Figure 1-5). Google engineers had to inform the affected users via a push notification to manually upgrade. Requiring users to correct problems caused by software bugs is never a good outcome; besides creating a burden for users, manual intervention also causes a long recovery duration.
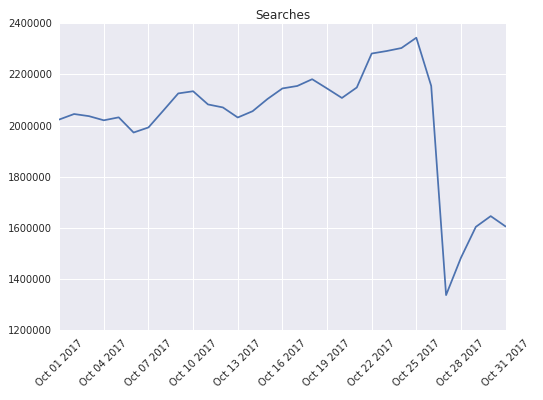
Figure 1-5. Graph of daily active users (DAU) of the app on the affected version range, over a two-week period leading up to and after the outage
Older releases in the wild, in general, increase the risk of change. Multiple preventative strategies exist to manage that risk, including an “heirloomed” configuration frozen in time to limit the exposure to change, multiversion application testing, and experiment-controlled rollouts that allow early detection of crashes on particular devices.
Key takeaways
-
Looping incidents represent a surprisingly large magnitude of risk. They can break an application or device in a way in which the only recovery mechanism is manual (i.e., clearing data).
-
Beware of optimizations which substantially alter the execution flow or runtime assumptions of apps. The configuration caching in this incident was motivated by a desire to reduce app startup time, but it should have begun with the objective, “Can we make config fetching faster?”, before developing a custom configuration life cycle mechanism.
-
Always validate before committing (i.e., caching) a new configuration. Configurations can be downloaded and successfully parsed, but an app should interpret and exercise the new version before it becomes the “active” one.
-
Cached configuration, especially when read at startup, can make recovery difficult if it’s not handled correctly. If an application caches a configuration, it must be capable of expiring, refreshing, or discarding that cache without needing the user to step in.
-
Similar to backups, a crash recovery mechanism is valid only when it has been tested. When applications exercise crash recovery, though, it’s a warning sign. Crash recovery can conceal real problems. If your application would have failed if not for the crash recovery, you are again in an unsafe condition because the crash recovery is the only thing preventing failure. Monitor your crash recovery rates, and treat high rates of recoveries as problems in their own right, requiring root-cause investigation and correction.
-
Anything (device or network constraints, bad UI, user annoyance, and so on) that causes users to not want to update their applications is akin to accumulating debt. When problems do happen, the costs are substantially magnified. Old application releases never entirely go away, and the less successful your updates are, the larger the population that can potentially be affected by a backward-incompatible change.
Thundering Herd Problems
During our team’s early days, someone from our London office walked past a teammate’s desk while they had a monitoring console open. The console included a stacked area plot with a strange double-plateau, which somehow looked familiar. This plot was the rate at which certain mobile apps were registering to receive messages through Firebase Cloud Messaging (FCM). Such registrations are usually done in the background, whenever tokens need refreshing or users install apps for the first time. This plot is normally a gentle, diurnal curve that follows the world’s waking population. Today, however, the baseline rate of registrations had jumped upward in two plateaus, 36 hours apart—the first plateau was modest and decayed back toward the normal trend, the other plateau was much larger and shaped like the teeth of a comb, as demonstrated in Figure 1-6.
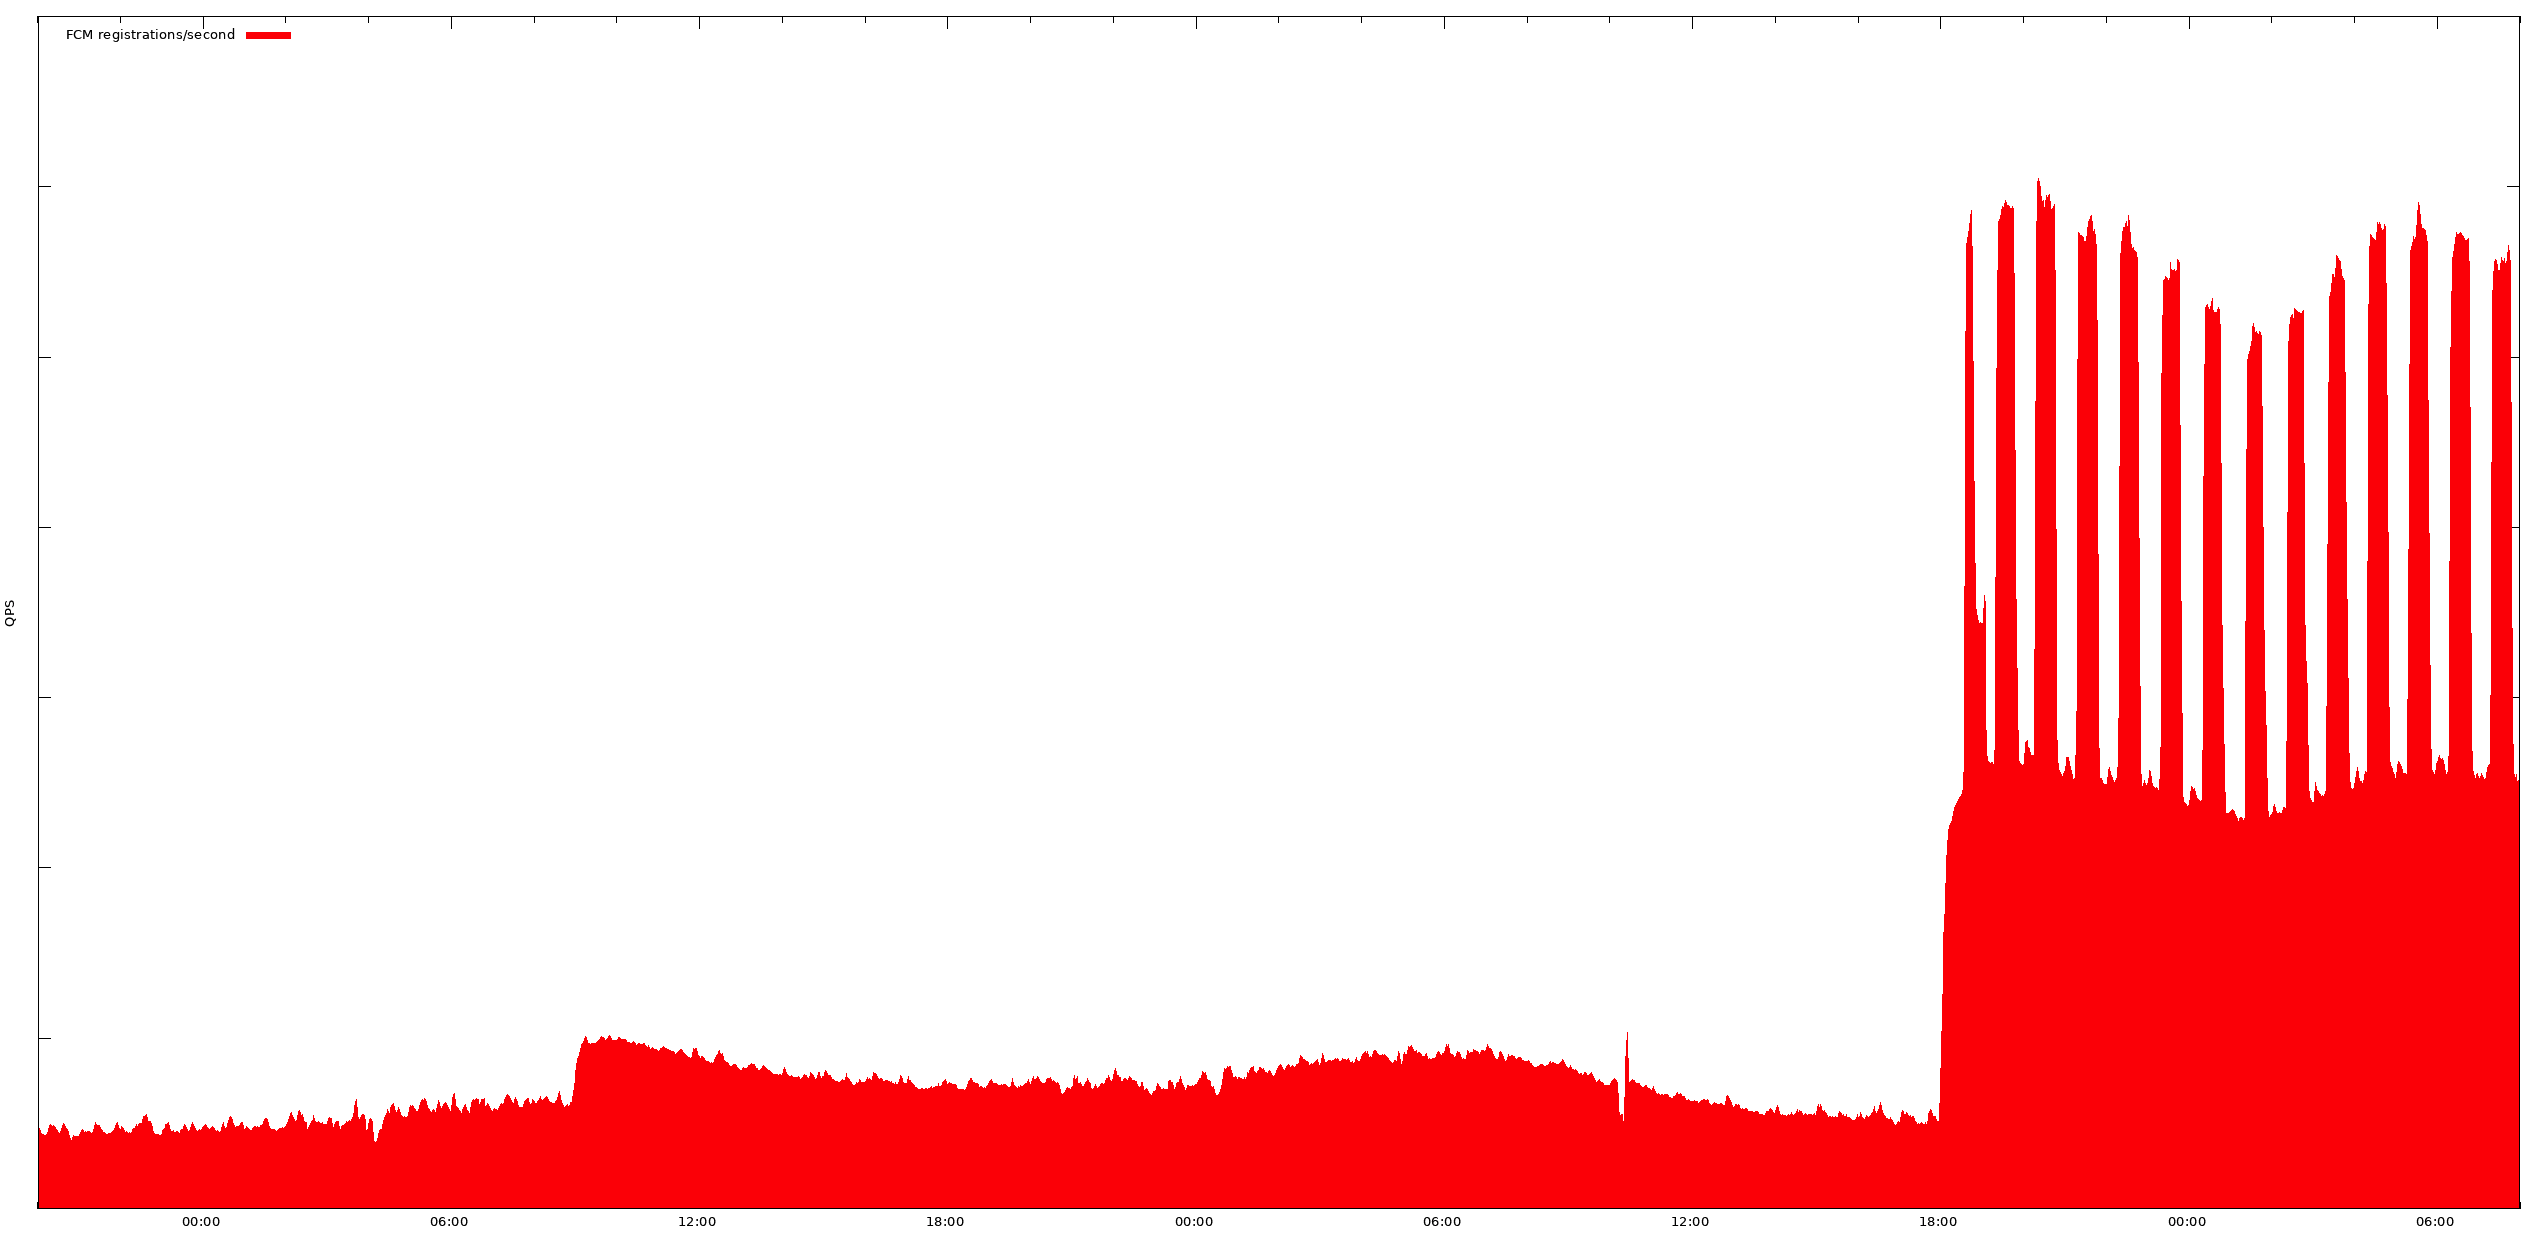
Figure 1-6. Affected application’s FCM registration rate over time
The plot looked familiar because the app was Google’s own, and, except for the comb’s teeth, the offset to the registration rate was the same as the app’s normal release-uptake curve. We were in the midst of rolling out a new release, which had begun making FCM registration calls. The “teeth” of the comb were from the app repeatedly exhausting its quota and being repeatedly topped off. The service was performing normally for other apps, and the service unavailability was at “no risk” (which is why no one from our team had been alerted), but the amplitude shift alluded to the basic consequence of scale in mobile. Although these devices have limited compute power and bandwidth, there are billions of them. When they accidentally do things in unison, they can make life exciting for your service—or the internet.
This is an example of a thundering herd problem in the mobile app world. This particular instance was an easy one to handle; each device that upgraded the app would make a few RPC calls to register for FCM notifications by its various submodules, and that was that. We did a capacity check, adjusted throttling limits, cautioned the release manager not to roll out faster than they were already doing, and started on the postmortem.
Thundering herd problems usually occur for one primary reason: apps that cause server traffic in response to inorganic phenomena, like being upgraded to a new version. They are easy to overlook because to a developer writing and testing their code, a one-time RPC call feels like nothing. For most applications that make use of cloud services like FCM, that is indeed true. However, two things can change that: when the app has a very large installed base, or when the service is your own and scaled for the steady-state demand of your app.
Releases
The rate at which you release new versions of your apps into the wild can be difficult to control. App store release mechanics that are based on exposure percentages don’t offer many guarantees about uptake rate within rollout slices, and effects like device wakeups or commute movements (in which phones experience connectivity changes en masse) can cause app upgrade rates to ebb and surge. In some companies, there might also be simple organizational factors: the people doing mobile app release management might not be the ones responsible for server capacity, or they might not realize that they need to be in touch with those who are responsible for it. There might also be a product level mismatch of goals: app owners want to roll out new versions as quickly as possible to keep their developers’ velocity up, whereas service capacity managers like smooth, steady, and cost-effective load curves.
For our situation, the correct answer was to establish a new principle: mobile apps must not make RPC calls during upgrade time, and releases must prove, via release regression metrics, that they haven’t introduced new RPC calls purely as a result of the upgrade. If new service calls are being deliberately introduced, they must be enabled via an independent ramp-up of an experiment, not the binary release. If an app wants to make RPC calls in the context of its current version (e.g., to obtain fresh version-contextual configuration), it should defer those calls until the next time it can normally execute one, or wait until the user deliberately interacts with the app. Data or configuration obtained via an RPC from a prior version must always be usable (or safely ignored) by the new version—this is already required for the safety of local upgrades because it’s never assured that an RPC will succeed.
This was the right answer for Google because our most popular apps have extremely large installed bases. Those same apps are built by many different teams and interact with many different services. The large installed base demands a rapid upgrade rate (tens to hundreds of thousands of devices per second, for instance) to deliver a reasonable product release cadence. However, we anticipate that similar factors affect apps at smaller scale, as well. If a service exists primarily to support a specific app, over time its capacity management optimizes for a footprint that is close to the app’s steady-state needs. Therefore, avoiding upgrade-proportional load is valuable at any scale.
We considered and rejected two other approaches that we feel are worth mentioning. The first was to accept upgrade load surges within negotiated ranges and service them from the reserve capacity we provision in case of datacenter-level failures. We rejected this approach because the duration and frequency of app rollouts represented too much time spent below redundancy targets—the probability of a failure during a rollout was too high, relative to our SLO. The second approach, complementary to the first, was to allow the service to oversubscribe during rollouts but, if necessary, selectively shed upgrade load in favor of user-interactive load. We rejected this second option because the work involved to make apps fully tolerant of this load shedding was similar to that of eliminating the upgrade-time calls in the first place, and eliminating the upgrade-time calls was more sustainable organizationally.
Synchronization
Mobile devices are vulnerable to synchronization effects in which large numbers of devices act in unintended unison, sometimes with severe consequences. These events are usually the result of unintended interactions between components of mobile devices, or interactions between devices and external stimuli.
Clock-induced synchronization is perhaps the most common mobile thundering-herd problem we work with. If you’re an SRE team supporting a mobile-facing product, you’ve probably encountered them, too. Many mobile-facing services experience spikes aligned on the hour above the normal diurnal traffic curve, and might see lesser spikes aligned at other common, human-significant times. The causes are many. For example, users intentionally schedule events (such as alarm clocks and calendar events) on hour boundaries, while most mobile operating systems coalesce wakeups and run scheduled tasks opportunistically during these wakeups. This can result in brief spikes of RPCs from mobile apps, doing their scheduled work close to these synchronized times.
The wakeups can also be more indirect: mobile app messaging campaigns and scheduled server-side content pushes are often done at round time units. Therefore, the resulting message traffic causes device wakeups and consequent RPC traffic from opportunistically scheduled tasks. Many mobile devices attempt to coalesce tasks requiring network availability. Some mobile apps defer RPCs until the device’s radio was already powered on for other reasons, to reduce total battery consumption from baseband power-ups and extra radio transmits, but doing so can contribute to clock-based synchronization. If one tightly scheduled task requires the radio, it in effect enables others with looser scheduling to run, as well.
As an example, Figure 1-7 shows a traffic-rate curve of a mobile-facing crash/error metric service. You can see spikes immediately following the start of each hour.

Figure 1-7. Incoming requests to a mobile-facing service exhibiting time synchronization spikes
This service’s on-device design is deliberately asynchronous and follows operating systems’ best practices around wakeups, allowing its tasks to be coalesced with other wakeups and radio powerups. In spite of this, we see that it spikes every hour, as the world’s devices are woken up from sleep by alarms, calendar reminders, and so on, and as their users pick up their phones and use them in response to these events. They also wake up in response to incoming events from messaging systems, such as new email (which itself has hourly spike patterns) or background messaging sent hourly to apps by their owners, to deliver fresh content. Another part of the load, and the reason the spikes’ centers are slightly to the right of any given hour, is that this is an error-and-crash reporting system. A portion of apps that receive an incoming message will then crash attempting to process it.
Messaging systems exhibit hourly spike trends. Figure 1-8 presents an interesting plot from a component of Firebase Cloud Messaging. Again, the vertical scale is somewhat exaggerated. This plot includes traffic from only our North American datacenters (and thus, primarily users in time zones GMT-4 through GMT-10).

Figure 1-8. Firebase Cloud Messaging cloud-to-device message traffic
We see a strong hourly uptick in message traffic, with a long tail-off, driven by a combination of cloud-to-device messaging, which itself runs in hourly cycles, but with a tail-off driven by user responses to those messages. During the 12:00 to 14:00 period, however, things are different. That’s a period of intense device usage in this region. Users of messaging apps are talking to one another, leaving their offices (and network contexts) for lunch, getting directions, and so on. It’s also a period of intense notification activity as apps receive updates about changes in the world around them (e.g., road congestion), and app owners try to take advantage of this period of high user activity to drive engagement in their apps with promotions or other activity.
We’ve experienced several variations of spike trends as different time-based wakeup and work scheduling features were introduced and architectures were evolved. For example, an Android update once accidentally converted certain types of scheduled, legacy wakeup events from being approximately scheduled to precisely scheduled, without fuzzing their offsets. This caused devices receiving that update to wake up at the same instant, which required incident response from SRE to interpret and then provide capacity for the unintentional Denial of Service (DoS) attack on an Android sync system. Engineers ultimately made a fix to the alarm code before any further devices picked up the update and had their wakeup events changed.
Clock-induced synchronization is a global behavior, of which we control only a portion. We approach it primarily during the design phase, prohibiting precisely scheduled wakeups in the apps we support, unless the users themselves supplied the timing (and deferring network activity even then, if possible, because users have legitimately clock-synchronized behaviors of their own). We ensure periodic operations have smear factors appropriate to the size of the installed population (the upgrade-induced traffic we discussed earlier can create echoes of itself if deferred and post-upgrade RPCs lack a smear factor). We also mandate that the teams we work with avoid the use of device messaging to trigger timed app wakeups, except when the user has specifically requested it. In general, we try to be good citizens in this universe of shared time.
Traffic
There’s an interesting artifact in the geographical relationship between the world’s cloud computing capacity and its mobile users. The largest clouds are where capacity is cheapest and most plentiful. Today, this tends to be in North America and Western Europe. Mobile users are more dispersed, and a large portion of that population is in regions with comparatively small cloud footprints. As a result, for user-asynchronous traffic, we find that although traffic might originate in North America, the traffic itself can cross the Pacific Ocean to user devices in Asia and around the Pacific. However, when that traffic triggers RPC traffic or response messages, those responses tend to arrive in datacenters closest to them; for example, those in Asia or the west coast of the United States.
In one example, we worked with the Google Now team to deliver detailed updates of in-progress sporting events to users’ devices. Events like the FIFA World Cup and championships for sports like cricket, baseball, and football (soccer, to Americans) are highly popular, but exhibit strong regionality in that popularity, according to the sport or the teams playing the game. We observed that even though we’d carefully planned for our capacity needs and done end-to-end load tests to prove we were ready, there were small local traffic spikes moving around between our datacenters as devices acknowledged delivery of the update messages. We’d planned for the spikes of sender traffic for each goal scored in the game and allocated capacity near where the traffic would originate. We were reminded, however, through practical experience that device response messages arrive close to where the receivers are.
The example we’ve just discussed has become something we work on with product teams that deliver geo-targeted features or have a strong geo-affinity in its appeal. You might have to carefully spread out the load that generated the traffic among many cloud regions, only to have the traffic over-concentrate in the region nearest to where your feature is popular.
Key takeaways
-
Use the operating system’s task management system to schedule background work. Don’t schedule for specific times unless your user-facing behavior specifically requires it.
-
When letting users pick scheduling for tasks that require a server interaction but don’t require precise timing, favor with UIs only as much specificity as the use case requires. For example, offering refresh options such as “hourly” or “every 15 minutes” allows for broadly diffused scheduling without implying precise timing that can lead to thundering herds. If you do need to offer your users precise timing, defaulting to an imprecise one first can shield you from the worst of the problem.
-
If using refresh triggers or other mechanisms that cause server-originated device wakeups that will then put load on your service (Content Delivery Network, etc.), rate-limit your sends with the load you can comfortably sustain, and smear your load over the broadest tolerable period.
-
Think about asymmetric topology effects in feedback between servers and devices; for example, can part of a feedback loop in one region can create a load concentration in another?
SRE: Hope Is Not a Mobile Strategy
A modern product stack is only reliable and supportable if it’s engineered for reliable operation all the way from the server backends to the app’s user interface. Mobile environments are very different from server environments and the browser-based clients of the last decade, presenting a unique set of behaviors, failure modes, and management challenges. Engineering reliability into our mobile applications is as crucial as building reliable servers. Users ultimately perceive the reliability of our products based on the totality of the system, of which the app in their hands has perhaps the greatest impact and will be how your product is judged.
In this report, we have shared a few SRE best practices from our experience:
-
Design mobile applications to be resilient to unexpected inputs, to recover from management errors (however rare), and to roll out changes in a controlled, metric-driven way.
-
Monitor the app in production by measuring critical user interactions and other key health metrics (e.g., responsiveness, data freshness, and crashes). Design your success criteria to relate directly to the expectations of your users as they move through your apps’ critical journeys.
-
Release changes carefully via feature flags so that they can be evaluated using experiments and rolled back independently of binary releases.
-
Understand and prepare for the app’s impact on servers, including preventing known bad behaviors, e.g., the “thundering herd” problem. Establish development and release practices that avoid problematic feedback patterns between apps and services.
We encourage SRE teams at organizations outside Google that haven’t already made mobile a part of their mission to regard supporting mobile applications as part of their core function, and part of the same engagement as the servers enabling them. We believe incorporating techniques like the ones we’ve learned from our experience into management of native mobile applications gives us a strategy, not hope, for building reliable products and services.