Appendix: Troubleshooting Microsoft Advanced Threat Analytics
In most cases, your Microsoft Advanced Threat Analytics (ATA) implementation was completed smoothly and without incident. Perhaps there were some minor issues you needed to overcome during the initial set up, but everything worked as expected after the deployment was finished. However, sometimes in a production environment where you encounter many variants that are particular to the target network infrastructure, issues may arise not only during the implementation but also during regular operation. This is where ongoing support comes in to perform proper troubleshooting of any problems. As enterprise mobility management features expand across your cloud and on-premises networks, it’s crucial that you know how to isolate problems, identify root causes, and quickly resolve issues.
In this appendix, you’ll learn key aspects of properly troubleshooting mobility management issues and cover specifics about troubleshooting ATA.
Troubleshooting flow
Troubleshooting an enterprise mobility management issue can be complex, but you can reduce this complexity by leveraging a structured approach to tackle the problem. This section describes the flow of troubleshooting efforts that can help you resolve problems related to the enterprise mobility management products and features presented in scenarios included in this book.
Note
If you need more information about how to troubleshoot Enterprise Mobility Suite, read Chapter 10 of Enterprise Mobility Suite: Managing BYOD and Company-Owned Devices (Microsoft Press, 2015) at http://aka.ms/EMSdevice/details.
Initial assessment
The first task for successfully resolving an issue is to define the scope of the problem. You can’t start troubleshooting a problem if you can’t determine the scope. You have to ask questions and narrow down the scenario.
For example, a typical enterprise mobility scenario is that a user opens a ticket and describes this problem: “I can’t access the company’s app from my phone.” From the troubleshooting perspective, this is a vague statement, so you must ask questions to correctly narrow the scope of the problem. Here are some sample questions to ask:
![]() When did this problem start?
When did this problem start?
![]() Did this work at any point in the past?
Did this work at any point in the past?
![]() What errors do you receive when you try to access this app?
What errors do you receive when you try to access this app?
![]() Did you recently change anything on this device?
Did you recently change anything on this device?
![]() Does it happen only on this device?
Does it happen only on this device?
![]() Where were you connected while trying to access this app (outside the company network or on the premises)?
Where were you connected while trying to access this app (outside the company network or on the premises)?
![]() If you were outside the company network, were you trying to access this app while connected to Wi-Fi or when using your phone data network?
If you were outside the company network, were you trying to access this app while connected to Wi-Fi or when using your phone data network?
Depending on the answers of each of these questions, you can summarize the problem and narrow the scope based on the information you gathered. For example:
“User Bob opened an incident on Thursday because he is unable to access Blue Yonder Airlines HR App using his mobile device (Windows Phone 8.1) while connected from his phone data network outside of the corporate network. The issue started on Wednesday night, and the user said he didn’t change anything on the device. The user doesn’t have another device to try to access the app, but he is able to log on to the corporate network and access other resources.”
This is a much more comprehensive scenario description, because you are surfacing a lot of information that can help you eliminate some variables about the issue and give you directions on how to collect data and further narrow the potential root causes. After narrowing the scope, make sure to document all relevant information, such as the following:
![]() Device operating system and version
Device operating system and version
![]() User name
User name
![]() Domain of the user
Domain of the user
![]() Error messages
Error messages
Data collection
When troubleshooting hybrid enterprise mobility management scenarios, you must consider where to obtain more detailed information (logs) while the issue is happening. If you collect data to troubleshoot a random issue and the data collection took place while the problem was not happening or in the incorrect log, this data is useless. You’ll find it most useful to document issues as they occur in a working scenario. To find the root cause of an issue, you need to ensure that data is collected with tools running in sync with one another.
Remember not to overlook network device logs in network switches and routers, especially when troubleshooting port-mirroring problems during an ATA deployment.
In scenarios where you need to obtain information from servers located on the premises and the client is coming from the cloud, make sure that the tools are actively collecting data at the same time. In some troubleshooting scenarios, you might have to increase the logging capability on the server, which can have an impact on the server’s performance. Make sure to discuss the data-collection plan with the entire team responsible for maintaining the infrastructure and also define a mitigation plan to reduce the likelihood that the server will be negatively affected by this process.
Be aware that data collection for enterprise mobility scenarios also can introduce different challenges when compared to a traditional IT environment, such as these:
![]() Data-collection procedures and tools in the mobile device will vary according to the vendor.
Data-collection procedures and tools in the mobile device will vary according to the vendor.
![]() Data is always encrypted in transit, which means network traces might not be all that useful.
Data is always encrypted in transit, which means network traces might not be all that useful.
Data analysis
After obtaining the data from all nodes involved, the first step is to ensure that the data is in sync. Save this data in a secure location with restricted access. Remember that in an enterprise mobility scenario, personal information might be embedded in the logs that were collected. You must keep users’ personal data safe during the entire troubleshooting process. Once you have the data, you need to consider the following aspects of the data to be analyzed:
![]() Do I need to parse this data in order to read it?
Do I need to parse this data in order to read it?
![]() Do I need any special tool to read this data?
Do I need any special tool to read this data?
![]() If the amount of data is too big, how can I filter and analyze only what I need?
If the amount of data is too big, how can I filter and analyze only what I need?
Answers for these questions will vary according to the data itself. For the technologies that were covered in this book, most of the data can be viewed using built-in tools included with Microsoft Windows, such as Event Viewer and Notepad (to review text logs). Last but not least, understand that the initial data analysis might not indicate the root cause of the issue, but it should give you enough information to help you to build an action plan, which is the next phase.
Action plan
At this point, you should have formed a good hypothesis about why the issue is happening, based on the scope of the problem and the data you analyzed. Based on this hypothesis, you will create an action plan to try to resolve the problem. After building your action plan, make sure to ask yourself the following questions before implementing the plan:
![]() Will this action plan cause any service interruption (such as restarting the server)?
Will this action plan cause any service interruption (such as restarting the server)?
![]() Is it necessary to validate this plan in a lab environment before implementing it in production?
Is it necessary to validate this plan in a lab environment before implementing it in production?
![]() Does this action plan introduce any changes to the production environment, such as installing new software or updates?
Does this action plan introduce any changes to the production environment, such as installing new software or updates?
![]() Does this action plan need to be implemented outside of normal business hours?
Does this action plan need to be implemented outside of normal business hours?
Based on the answers to these questions, you’ll understand what your next step should be. If you identify that this action plan might cause service interruptions, make sure to have a mitigation plan for that. Also, make sure to have a backup plan to roll back the server/workstation or device to the state it was before applying the plan. Last but not least, ensure that the resolution actions are done one by one and not several at a time. Changing multiple options at the same time can make it difficult to know which change really resolves the problem.
Important
If your action plan fails to resolve the problem, you must go back to the data-collection and data-analysis phases. Evaluate the new data, compare it with the previous data, and verify the differences. Build your new hypothesis for the problem, and create a new action plan. Sometimes this process involves multiple rounds—it all depends on the complexity of the issue.
Validate the behavior and archive the ticket
After implementing the action plan, you need to validate the behavior to see if the issue was resolved. If the issue was resolved, document the effective actions that were taken. Usually after this validation, you will be ready to archive the ticket; however, in some circumstances, you might need to leave it open for monitoring purposes.
If you are dealing with a random issue that occurs only in some circumstances and the user is unable to validate if it was solved, you will need to keep the ticket open. In scenarios like this, you might want to set up the system to collect more data, just in case the issue happens again.
Troubleshooting an ATA installation
Assuming that all prerequisites to install ATA Center and ATA Gateway are in place (review Chapter 4, “Introducing Microsoft Threat Analytics,” for more information), the installation should be trouble-free. If you are deploying ATA in a physical-switch infrastructure, make sure to follow the recommendations from the switch vendor for creating port mirroring. Usually, the switch vendor also has specific troubleshooting guidelines that vary depending on the switch model.
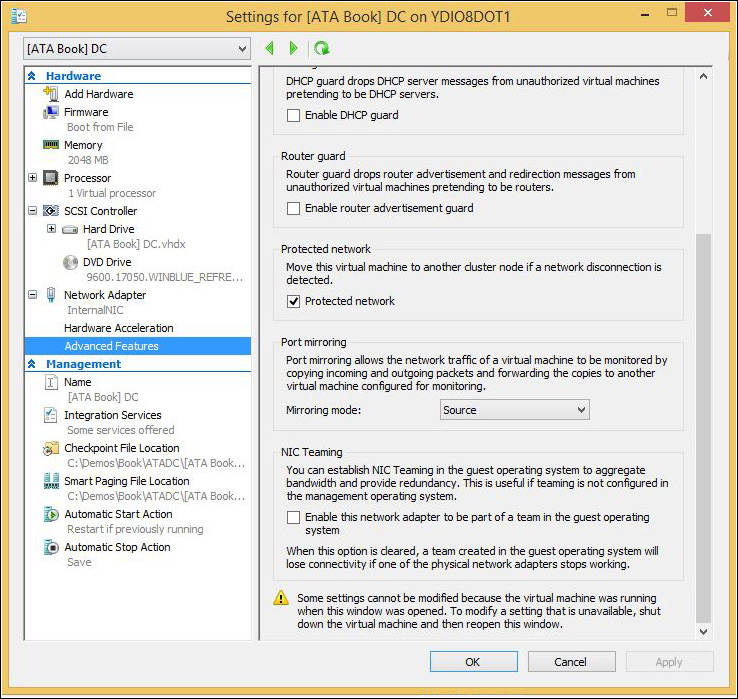
If you are deploying ATA in a Hyper-V environment, make sure that the domain-controller virtual machine’s virtual network port-mirroring mode is configured to be the source, as shown in Figure A-1. In this deployment, the ATA Gateway virtual machine must be configured as the destination.
More Info
The following blog post explains in more detail how to configure Hyper-V port mirroring when the traffic you want to capture is from a physical machine (source) and the machine that will do the capturing is a virtual machine (destination): http://blogs.technet.com/b/networking/archive/2015/01/06/setting-up-port-mirroring-to-capture-mirrored-traffic-on-a-hyper-v-virtual-machine.aspx.
In ATA Center, at the end of a successful installation, the log file Microsoft Advanced Threat Analytics Center_XXXXXXXXX_1_MsiPackage (where X is the date), located one level above %temp%, will show a summary of the installation. The following indication (in bold) includes confirmation that it was successfully installed:
Property(S): INSTALLLEVEL = 1
Property(S): SOURCEDIR = C:ProgramDataPackage Cache{2EB30FFB-190A-40D7-9522-
FB101E0F2DFD}v1.4.2457.4623
Property(S): SourcedirProduct = {2EB30FFB-190A-40D7-9522-FB101E0F2DFD}
Property(S): ProductToBeRegistered = 1
MSI (s) (5C:EC) [08:58:59:040]: Note: 1: 1707
MSI (s) (5C:EC) [08:58:59:057]: Product: Microsoft Advanced Threat Analytics Center -- Installation completed
successfully.
MSI (s) (5C:EC) [08:58:59:058]: Windows Installer installed the product. Product Name:
Microsoft Advanced Threat Analytics Center. Product Version: 1.4.2457.4623. Product
Language: 0. Manufacturer: Microsoft. Installation success or error status: 0.
If the installation fails, you should open the same log file, go all the way to the end of the file (Ctrl+End) and track back to see where it fails. The other log files that are relevant while troubleshooting installation are these:
![]() Microsoft Advanced Threat Analytics Center_XXXXXXXX_1_MongoDBPackage Contains information about the MogoDB installation, which by default is MongoDB 3.0.5 2008R2Plus SSL (64 bit).
Microsoft Advanced Threat Analytics Center_XXXXXXXX_1_MongoDBPackage Contains information about the MogoDB installation, which by default is MongoDB 3.0.5 2008R2Plus SSL (64 bit).
![]() Microsoft Advanced Threat Analytics Center_XXXXXXXX_3_IisUrlRewritePackage Contains information about URL Rewrite1 Package installation.
Microsoft Advanced Threat Analytics Center_XXXXXXXX_3_IisUrlRewritePackage Contains information about URL Rewrite1 Package installation.
1 For more information about URL Rewrite, see http://www.iis.net/downloads/microsoft/url-rewrite.
Important
For ATA Gateway, the relevant logs are Microsoft Advanced Threat Analytics Gateway_XXXXXXXX.log and XXXXXXXXXX_MsiPackage.log.
Post-installation troubleshooting
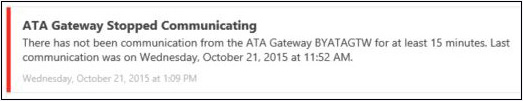
After installing ATA Gateway and ATA Center, the first steps are to verify if they are in sync, verify if the services are running, and verify that they can communicate with each other and communicate with the domain controller. If you open ATA Console and you see an error message similar to the one shown in Figure A-2, you need to perform these verifications right away.
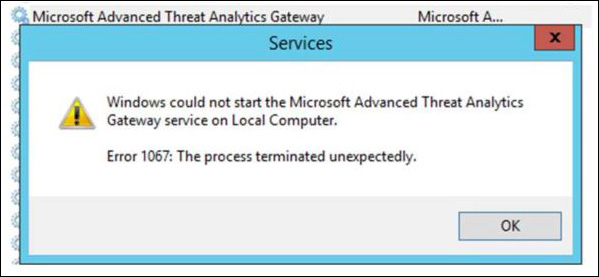
The first troubleshooting step in this case is to verify that the Microsoft Advanced Threat Analytics Gateway service is running on ATA Gateway. To do that, click the Windows button on the taskbar, type services.msc, and press Enter. If the service is not running, click Start and see if the issue is resolved. If you are unable to start the service and receive an error message similar to the one shown in Figure A-3, you will need to continue troubleshooting.
This is a post-installation error. In scenarios like this, you need to review the log file located at %programfiles%Microsoft Advanced Threat AnalyticsGatewayLogs. In this folder, look for a file called Microsoft.Tri.Gateway-Errors.log and open it using a text editor such as Notepad. Search for the keyword error, and if you have multiple entries, try to correlate the date and time you received the error message (shown in Figure A-2) with the date and time in the log file. In this case, the problem is shown in the following example in bold:
2015-10-21 11:40:45.1095 2288 5 75992705-d0a8-4908-bcfa-de068d7ba6e4 Error [DirectoryServicesClient] Microsoft.Tri.Infrastructure.ExtendedException: Failed to
connect to domain controller [DomainControllerDnsName=bydc01.corp.blueyonderairlines.com] ---> System.
DirectoryServices.Protocols.LdapException: The supplied credential is invalid.
The Microsoft Advanced Threat Analytics Gateway service is not starting because it was unable to connect with the domain controller. Per the error message, the root cause of the problem is related to incorrect credentials.
To resolve this issue, you must re-enter the credentials for the ATA account that was created in Active Directory. Refer to Chapter 5, “Implementing Microsoft Advanced Threat Analytics,” for more information about the requirements for this account. Note that error messages in the log file that refer to “credential is invalid” can also appear in cases where the account is expired, locked out, or disabled because of login time restrictions. Make sure to review all these possibilities while troubleshooting this error.
Tip
You can also rename the existing error file. If you do that, a new error file will be created automatically the next time the service tries to start. By looking at a new error-log file, you might find it easier to detect where the issue resides.
Troubleshooting ATA operations
After deploying ATA, you start the process of monitoring activities and taking actions based on ATA suggestions. The question that might come up while monitoring alerts on ATA when nothing is happening is, “Is my network really that secure, or is ATA not logging the attacks?” In other words, “How can you validate that ATA is behaving as it should?”
If ATA was correctly installed and the network infrastructure is working properly, ATA is monitoring your network and functioning correctly. It will trigger an alert only if necessary. Understand that if ATA, at any point, is unable to communicate with the domain controller, it won’t be able to trigger alerts for attacks. One way to validate the configuration to see if ATA is communicating with the domain controller is by using the Microsoft Network Monitor tool.
Complete the following steps to perform this verification:
1. On the ATA Gateway, download Network Monitor 3.4 x642 from http://aka.ms/netmon3 and install it.
2 Network Monitor 3.4 is not supported on Windows Server 2012; however, for the purpose of this example, it is safe to use. If you need the latest experience in packet analyzes, refer to Microsoft Message Analyzer here: http://www.microsoft.com/en-us/download/details.aspx?id=44226.
2. Once the installation is complete, launch Network Monitor.
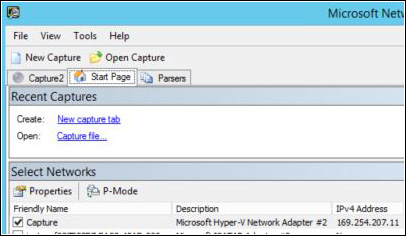
3. On the Start page, select the network interface card that it is used for port mirroring, which is called Capture (as it was renamed in Chapter 5). This interface should have an Automatic Private IP Addressing (APIPA) number as shown in Figure A-4.
4. Click New Capture, and then click Start.
5. Go to a workstation, and sign in with a regular domain account.
6. Go back to ATA Gateway and, on the Network Monitor console, click Stop.
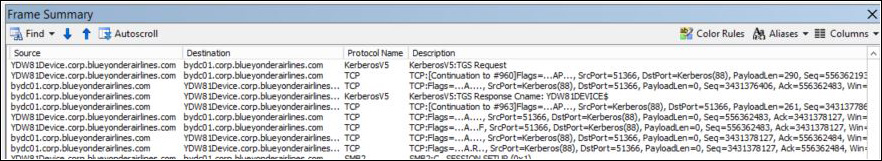
ATA Gateway should be able to see the authentication traffic between the workstation and the domain controller, similar to the information shown in Figure A-5.
Tip
If you want to safely simulate an attack to verify if ATA is correctly triggering alerts, follow the instructions in this post: http://aka.ms/atasimulation.
In a scenario where ATA isn’t working properly, you won’t be able to see this traffic. Your first troubleshooting step is to make sure port mirroring3 is working properly. If you can’t see this traffic, it is because there is an issue in this configuration.
3 Here’s an example from Juniper Networks on how to troubleshoot port mirroring in its switches: http://www.juniper.net/documentation/en_US/junos15.1/topics/task/troubleshooting/port-mirroring-qfx-series.html.
Another approach to validate if ATA is working properly is to use Performance Monitor to monitor the following counters:
![]() ATA Gateway
ATA Gateway
![]() NetworkListener Captured Messages / sec
NetworkListener Captured Messages / sec
![]() EntitySender Network Activities
EntitySender Network Activities
![]() ATA Center
ATA Center
![]() EntityReceiver Entity Batch Block Input Items/Sec
EntityReceiver Entity Batch Block Input Items/Sec
Tip
For more information about these counters, see the section “Validate Installation” (step 5) in this article: https://technet.microsoft.com/en-us/library/dn707704.aspx.
Hardware maintenance
Another troubleshooting scenario you might experience is ATA not triggering new alerts after you made changes to the network interface card—for example, after replacing the card. In this scenario, if you review the log file you might see an error similar to the following:
Error [NetworkListener] Microsoft.Tri.Infrastructure.ExtendedException: Unavailable network
adapters [UnavailableCaptureNetworkAdapterNames=NIC] at Microsoft.Tri.Gateway.Collection.Network.
NetworkListener.CreateEtwMessagePusher(IMessageHub messageHub)
You can see in bold in the preceding log that ATA is unable to find the network adapter called NIC that’s used to capture traffic. In this case, you need to make sure ATA knows which network interface card will be used to capture traffic. Go to ATA Gateway Configuration and, under Capture Network Adapters, select the correct adapter.
Unable to access ATA Console
You need to have access to ATA Console to monitor ATA alerts. If you can’t access the console, you won’t be able to see what’s happening. Not having access to the console doesn’t mean ATA is not capturing traffic, because ATA Console is basically a webpage hosted on Internet Information Services (IIS) that displays only captured traffic.
The error message you receive when trying to access the console is the first step to identifying where the troubleshooting process should start. Let’s use as an example the error shown in Figure A-6.
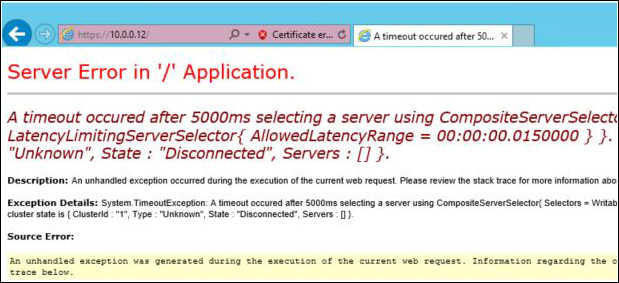
This is a timeout error. In other words, ATA tried to access the website and didn’t receive an answer in a timely manner. Complete the following steps to troubleshoot and resolve this error:
1. In ATA Center, open Server Manager, click Tools, and click Internet Information Services (IIS) Manager.
2. On IIS Manager, expand Sites and click the Microsoft ATA Console site.
3. In the Actions pane on the right, under Manage Website, verify that the Start option is unavailable (grayed out). If it is, the website is currently started. Click Restart to restart the website.
4. Try to open ATA Console again.
5. If the issue persists, open Windows PowerShell, type iisreset, and press Enter. Wait until you see the output message that says, “Internet services successful restarted.”
6. Try to open ATA Console again.
Errors similar to the one shown in Figure A-6 can also indicate that the ATA service is not running. This would also cause problems accessing ATA Console, so make sure you verify that the ATA service is running using the services.msc tool.
Unable to start ATA Center or ATA Gateway
Earlier in this chapter, we gave an example of a scenario where the ATA service was not starting and was presenting the error message shown in Figure A-3. In that case, the problem was caused by ATA not being able to connect with the domain controller. However, if ATA Gateway is not able to access ATA Center, it will also trigger the same generic error message.
To verify the root cause of the issue, you need to review the Microsoft.Tri.Gateway-Errors.log log file. When ATA Gateway is unable to connect with ATA Center, the log will show an error similar to the following:
c4ca1680-b50d-4ecd-b179-5720b94faef0 Error [AsyncResult] System.ServiceModel.
EndpointNotFoundException: Could not connect to net.tcp://10.0.0.11:443/
IMonitoringEngine. The connection attempt lasted for a time span of 00:00:21.0133806.
TCP error code 10060: A connection attempt failed because the connected party did not
properly respond after a period of time, or established connection failed because
connected host has failed to respond 10.0.0.11:443. ---> System.Net.Sockets.
SocketException: A connection attempt failed because the connected party did not properly respond after a
period of time, or established connection failed because connected host has failed to respond 10.0.0.11:443
An important part of this log is shown in bold. Notice that in this case, ATA Gateway is having exactly the same problem I demonstrated in the previous section when trying to access ATA Console. One possible solution will be to use the same solution applied in the previous section. However, in other scenarios you might face the same error message shown in the log file. One example is when there is a network device (such as a firewall) blocking the communication between ATA Gateway and ATA Center on this port.