1
ReMo: A Recommendation Development Model for Software Process Improvement Based on Correlation Analysis
SUJIN CHOI1, DAE-KYOO KIM2*, SOOYONG PARK3
1 Graduate School of Information and Technology, Sogang University, Seoul, South Korea
2 Department of Computer Engineering, Sogang University, Seoul, South Korea
3 Department of Computer Science and Engineering, Oakland University, Rochester, Michigan, USA
Email: [email protected], [email protected], [email protected]
Abstract
Continuous software process assessment and improvement are integral to the success of business objectives. Process assessment identifies the strengths and weaknesses in a software process and produces recommendations for planning improvements. The quality of recommendations is critical for constructive improvement planning and implementation. While widely practiced assessment models (e.g., CMMI, SPICE) address the identification of strengths and weaknesses and emphasize the importance of recommendations, they lack in providing concrete methods for developing quality recommendations. This leads to ad-hoc practices in building recommendations which often result in poor quality of recommendations as witnessed in a review of the current practice. To address this problem, we present ReMo, a novel recommendation development model that enables systematic development of quality recommendations through rigorous analysis of assessment findings. In ReMo, recommendations are developed through three phases: i) correlations analysis of findings and improvement package development, ii) review of improvement packages and refinement, and iii) recommendation development. ReMo is evaluated for its quality as a process and the quality of its outcomes through twelve industry case studies from various domains. The evaluation proves the effectiveness and usefulness of ReMo in building recommendations with room for improvement in its efficiency. The evaluation also witnesses the quality of resulting recommendations in terms of concreteness and comprehensiveness.
Keywords: Process assessment, process improvement, recommendation, software process
1.1 Introduction
Software process improvement (SPI) has been widely practiced in industry for its proven impact on product quality, development cost, and time-to-market [1-3]. A typical process of SPI is (1) identifying strengths and weaknesses of the current process practice in the target organization, (2) developing improvement recommendations to address identified weaknesses and encourage strengths, (3) building improvement plans to accommodate recommendations, and (4) implementing the plans by taking necessary actions [4,5]. Recommendations are requirements for process improvement and drive the development of improvement plans. That is, the success of software process improvement highly relies on the quality of recommendations [6,7]. However, there exist few established methods for constructing quality recommendations. The standard CMMI appraisal method for process improvement (SCAMPI) [8] and ISO/IEC 15504 [9], which are widely used assessment methods, discuss recommendations, but only marginally as an optional outcome. IDEAL [10], a process improvement cycle guideline, suggests brainstorming sessions in the diagnosing phase for building recommendations, but no concrete method is provided.
In the current practice, developing recommendations remains largely ad hoc and differs by individual practitioners, projects, and organizations. More specifically, the following problems are observed from field interviews involving ten process experts and reviews of twelve assessment reports:
- There exist few methods defined for building recommendations. This makes it difficult for process engineers to develop recommendations and, as such, results in less productivity and performance in SPI process.
- Low quality of recommendations. Most recommendations produced in the current practice are a simple interpretation of findings (problems) and lack concrete solutions.
- The current practice focuses on only weaknesses, while paying little attention to strengths which provide another insight for improvement from a positive perspective.
The impact of these is not limited to the quality of recommendations, but expands to the organization as a whole in coping with the ever-changing business environment and achieving their business objectives, and further affects improvement efforts afterwards.
In this work, we present ReMo (Recommendation Model), a novel recommendation development model that enables systematic development of quality recommendations in SPI through comprehensive analysis of findings, including both weaknesses and strengths and their correlations in various perspectives. Based on the prior studies on success factors for SPI [11-14] and organizational changes [15,16], interviews with practitioners, and our field experience, we define four views – process assessment model view, business value view, software life cycle view, and organizational view – to be considered in recommendation development. Recommendations are developed in three phases. In the first phase, findings are analyzed for their correlations based on related work products and grouped to identify improvement packages which form a basis for defining recommendations. In the second phase, the identified packages are reviewed and refined by the four views. In the third phase, concrete recommendations are developed upon refined packages.
We evaluate ReMo through twelve industrial case studies from various domains. including enterprise system integration, automotive, and telecommunication. There are 15 process engineers, including 10 professional consultants from three different consulting firms, involved in the case studies. Case studies are conducted based on the guidelines by Runeson and Höst [17]. The evaluation is twofold – process evaluation and outcome evaluation. The process evaluation evaluates the productivity and performance of process engineers using ReMo and their acceptance of ReMo. We use the technology acceptance model (TAM) [18, 19] for the process evaluation. The outcome evaluation evaluates the concreteness and comprehensiveness of the recommendations produced by ReMo by comparing them to those produced by the current practice. This work extends the preliminary work presented at the International Conference on Software and System Process Improvement [20]. The extension includes extensively refined ReMo, nine more industrial case studies, and feedback from the field. ReMo is refined by i) matrix-based analysis of finding correlations, ii) detailed steps for refining improvement packages, and iii) a concrete method for building recommendations.
This chapter is organized as follows. Section 1.2 motivates the work, Section 1.3 gives an overview of related work, Section 1.4 describes ReMo, Section 1.5 conducts case studies using ReMo, Section 1.6 evaluates the quality aspects of ReMo, and Section 1.8 concludes the paper with future work.
1.2 Motivation
The process improvement process starts with identifying assessment findings (e.g., strengths, weaknesses). Assessment findings are identified by process areas through a review of the current practice, process documentation, and practitioners’ interviews. Based on identified findings, recommendations are built for planning improvement actions. Figure 1.1 shows the general process of process improvement. However, in the current practice, building recommendations from findings is left largely undefined and heavily depends on individual experience, which makes it difficult for novice process engineers and even for experienced ones to practice. More importantly, there is no quality control over recommendation development.

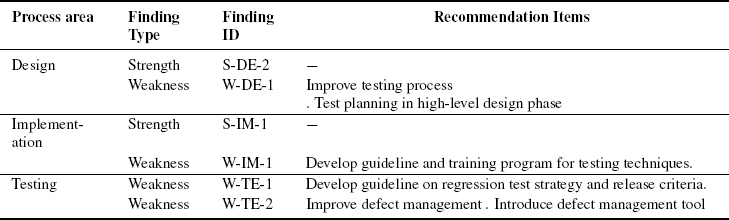
Figure 1.1: Process of improvement process.
As an example, consider the findings and recommendations in Table 1.1 from the field. The recommendations in the table show that they are directly derived from findings without any advice and simple rewriting of the findings in the reverse way. For instance, the recommendation R1 “Identify risks during project planning” is directly derived from the finding F1 “Lack of risk identification at project planning phase” and it is simply reworded in the reverse way without providing any concrete suggestion as to how the problem identified in the finding can be addressed. A similar observation is made for other recommendations in the table. More concrete and constructive recommendations should be developed. It can be done by considering the correlations of findings. For example, if F1 and F2 are considered together, it can result in a recommendation such as “During project planning, involve test manager to identify project risks and develop mater test plan in consideration of identified risks” which is more concrete and constructive.
Table 1.1: Recommendation examples in current practice.
| Process Areas (P) | Findings (F) | Recommendations (R) | |||
| P1 | Project Planning Process | F1 | Lack of risk identification at project planning phase. | R1 | Identify risks during project planning |
| P2 | Verification Process | F2 | No project master test plan is developed. | R2 | Develop master test plan |
| P3 | Project Monitoring and Control Process | F3 | Lack of exit criteria and formal review per milestone. | R3 | Establish exit criteria and formal review on development milestone |
| P4 | Requirement Management Process | F4 | Lack of requirement change control activity. | R4 | Reinforce requirement change control activity |
We reviewed the recommendation development practice and the quality of recommendations in twelve process improvement assessment projects in industry provided by ten process experts who are all certified process assessors and have 15 to 22 years of industry experience. In the review, we observed similar practices to the one shown in Table 1.1 and are convinced that the practice shown in the table is pervasive in the field.
Table 1.2 shows the projects reviewed.
Table 1.2: Reviewed projects.
| Project ID | Reference Model | Process Areas | Findings | Recommendations |
| P1 | CMMI Level 2 | 6 | 18 | 25 |
| P2 | CMMI Level 2 | 6 | 17 | 19 |
| P3 | CMMI Level 2 | 7 | 38 | 35 |
| P4 | CMMI Level 2 | 6 | 20 | 20 |
| P5 | CMMI Level 3 | 17 | 145 | 145 |
| P6 | CMMI Level 4 | 19 | 128 | 128 |
| P7 | CMMI Level 2 | 6 | 59 | 101 |
| P8 | SPCMa Level 2 | 10 | 47 | 53 |
| P9 | CMMI Level 4 | 19 | 65 | 57 |
| P10 | CMMI Level 2 | 6 | 26 | 26 |
| P11 | A-SPICEb Level 2 | 12 | 23 | 24 |
| P12 | SPCM Level 2 | 10 | 21 | 22 |
aSPCM: Software Process Certification Model [21]
bA-SPICE: Automotive SPICE (based on ISO/IEC 15504) [22]
The current practice leads to the problems mentioned in Section 1.1, and from these problems we identify the following quality requirements for recommendations:
- Recommendations should be detailed enough to provide concrete solutions;
- Related findings should be considered together across process areas to provide comprehensive solutions.
The first requirement defines concreteness, while the second one defines comprehensiveness. With respect to these requirements, we conducted a focused analysis of the recommendations from the reviewed projects in Table 1.2 in terms of concreteness and comprehensiveness. Based on the practice characterization scheme in the CMMI assessment method [8], they are scaled “largely” if 60% or more recommendations in the project are found concrete/comprehensive, “partially” if 30% or more but less than 60%, and “little” if less than 30%. In the review, we took a remissive review where we considered a recommendation as concrete if it has any additional information than the information described in the finding and comprehensive if it involves information from other findings.
Figure 1.2 shows the results of the review. As shown in the graphs, more than half of the projects suffer from poor quality on both concreteness and comprehensiveness, which raises the need of solutions for improving the quality of recommendations in the current practice.
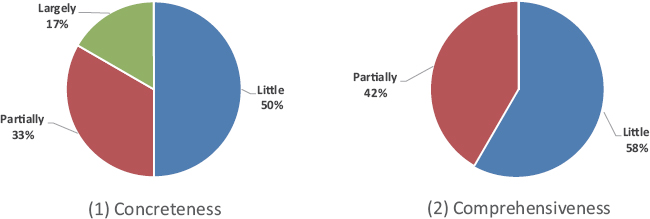
Figure 1.2: Summary of recommendation review results.
1.3 Related Work
A recommendation is a compilation of findings described in a way to improve the current practice. ISO/IEC 15504 [9] and CMMI [23] are widely used process reference models for evaluating process practices and guiding SPI practices. In process assessment, CMMI uses SCAMPI [8] as supporting assessment methods for determining the level of capability, while ISO/IEC 15504 has its own built-in assessment method defined in [9]. The roles of the assessment methods are to identify weaknesses and strengths and produce recommendations which are required in IDEAL [10], an improvement cycle model for improvement planning. While the existing assessment models provide detailed guidelines for identifying findings, the discussion on recommendations is very limited. CMMI and ISO/IEC discuss recommendations, but only conceptually as optional outcome. They lack concrete guidelines for developing recommendations. ReMo in this work addresses this problem by providing a systematic approach for developing recommendations.
Several researchers have proposed using the practice descriptions in process reference models to identify improvement recommendations. Mejía et al. [24] presented the SMARTSPI model which selects a process model from reference models as external best practices and analyzes it to produce a set of recommended practices. Shrestha et al. [25] proposed a software-mediated process assessment method for IT service management. In the method, organizational practices are assessed via an online survey, and recommendations are generated from the knowledge base DB. The knowledge base DB contains several process improvement models such as ISO/IEC 15504 and ITIL (information technology infrastructure library) [26]. Laksono et al. [27] presented an implementation of software test process assessment and improvement using TMMi (test maturity model integration) [28] and TAMAR [29]. TMMi is a set of best practices for software testing, and TAMAR is the official TMMi assessment method. The improvement recommendations in their work are prepared for the practices with weaknesses. However, recommendations are identified exactly as the same as the subpractice description in TMMi without analysis on assessment results. Although process reference models are generally adopted as best practices by organizations, the recommendations made from process reference models are not concrete and specific enough to guide a particular organization.
For organization-aware recommendations, several researchers use quality function deployment (QFD) [30], which is a correlation technique in process improvement planning for relating customer needs to designing, development, engineering, manufacturing, and service functions. Hierholzer et al. [31] used QFD for selecting mission-critical improvement proposals. Sun and Liu [32] presented a QFD framework for business-oriented process improvement based on CMMI. Business requirements and practices are analyzed for correlations, and improvement actions are identified based on correlations and prioritized by business values for each process area.
Some researchers introduced crowd-sourcing approaches for making improvement recommendations supported by experts’ expertise. Raza et al. [33] proposed a web-based tool for analyzing software developer’s personal performance and making recommendations for improvement actions. Recommendations are suggested and prioritized by invited experts as individual contributors. Farooq et al. [34] utilized blockchain technology for mediating and coordinating between improvement seekers and process experts. Blockchain technology is attractive for both parties in that it enables secure transactions among participants without any central trusted authority [35]. However, it still lacks a systematic procedure to produce improvement recommendations, and the quality of recommendations has to largely depend on experts.
Other assessment methods (e.g., [36-42]) focus on lightweight assessment for small organizations or self-assessment for individual developers with little attention to recommendations. Villalón et al. [43] presented action packages which are templates for building improvement recommendations from organizational and management views. However, no concrete method is described as to how the views should be considered. Harjumaa [44] presents a set of process patterns which provide general guidelines for improving the inspection process. The patterns to be applied are decided based on the assessment results from the inspection process. Our work can benefit from their patterns in building recommendations specific to the inspection process. Haase [45] uses a neural network method for identifying improvement points (weaknesses) that are critical for the organization to achieve the next maturity level. He uses process assessment data collected from other similar business units. Gorschek and Wohlin [46] presented DAIIPS, a method for prioritizing improvement proposals and identifying their dependencies to aid software process improvement efforts. The method is designed for small organizations that have limited resources to conduct full scale software process improvement. Improvement issues are divided into packages small enough to be managed and prioritized. The recommendations produced in our work can be used as input to their work.
Several studies emphasize the importance of understanding dependency among practices for effective process improvement. Monteiro et al. [47] identified dependency among process areas of CMMI at each maturity level in an effort to identify the impact on the dependencies of maturity level 2 when a process area of maturity level 3 is introduced. Chen et al. [48] proposed a practice-level dependency model for 6 process areas in CMMI maturity level 2 where practice dependency is identified by workflow of work products. Both studies, however, do not discuss how identified dependencies can be used for process improvement. Calvo-Manzano et al. [49] present a method for identifying dependency among process areas in CMMI-ACQ [50] and suggest an implementation sequence of process areas accordingly. Arcilla et al. [51] proposed an implementation sequence of service management processes defined in ITIL by identifying dependencies and clusters of strongly connected processes. What these studies have in common is that dependency decisions are made solely based on the description of the reference model itself, and they are not utilized for producing and improving recommendations.
1.4 Recommendation Development Model: ReMo
Business orientation, management commitment, staff involvement, process improvement guidelines and mentoring, and automation and tools are major success factors to be considered in process improvement [11-14,52]. Organizational and business aspects are also considered important for organizational changes [15,16,52]. Considering these factors and the practitioner needs described in Section 1.2, we establish the following strategies in building improvement recommendations:
- (a) Justify the importance of the change to be made and its impact. Software process is human-centric and, thus, it is important to convince people about the change to be made [53].
- (b) Maximize utilization of strengths and resources of the organization. Strengths are proven practices to be exercised throughout the organization and effective use of existing resources (e.g., human resources, software tools) helps in planning practical improvement.
- (c) Provide concrete and detailed guidance as to what to do, why to do, how to do, who to do, and when to do.
- (d) Suggest a set of correlated improvement actions for synergistic effectiveness. Process activities are interrelated to each other by nature, which should be taken into account in improvement planning to avoid overlapping, conflicting, and incomplete action items.
- (e) Follow the guidance of the chosen reference model. For instance, a capability-based model (e.g., CMMI, ISO/IEC 15504) describes a necessary foundation for the next level.
ReMo uses both strengths and weaknesses identified from process assessment as a base for developing recommendations. They are analyzed through three phases – correlation analysis, improvement package refinement, and recommendation development. As each phase is exercised, improvement packages (IPs), a preliminary form of recommendations, are formed and refined. Figure 1.3 shows the process of ReMo. Findings are related via underlying activities and their work products across process areas, and related findings should be considered together to increase synergistic effects. Correlation analysis identifies correlations of findings and defines initial IPs which establish a basis for constructing recommendations. Correlation analysis helps implement the strategies (a) and (d) in the above.
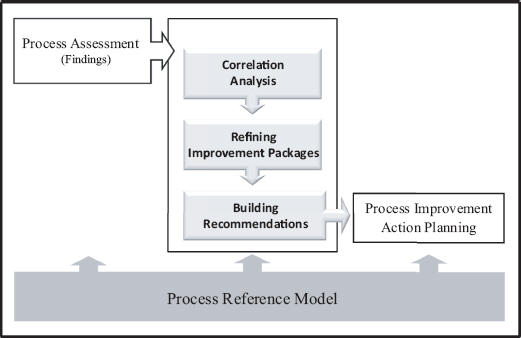
Figure 1.3: ReMo.
The IPs resulting from correlation analysis are refined by four views – organizational view, software life cycle view, assessment model view, and business value view – based on the aforementioned success factors, comments from practitioners, and our field experience. As the implementation of an IP requires resources, the organizational view reviews IPs from a resource perspective to increase utilization of existing resources in the organization [14,15], which helps implement the strategies (b) and (c). The software process is practiced per the selected software life cycle in the organization [54] and depending on the life cycle, recommendations may be changed. For instance, continuous integration of build and test is more emphasized in an agile process, while designing is more focused in a waterfall process. The software life cycle view reviews temporal relationships of practices in an IP with respect to software life cycle, which supports the strategy (c). An organization concerning process improvement uses a process reference model and its accompanying assessment methods, and any improvement effort in the organization should observe the model [10]. The assessment model view reviews an IP based on the guidance (e.g., practice sequence) of the underlying process reference model used in the organization, which supports the strategy (e). Every organization has its business objectives, and improvement efforts should be aligned with the business objectives [13,16,43]. The business value view reviews an IP for business values and prioritizes IPs per business value. This helps implement the strategy (a).
During the analysis of each view, findings in an IP may be removed or merged and new findings may be identified and added to the IP, which refines the IP. Refined IPs are further reviewed to ensure that they have their own standing point and business value. The IPs that do not have a strong standing point or have low business value are subject to be merged with other IPs. Recommendations are constructed based on the final IPs. One or more recommendations may be developed per IP. An abstract recommendation is first drafted describing the purpose of the recommendation. The abstract recommendation is then elaborated to a concrete recommendation by reviewing individual findings in the IP and defining recommendation seeds for each finding. Finally, related recommendation seeds are synthesized and evolve to a recommendation item in the final recommendation.
1.4.1 Correlation Analysis
Findings from process assessment are analyzed to identify their correlations and produce IPs. Figure 1.4 shows the activities of correlation analysis. Findings are analyzed using a symmetric matrix whose row and column have the same list of findings. The finding on each column is analyzed against all other findings on the row to identify its correlations to other findings. A column that has significant correlations becomes a candidate IP.

Figure 1.4: Correlation analysis.
A process reference model is defined in terms of process areas and each area defines a set of activities to achieve the goal of the area. Findings are identified for each activity in a process area. An activity may not have any finding identified. Adversely, several findings may be identified for a single activity if the activity is practiced inconsistently in different projects. Table 1.3 shows a partial list of findings from a case study (ProjectD) conducted in this work. The list involves 13 findings across six process areas. We use the list as a running example.
Table 1.3: Example findings of assessment.
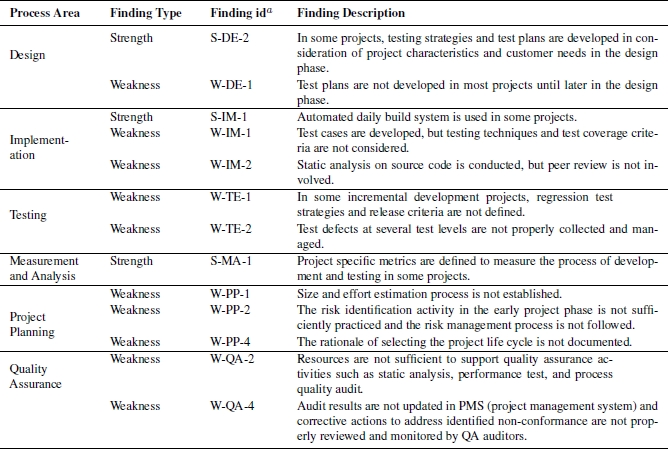
a T-PA-NUM: T is a finding type – S (strength) and W (weakness), PA: an abbreviation of process area, NUM: a sequential number
1.4.1.1 Analyzing Finding Correlations
Process areas are related to each other via input-output relationships of work products of their underlying activities. Two activities are correlated if one task uses as input the outputs of the other task. As an example, consider tasks “Identify Project Risk” in the Project Planning process area and “Establish Test Plan” in the Quality Assurance process area. In the planning test in the later task, the risks identified in the former task need to be considered to reduce the impact of the risks. Figure 1.5(a) illustrates the input-output relationships of the tasks. An input-output relationship may be bi-directional if the tasks involved in the relationship are complementary to each other. For example, consider Figure 1.5(b). In the figure, the task “Develop QA Plan” needs Project Plan as input, which is the output of “Establish Project Plan” for scoping and scheduling audit, and in turn “Establish Project Plan” needs QA Plan produced by the “Develop QA Plan” task to adjust to other project activities (e.g., configuration audit).

Figure 1.5: Correlated tasks via work products.
For a given input of identified findings and the underlying process reference model, Algorithm 1 defines the operational process of finding correlations.
Lines 1–3 define the input and output of the operation. Lines 5–6 identify the activities that are associated with the findings in the process reference model and define sets of input work products and output work products that are associated with the activities. Lines 10–17 identify the workflow of work products that are associated with the activities identified in lines 5–6 and correlate two findings if the work products of one finding’s activity are in an input-output relationship with the work products of the other finding’s activity. The final set of correlated findings results in line 18.
Figure 1.6 depicts the relationships of findings, process practices, and process areas and how correlated findings are identified. In the figure, the findings W-DE-1 and S-DE-2 of the activity DE.3 are related to the finding W-PP-2 of the activity PP.6 through the relationship of the Design Process area and the Project Planning Process area. Every finding in the design process is reviewed against the findings in the project planning process (or vice versa) to identify correlations. An activity has input and output relationships with other activities via their work products in the work product flow. So are their findings. In the workflow of CMMI [23], which is the base reference model used in the case study, the activity PP.6 (“project risk management planning”) and the activity DE.3 (“project test planning”) have an input-output relationship where the work products of PP.6 are input to DE.3. Thus, their corresponding findings W-PP-2 and S-DE-2 inherit the input-output relationship of PP.6 and DE.3.

Figure 1.6: Identifying finding correlations.
Figure 1.7 shows the correlations of the findings in Table 1.3. The matrix in the figure is symmetric where the row and column have the same set of findings. For each pair of findings in the row and column, the relationship type is determined. Relationships are categorized into input, output, and input-output. A finding pair has an input relationship if the underlying activity of one finding uses the work products produced by the underlying activity of the other finding. Similarly, an output relationship is identified if the work products produced by the underlying activity of one finding are consumed by the underlying activity of the other finding. When both relationships are present, an input-output relationship is established.
For example, in Figure 1.7, the finding S-DE-2 in the column has seven relationships with other findings in the row (excluding itself). A relationship marked i denotes an input relationship, o represents an output relationship, i/o represents an input-output relationship, and 1 denotes a self-relationship. For each column, the number of input and output relationships is counted for weight. An i/o relationship is double counted. A rule of thumb is that a column finding has at least one input and output relationship in the row. Process diagrams and meetings with stakeholders can also be used to identify finding correlations.

Figure 1.7: Finding correlations.
1.4.1.2 Identifying Improvement Packages
Based on correlation analysis, candidate IPs are identified by reviewing the weights of columns in the matrix where a weight is the number of findings having input or output relationships. Figure 1.8 illustrates identifying IPs. Columns are reviewed for weight by process areas. In each process area, a column that has a higher total weight is chosen as a candidate IP. A higher weight implies that the column finding is significant in the process area and has a broader impact across other process areas in the row.
For example, in Figure 1.8, the finding S-DE-2 in the column has the highest total weight, which indicates that it is the most significant finding in the design area and has a great impact on other process areas. Three candidate IPs – IP.S-DE-2, IP.W-IM-1, and IP.W-TE-1 – are chosen in Figure 1.8 for the process areas regarding the engineering process. Candidate IPs are reviewed for a possible merge if they have similar sets of relationships. In Figure 1.8, the IP IP.W-IM-1 is found to be a subset of IP.S-DE-2 and thus merged with IP.S-DE-2. The merged IP turns out to be similar to IP.W-TE-1, which encourages another merge. The results of the second merge is declared as a defined IP. The columns that have similar high weights in the same process area are likely to be merged. Based on our study, IPs built upon a sound analysis of finding correlations cover up to 80% of findings.
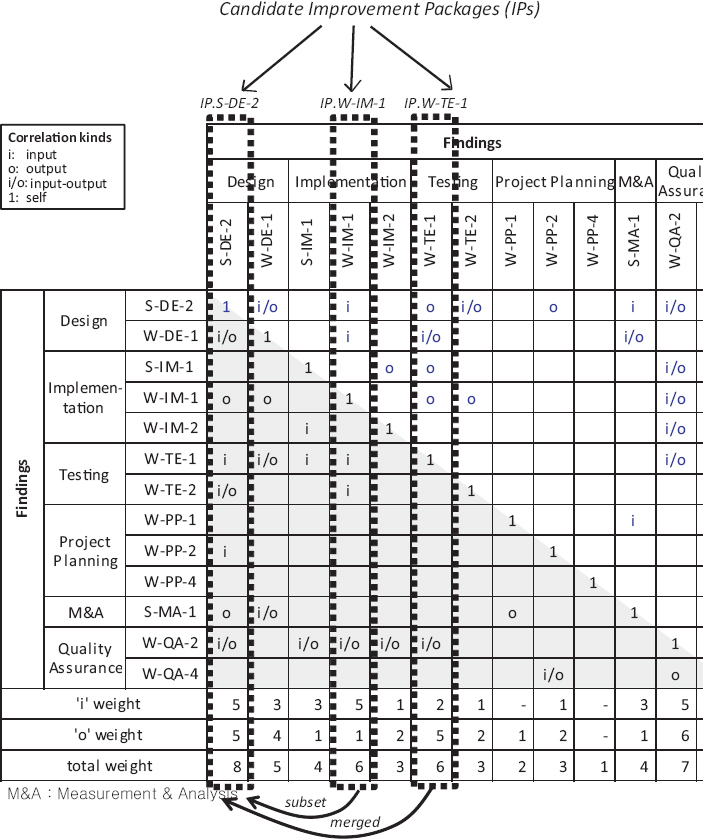
Figure 1.8: Identifying improvement packages.
Figure 1.9 shows an example of an IP description where the Description section describes the concern addressed by the IP and the Correlation Analysis section lists correlated findings in the IP.

Figure 1.9: Improvement package description.
1.4.2 Refining Improvement Packages
The IPs resulting from Subsection 1.4.1 are refined by four views – organizational view, software life cycle view, assessment model view, and business value view. Figure 1.10 describes the refinement process. The organizational view reviews IPs in terms of the available resources of the organization for their better utilization. The software life cycle view reviews IPs to identify which life cycle needs more attention for improvement. The assessment model view reviews IPs in consideration of the characteristics of the process reference model being used. The business value view prioritizes IPs with respect to business objectives. New findings may be identified in each view and reflected in IPs for refinement. We use IP.S-DE-1 in Figure 1.9 to demonstrate the refinement process.

Figure 1.10: Refining improvement packages.
1.4.2.1 Organizational View
When process improvement is planned, it is important to understand organization assets for their efficient use. The organizational view reviews IPs in terms of resources and roles.
Finding-to-Resource Analysis Depending on industry domains and types of activities, different types of resources are needed. Common types of resources include human resources and software tools. Human resources are assigned to projects usually by specialties (e.g., requirements analysis, testing). Cross-functional cooperation of human resources is integral to successful software development and delivery. Software tools and automation help improve the efficiency of process activities and operations. Availability and lack of resources can be understood in findings. For instance, from a finding “Automated daily build system is used in some projects,” it can be understood that “a daily build tool” and “a supporting source code repository” are available in the organization. Following are the strategies for finding-to-resource analysis.
- Understand availability and lack of resources in findings so as to enhance the utilization of existing resources and provide necessary resources.
- Identify findings that have a dependency on resources. This increases understanding as to how resources are used in the organization.

Figure 1.11: Findings-to-organization matrix.
Figure 1.11(a) shows an analysis of IP.S-DE-1 to resources using a matrix. In the matrix, the findings of the IP in the row are analyzed against the available resource types of the organization in the column. The project team that currently conducts the improvement project is also considered in human resources. Specifics (e.g., names) of related resources may be noted in the Comments section. The analysis reveals that the finding W-IM-2, which is not part of IP.S-DE-1, should also be included in the IP as it is concerned with static analysis tools for testing. This implements the strategy (b) and refines IP.S-DE-1 by adding W-IM-2. The comments provided in the analysis also reveal that software tools exist that are available for testing, but barely used in the current practice. This is defined as a new finding V-ORG-1 according to the strategy (a).
Finding-to-Role Analysis Roles are logical assets and appropriate assignment of roles is important for the success of a project [55]. Examples of roles in the software process include configuration manager, test engineer, software designer, and project manager. One person may play several roles and a single role may be played by multiple people. Depending on the organization, the definition of roles and their classification vary.
Roles are identified based on the underlying activities of findings and the knowledge about roles that assessors have acquired from assessment. As an example, in the finding “A test strategy is developed by testers in collaboration with developers,” whose underlying activity is “Developing a test strategy,” tester is found as a responsible role and developer as a consulted role. Newly identified strengths and gaps between the current practice and the expected practice with respect to involved roles are defined as new findings. The following describes the strategies for finding-to-role analysis.
- Review the distribution of roles over findings. If a role is related to many findings, the role might have overly assigned tasks and needs to be considered for reallocating responsibilities. Adversely, if a role is related to few findings, the role needs to be considered for more involvement in activities or reviewed for the necessity of its existence.
- Identify findings that have a role dependency. This helps better utilize the existing practices of concerned roles.
- Suggest roles that need to participate in the process action team to implement the IP. Roles involved in an IP suggest who should participate in the implementation of the IP.
Figure 1.11(b) shows a role analysis for IP.S-DE-1 using a matrix where the row lists findings and the column lists roles in the organization. Similar to resource analysis, the findings in the row are reviewed against the roles in the column to ensure that roles are appropriately involved in the IP. The review identifies that many activities in the IP have no QA involved, though the IP focuses on testing. This is defined as a new finding VORG-2 according to the strategy (a). In a review of other activities that are not involved in the IP, but relevant to QA, a new finding W-QA-4 is identified to include the QA audit role and added to the IP, which refines the IP. This implements the strategy (b). With a deeper understanding of the organization, the finding becomes more specific that the insufficient practice of QA is due to a lack of human resources. This is noted as another finding V-ORG-3. Figure 1.12 lists the three new findings identified in the organizational view analysis. They can also be used when other IPs are reviewed. The responsibility, accountability, consulted, and informed (RACI) responsibility assignment model [56], a commonly used model, may be used for detailed analysis of roles.

Figure 1.12: Findings from organizational view.
1.4.2.2 Software Life Cycle View
Software process activities follow the life cycle model employed in the organization. Many organizations adopt a general life cycle model (e.g., spiral model) and tailor it specifically to their needs. A process reference model, in general, also provides guidance for tailoring. When an activity is changed or newly introduced, it is important to decide where in the life cycle the activity should be carried out in consideration of other activities to increase synergy. The activity may be performed only once, repeatedly over phases, or continuously throughout the life cycle. The software life cycle review aims at identifying relevant activities to a changed activity and understanding where in the life cycle they should be exercised.

Figure 1.13: Finding-to-life cycle matrix.
Findings are understood in terms of life cycle phases where their underlying activities are performed. For instance, in an organization, test cases are mainly developed in the implementation and design phases, while risks and issues can be identified throughout the life cycle. New findings with respect to involved phases may be defined. Following are the strategies for finding-to-life cycle analysis:
- Review the relation of findings to phases. A phase related to more findings should be considered more important than others when implementing the IP. Adversely, a phase related to few findings should be considered to have more activities carried out.
- Identify the findings that have a temporal dependency. This helps to better utilize the existing practices over concerned phases.
Figure 1.13 shows an example of a life cycle view analysis. The review identifies that more testing activities are needed in the project planning, deployment, and project closure phases. This is defined as a new finding V-SLC-1 in Figure 1.14 per the strategy (a). In review of other findings that are not involved in the IP but related to the project planning phase, W-PP-4 is identified relevant to testing. This implements the strategy (b). The finding is concerned with selecting a life cycle model which has a great impact on planning test activities (e.g., testing strategies). The IP is refined accordingly by adding W-PP-4.

Figure 1.14: Findings from software life cycle view.
1.4.2.3 Assessment Model View
The process reference model employed in the organization provides guidance for achieving the intended benefits in the structure of the model (e.g., levels). For conformant improvement to the reference model, the guidance should be observed in the development of recommendations. For example, the important guidance of CMMI is that each level forms a necessary foundation for the next level.

Figure 1.15: Capability-based process model guidance.
Consider the example in Figure 1.15 where process assessment is supposed to be conducted at level 4. The IP involves three weaknesses W.1, W.2, and W.3 from ProjectZ and one strength S.1 from ProjectX. S.1 is a good practice that should be also exercised in ProjectZ. However, practicing S.1 to improve W.1 in ProjectZ is not effective as W.1 is not ready yet to implement S.1 because the level of W.1 is lower than that of S.1. W.2 can be explained similarly. However, S.1 can be implemented for W.3 since both are at the same level. The reference model used in the case study of IP.S-DE-2 has three levels (1–3) and the findings of the IP are all from level 2. This fact lends itself as a new finding V-PAM-1 to be referenced by other IPs. Figure 1.16 defines the finding.
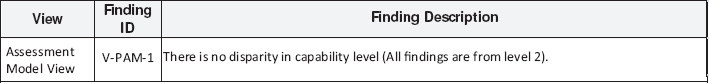
Figure 1.16: Finding from assessment model view.
1.4.2.4 Business Value View
Process improvement should be driven by business objectives. That is, improvement actions should be prioritized based on business objectives, and improvement plans should be aligned with business objectives. No action item for important activities in business value should be missing. The business value view reviews findings against business objectives. If business objectives are not defined, stakeholders are responsible for defining them.
Figure 1.17 shows an analysis matrix of business value view. In the matrix, findings are reviewed for relevance to business objectives, strength applicability, and weakness severity. Common categories of business objectives include quality, delivery, and cost. Strength applicability reviews required costs and resources from a business value perspective for a strength to be implemented in other projects, while weakness severity reviews the impact of a weakness on business objectives. Findings are rated for these aspects on a scale of 1 to 5. The following are example questions for rating:
- (Q) Is the finding related to business objectives on Quality Improvement?
- (D) Is the finding related to business objectives on Time to Market?
- (C) Is the finding related to business objectives on Cost Reduction?
- (S) Is the strength applicable or expandable to other parts of organization?
- (W) Is the weakness a blocking issue to achieve business objectives?
In Figure 1.17, all the three strengths in IP.S-DE-2 are rated 4 for applicability, which means that they are highly applicable to other projects. This is defined as a new finding V-BIS-1. It is also observed that the findings W-DE-1 on early test planning, W-TE-1 on regression testing, and W-PP-2 on early risk identification are highly relevant to business objectives and severe from a business perspective. This is defined as another finding V-BIS- 2. The importance of the IP to each aspect of business value is measured by summing up the grades in the column. Figure 1.17 shows that IP.S-DE-2 has the highest grade on quality improvement in business value. After refinement by the business value view, the business value of IP.S-DE-2 is increased to 85 from 63. Note that the rating given in the matrix is for demonstration purpose and does not mean that the impact of findings on business value is known.
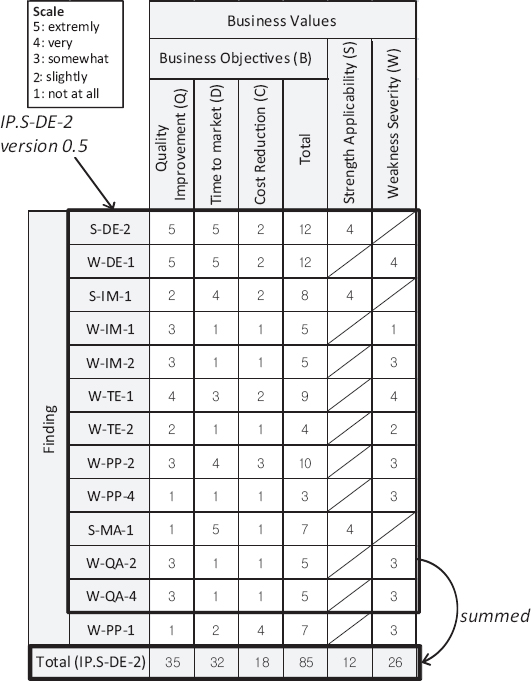
Figure 1.17: Finding-to-business value matrix.
Refined IPs are reviewed for overlapping and possible re-scoping. After refinement, there might be left-out findings which do not belong to any IP. If a left-out finding has a higher business value, it may stand on its own. Otherwise, it becomes a simple corrective action. Final IPs are prioritized based on the total grade on business value. Business objectives and weakness severity are considered prior to strength applicability, which can be considered later in recommendation development. In a priority review, IP.S-DE-2 is found to be more important for quality improvement than other IPs, which is defined as a new finding V-BIS-3. Figure 1.18 shows the three new findings identified in the business value view analysis.

Figure 1.18: Findings from business value view.
1.4.3 Building Recommendations
The IPs resulting from Subsection 1.4.2 form a basis for building improvement recommendations. Figure 1.19 shows the activities of building recommendations. For each IP, an abstract recommendation is drafted using templates and then, a concrete recommendation is formulated based on the abstract recommendation.

Figure 1.19: Building recommendations.
1.4.3.1 Drafting Abstract Recommendations
For each IP, an abstract recommendation is drafted with an ID, business value, traceability to the base IP, and an overview of the recommendation. Figure 1.20 shows an example of an abstract recommendation for IP.S-DE-2.

Figure 1.20: Abstract recommendation.
The recommendation specifies that the ID is RECO01, its business value is very high, and the base IP is IP.S-DE-2. The description is described using the templates in Table 1.4. Four templates are defined – W-S, W-W, S-S, and S-W – for different kinds of findings (weakness and strength) based on correlation analysis and four-view analysis. W-S and W-W are designed to improve weaknesses, while S-S and S-W are for enhancing strengths. Specifically, W-S is used to improve a weakness using strengths, while W-W is for improving a weakness by improving other related weaknesses. S-S enhances a strength using other related strengths, while S-W is used to enhance a strength by improving related weaknesses. For example, in the W-S template
- (1) The USING <strength> and IMPROVING <weakness> clauses describe finding correlations identified in correlation analysis;
- (2) The WITH <resource> clause describes human resources and tools from the organizational view analysis;
- (3) The AT <life cycle phase> clause describes life cycle phases to be focused on, and
- (4) The TO ACHIEVE <business value> clause describes the goal of the recommendation from a business perspective.
Table 1.4: Recommendation description templates.
| Type | Findings | Description Template |
|---|---|---|
| W-S | Strengths, Weaknesses | IMPROVE <weakness>* BY [ [USING <strength>* ], [IMPROVING <weakness>* ] ] WITH <resource>* IN <life cycle phase>* TO ACHIEVE <business objective>* |
| W-W | Weaknesses only | IMPROVE <weakness>* BY IMPROVING <weakness>* WITH <resource>* IN <life cycle phase>* TO ACHIEVE <business objective>* |
| S-S | Strengths only | ENHANCE <strength>* BY USING <strength>* WITH <resource>* IN <life cycle phase>* TO ACHIEVE <business objective>* |
| S-W | Strengths, Weaknesses | ENHANCE <strength>* BY [ [USING <strength>*], [IMPROVING <weakness>*] ] WITH <resource>* IN <life cycle phase>* TO ACHIEVE <business objective>* |
Refined IP.S-DE-2 involves both strengths and weaknesses and, thus, either W-S or S-W may be used. The dominance in the IP are weaknesses which can be improved by the involved strengths. This leads to the choice of W-S. The selected template is instantiated by substituting the parameters with related activities, process areas, and work products in the findings of the IP. The asterisk next to a parameter denotes that the parameter can be instantiated multiple times.
For example, the W-S template can be instantiated as follows. The <weakness> parameter in the IMPROVE clause is substituted by “testing process,” which is the major area of concern in the weaknesses of IP.S-DE-2. For a detailed description, it can be as specific as activities like “testing plan, test cases, testing strategy, collecting defects.” The <strength> parameter in the USING clause is substituted by “testing strategy” and “test planning practice,” which are activities in the involved strengths. The <weakness> parameter in the IMPROVING clause is instantiated with “test planning process” and “quality assurance process,” which are sub-areas focused on in the testing process. The <resource> parameter in the WITH clause is substituted by “QA team” and “testing related tools” which are identified in the organizational view analysis. The <life cycle phase> parameter in the IN clause is replaced by “project planning phase,” which suggests establishing a testing strategy early on in the project planning phase. This is based on the observation that there is little test planning in the IP. The <business objective> parameter in the TO ACHIEVE clause is substituted by “system quality” and “time-to-market,” which are identified as important objectives in the business value view analysis.
1.4.3.2 Building Concrete Recommendations
An abstract recommendation is elaborated by identifying recommendation seeds in the base IP. A recommendation seed is a primitive recommendation item for a specific finding. A seed is identified in consideration of the context of the base IP from an improvement perspective. For a strength, the seed suggests enhancing or expanding the practice throughout the organization. For a weakness, the seed suggests improving the practice or proposes an alternative. A set of related seeds is considered together and evolves to a concrete recommendation item to be added in the final recommendation. This is where expertise and experience come into play.
Figure 1.21 shows an example of identifying recommendation seeds from the findings in IP.S-DE-2 and their evolution. For strength S-DE-2, the seed suggests practicing the activity even earlier in the project planning phase than the design phase, which enhances the strength. The seed may further suggest practicing the enhanced activity throughout the organization. There are two weaknesses in the IP with respect to project characteristics – W-TE-1 and W-PP-2. W-TE-1 describes that the project life cycle is not considered in test planning. W-PP-2 points out that it takes little effort to identify risks in project planning. There are three weaknesses – W-TE-1, W-TE-2, and W-QA-2 – in the IP that need to be improved to support the enhancement of S-DE-2. These weaknesses find that regression testing (W-TE-1), test levels (W-TE-2), and performance testing strategy (W-QA-2), which are important constituents of a testing strategy, are not defined in the current practice. These five recommendation seeds are merged together and evolve to a recommendation item addressing the need of a testing strategy to be established in project planning in consideration of project characteristics and customer needs.

Figure 1.21: Identifying recommendation seeds.
Evolved recommendation seeds are categorized by the four views in Subsection 1.4.2. That is, recommendation seeds regarding activities belong to the software life cycle view, those regarding human resources and tools belong to the organizational view, those regarding guidance of an assessment model belong to the assessment model view, and those that are critical to business value belong to the business value view.
Figure 1.22 shows a concrete recommendation for IP.S-DE-2. In the figure, the evolved recommendation seed in Figure 1.21 is placed in the software life cycle view. Seeds that do not belong to any view (e.g., training programs) are described in the Others section. Recommendation items are tagged with related findings for traceability. Specific advice on the composition of the process action team may be specified in the Suggested Team Composition section.

Figure 1.22: Concrete recommendation.
1.5 Case Studies
We conducted case studies in collaboration with three consulting firms on twelve different software process improvement projects from various companies in business type, size, and domain. Table 1.5 shows an overview of the projects and companies involved in the case studies. The projects are to assess a specific unit in the companies. The diversity of the involved projects provides us with an opportunity to evaluate the generality of ReMo.
Table 1.5: Companies that participated in case studies.

aSME: Small and Medium Enterprises
Table 1.6 shows the assessment data used in the case studies. Findings are produced by SCAMPI A, which is the formal assessment method for CMMI, and a structured gap analysis (SGA), which is a SCAMPI-like assessment activity for a capability-based reference model. CMMI and software process certification model (SPCM) [21] are used for SGAs. The projects ProjectA, ProjectD, ProjectK, and ProjectL include both weaknesses and strengths and we use them to demonstrate how strengths are used in ReMo. The average number of involved process areas is 12 for 41 findings.
Table 1.6: Assessment data used in case studies.
| Case | Reference | Assessment | Num. of | Findinga | Num. of |
|---|---|---|---|---|---|
| Study | Model | Method | PAs | Typea | Findings |
| ProjectA | CMMI Lb3 | SCAMPI A | 17 | S, W | 68 |
| ProjectB | SPCMc L2 | SGAd | 10 | W | 43 |
| ProjectC | CMMI L3 | SGA | 14 | W | 39 |
| ProjectD | SPCM L2 | SGA | 10 | S, W | 36 |
| ProjectE | CMMI L2 | SGA | 6 | W | 18 |
| ProjectF | CMMI L4 | SGA | 19 | W | 65 |
| ProjectG | SPCM L2 | SGA | 10 | W | 47 |
| ProjectH | SPCM L2 | SGA | 10 | W | 35 |
| ProjectI | SPCM L2 | SGA | 10 | W | 40 |
| ProjectJ | CMMI L2 | SGA | 6 | W | 18 |
| ProjectK | CMMI L3 | SGA | 17 | S, W | 49 |
| ProjectL | CMMI L3 | SCAMPI A | 17 | S, W | 33 |
aFinding Type: S - Strength, W - Weakness, bL: Level
cSPCM: Software Process Certification Model, dSGA: Structured Gap Analysis
Table 1.7 shows the participants in the case studies. Fifteen process engineers participated in the case studies, including twelve software process consultants and three process improvement personnel from the organizations where the case studies were conducted. In particular, participants P01-7 and P12-13 are highly experienced project leaders, each having over 15 years of experience in more than 20 SPI projects. All participants are given a one-hour tutorial on ReMo. P1-P3, P7, and P13 had an experience in ReMo as a reviewer of ReMo outcomes and others actually practiced ReMo in their projects. Some consultants (P02, P04, P05, P06, P14) participated in more than one case study as noted in parenthesis.
Table 1.8 shows the summary of the case studies in terms of the number of involved process areas, findings, participants, produced IPs, recommendations, and person-hours spent. The level of details in produced recommendations varies slightly depending on the expertise level of the practitioner. ProjectA had more concrete recommendations produced to help less experienced participants have a better understanding of planning improvement actions. Other projects had more experienced participants involved and used simpler recommendations (e.g., without specific activities) as a result of the participants’ expertise. Person-hours include execution time only. training time (one hour in each case study) and interview time are not included. Person-hours in ProjectH is only 1 due to the small scope (analyzing 3 process areas to 7 other areas) and the high familiarity of the participant with ReMo. Subsets of the ReMo outcomes produced in the case studies are shown in Table 1.8. A detailed evaluation including feedback is described in Section 1.6.
ReMo has been refined and evolved based on the feedback from case studies through Phases I-IV, as shown Figure 1.23.
Table 1.7: Participants in case studies.

Table 1.8: Case study summary.


Figure 1.23: Evolution of ReMo.
In Phase I, the concepts of ReMo were defined and their feasibility was validated using posterior data from completed projects. Phase II refined ReMo based on the feedback from Phase I and validated the refined ReMo by applying it to the same data set used in Phase I. Phase III validated the maturity of the refined ReMo by applying it to live projects and Phase IV integrated ReMo with the process improvement cycle by implementing ReMo recommendations.
1.5.1 Phase I
ReMo concepts were defined and validated using the assessment findings from three completed projects – ProjectB, ProjectD, and ProjectG – where the authors also participated as assessors in identifying findings. The validation results were presented to process experts (P01, P02, P04, P05, and P06) for their feedback. While they all agreed upon the need for ReMo, they commented that correlation analysis is not concrete enough and the refinement process needs to be more detailed for each view in four-view analysis. They also commented that constructing recommendations from finding correlations needs to be more specific. The study in this phase was reported at the International Conference on Software and Systems Process [20].
1.5.2 Phase II
The ReMo was refined by addressing the concerns raised in Phase I. The concern about identifying finding correlations was addressed by defining correlation kinds and a matrix-based method for identifying correlations. The concern about the refinement process was addressed by providing specific aspects to be considered and an analysis method for each of the four views. The concern about the recommendation construction was addressed by introducing concepts of improvement packages and recommendation seeds, which serve together as a bridge between findings and recommendations. The refined ReMo was validated by applying it to the same data used in Phase I. In this phase, the resulting outcomes were compared with the existing data to observe improvements made by the refinement such as identifying missing correlations or missing improvement packages and improved quality of recommendations.
1.5.3 Phase III
The maturity of ReMo was validated through eight live projects – ProjectC, ProjectE, ProjectF, ProjectH, ProjectI, ProjectJ, ProjectK, and ProjectL. The validation focused on the producer-consumer chain of the three steps in ReMo as a project proceeds. Feedback in this phase included that the traceability from findings to recommendations is not very clear, which has been addressed by labeling IPs and recommendation items with related findings’ ID. Another concern raised was the size of improvement packages being somewhat too large to keep track of the progress of recommendation development. This concern has been addressed by reducing the granularity of IPs by process areas. Feedback from ProjectC included that the correlation analysis involves heavy manual work. We addressed this partially by providing an Excel-based tool supporting basic data validation (e.g., consistency) in correlation analysis. Overall, the participants found ReMo efficient and effective.
1.5.4 Phase IV
In this phase, we evaluated the quality of ReMo recommendations by implementing them in improvement planning and implementation in a live project ProjectA. A one-day workshop on ReMo was provided before initiation. Participants were grouped into A and B. Group A executed ReMo and Group B reviewed the outcomes of ReMo. The reviewed outcomes were used by Group A to establish improvement action plans and the resulting improvement action plans were reviewed by Group B. Feedback in this phase included that (1) the resulting recommendations are concrete and detailed compared to the ones produced in the past projects and (2) the analysis results of business value view are useful for prioritizing improvement items in planning improvement actions. They also noted that ReMo reduces the quality gap between the artifacts produced by the experienced and those produced by those with less experience. Nine months after the ReMo-based improvement plan was established, most improvements, with the exception of long-term items, were successfully implemented. The lead engineer (P09) for implementing ReMo recommendations in the organization remarked that ReMo helped convince the management of the need for the changes and for the development project team to make the changes in their practice. ReMo also made improvement activities effective by encouraging people who played the roles identified in the organizational view analysis to participate in process implementation.
1.6 Evaluation
We evaluated ReMo using the data collected from the case studies in Section 1.5. Following are the research hypotheses:
- (H1) ReMo improves the productivity and performance of building recommendations.
- (H2) The resulting recommendations are concrete and comprehensive.
We evaluated H1 through surveys of the practitioners who participated in the case studies for the acceptability of ReMo based on the technology acceptance model (TAM) [18,57], which is a widely adopted method for evaluating the user acceptance of information application systems and development technologies and methodologies [19,58-60]. H2 is evaluated by comparing ReMo outcomes to those that are produced by the current practice and confirming the comparison results with practitioners.
1.6.1 Process Evaluation
To demonstrate ReMo supporting H1, we conducted surveys of the participants of the case studies in Section 1.5 on the user acceptance of ReMo in terms of perceived usefulness (PU) and perceived ease of use (PEOU) [18] using the technology acceptance model (TAM) [18]. Table 1.9 shows the questionnaires of PU and PEOU. The surveys were conducted in Phase III and IV in Figure 1.23.
Table 1.9: Measurement items for PU and PEOU.

1.6.1.1 Perceived Usefulness
Perceived usefulness (PU) is defined as “the degree to which a person believes that using a particular system would enhance his/her job performance” [18]. The results of PU on ReMo are shown in Table 1.10.
Table 1.10: Survey results on PU.
| Item | Mean | Median | Std. Dev | |
| (a) | Work more quickly | 5.6 | 6.0 | 1.12 |
| (b) | Job performance | 5.8 | 6.0 | 0.78 |
| (c) | Increase productivity | 5.5 | 6.0 | 0.67 |
| (d) | Effectiveness | 6.3 | 6.0 | 0.55 |
| (e) | Makes job easier | 5.7 | 6.0 | 1.07 |
| (f) | Useful | 6.1 | 6.0 | 0.79 |
* Scales : 1 extremely unlikely, 2 quite unlikely, 3 slightly unlikely, 4 neither, 5 slightly likely, 6 quite likely, 7 extremely likely
The table shows that the standard deviation of items (a) and (e) is notably higher than that of other items. This is due to the significant low score given by the participant P09, who felt that ReMo requires more effort in building recommendations than prior practice. Given that P09 has less experience in process assessment and improvement planning than others, his rating seems natural. On the other hand, P09 also commented that ReMo was helpful in getting support from the management and developers for implementing recommendations. We also observe in the table that items (d) and (f) have higher scores and lower standard deviations than other items. This can be interpreted as the practitioners having constant confidence in the effectiveness and usefulness of ReMo across projects. The overall average of PU is 5.8 (out of 7.0) with the median 5.8 and the standard deviation 0.62. For the four most commonly used items (b), (c), (d), and (f) [19], the average is 6.0. The Cronbach alpha coefficient [61] of ReMo, which denotes reliability, is measured as 0.82, which is higher than the threshold of 0.70, which is commonly considered as being acceptable [62].
1.6.1.2 Perceived Ease of Use
Perceived ease of use (PEOU) is defined as “the degree to which a person believes that using a particular system would be free of effort” [18]. The results of the survey are shown in Table 1.11. The table shows surveyed items having similar standard deviations, which implies that ReMo is generally accepted as easy to use by both the experienced and the less experienced. The average PEOU is 6.0 with median 6.0 and standard deviation 0.40. The average of the four most commonly used items (a), (b), (d), and (f) [19] is measured the same. The reliability of the PEOU is measured as 0.73.
Table 1.11: Survey results on PEOU.
| Item | Mean | Median | Std. Dev | |
| (a) | Easy to learn | 5.9 | 6.0 | 0.52 |
| (b) | Controllable | 5.7 | 6.0 | 0.77 |
| (c) | Clear & understandable | 6.0 | 6.0 | 0.64 |
| (d) | Flexible | 6.1 | 6.0 | 0.79 |
| (e) | Easy to become skillful | 6.0 | 6.0 | 0.47 |
| (f) | Easy to use | 6.0 | 6.0 | 0.47 |
To gauge the generality of ReMo, we analyzed the survey results in various perspectives on the projects in which the survey participants participated. The perspectives include
- (a) Organization size: the number of employees ≤ 99 (12 surveys) and > 99 (11 surveys);
- (b) Assessment methods: SCAMPI A (8 surveys) and SGA (15 surveys);
- (c) The number of involved process areas: ≤ 12 (6 surveys) and > 12 (17 surveys);
- (d) The number of identified findings: ≤ 41 (15 surveys) and > 41 (8 surveys), and
- (e) The number of years of experience of participants: ≤ 14 (6 surveys) and > 14 (17 surveys).
We adopted the Mann-Whitney U test for analyzing the differences of the two groups in each category. The Mann-Whitney U test [63] is a non-parametric test for the null hypothesis (H0) “ReMo is consistent in the two populations.”
Table 1.12 shows the analysis results of p-value. Since the p-values of (a)-(e) in the table are not less than the chosen significance level of 0.05, we conclude that there is insufficient evidence to reject H0 for all five categories. This demonstrates that ReMo is general to the studied projects for the considered categories.
Table 1.12: Mann-Whitney U Test results on PU and PEOU.

* Mann-Whitney U Test P-values for PU and PEOU are presented
The general feedback on the usefulness of ReMo based on individual interviews is that ReMo helps in understanding the organizational state of the software development practice and considering improvement alternatives. P04, P05, and P08 commented that ReMo helps find unforeseen action items and the resulting recommendations are concrete and convincing. P04 and P09 advised extending the application of ReMo to other domains such as the system domain and the vehicle domain. The participants also commented that after practicing ReMo, its purpose and necessity are better understood. In particular, they all value four-view analysis in identifying hidden correlations of findings. On the other hand, P09 commented that identifying correlations can be somewhat difficult for less experienced people and it would be helpful if participants were advised on the expected expertise and experience in using ReMo. Besides the capability-based models used in the case studies, P04 also suggested looking into non-capability-based models. With respect to the implementation of produced recommendations, participants also commented that ReMo complements the current process assessment practice in their organization and its outcomes are concrete enough to convince the commitment of management and practitioners and facilitate communication.
1.6.2 Outcome Evaluation
With respect to H2, we evaluated the concreteness and comprehensiveness of ReMo recommendations by comparing them to those that are produced by the current practice in the case studies in Section 1.5. Concreteness is concerned with the level of details that the resulting recommendations possess. Details should contain detailed guidelines as to “how” the concern in related findings can be addressed. Comprehensiveness is concerned that a recommendation addresses related findings together across process areas for synergistic improvements.
Definition and measurement attributes for concreteness and comprehensiveness are established and refined from trial measurements by the evaluators. Measurements are made for every recommendation statement in five out of twelve case studies that have two sets of improvement recommendations – one set from ReMo (see the example in Figure 1.22) and another set from the current practice. Table 1.13 shows a recommendation example developed by the current practice. Two experts, each with over 20 years of experience, individually measured each attribute, and then a consensus is made from a structured review and discussion session using the Delphi method [64].
Table 1.13: Example recommendations produced by an ad-hoc method in current practice.
1.6.2.1 Concreteness
SPEM 2.0 [65], the standard for software process definition by the Object Management Group (OMG), defines activity, work product, work product description (explanation of the contents), role, team (participating organization), tool, and phase (timing) as core aspects to be considered in process modeling. The concreteness of recommendations is measured by process element coverage which represents the degree to which each element is covered.
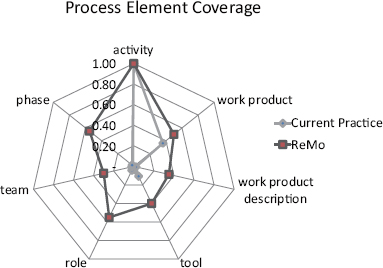
Figure 1.24: Concreteness comparison —Process element coverage.
Figure 1.24 and Table 1.14 show the comparison results in terms of process element coverage on a scale of 0 to 1. In Figure 1.24, the coverage of 1.0 for the activity element means that all the recommendations in the five projects specify activity information, and the coverage of 0.4 for the phase element denotes that only 40% of recommendations specify phase information. The average coverage is measured as 0.22 for the current practice and 0.52 for ReMo, which indicates a notable improvement by ReMo.
Table 1.14: Process element coverage.

Figure 1.25 presents the number of covered process elements by projects. With the same assessment findings, ReMo recommendations demonstrate higher concreteness than current practice ones in all five case studies. On average, the current practice produces information covering only 1.7 process elements, while ReMo covers 3.6 process elements, which demonstrates the superiority of ReMo over the current practice.

Figure 1.25: Concreteness comparison per project.
Figure 1.26 demonstrates the comparison of the ReMo recommendation in Figure 1.22 with the current practice recommendation in Table 1.13 regarding test planning activity from a concretness perspective. The figure shows that the ReMo recommendation addresses the five aspects with ample details for each aspect, while the current practice recommendation describes only four aspects with limited information. Both recommendations cover the testing process.
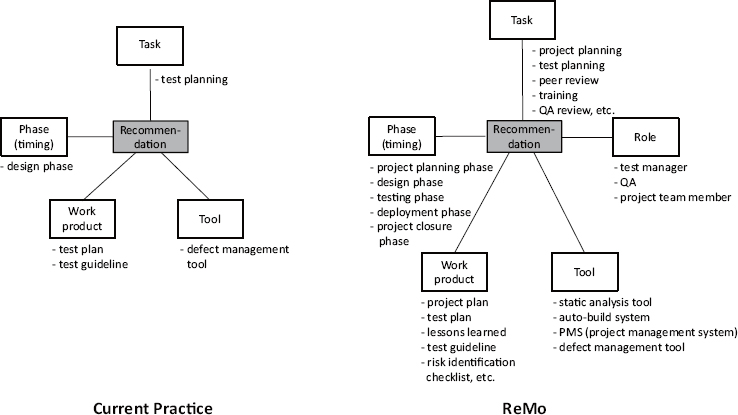
Figure 1.26: Concreteness comparison of recommendation examples.
1.6.2.2 Comprehensiveness
Comprehensiveness is measured by process area coverage which represents the degree to which relevant process areas in the composition of recommendations are covered. Figure 1.27 shows the comparison of ReMo recommendations with current practice recommendations for comprehensiveness. The process area coverage is measured on a scale of 0 to 1 where 1 means that all the relevant process areas given by the specification of the reference model are covered. In the figure, the average coverage is measured as 0.88 for ReMo and 0.27 for the current practice, which demonstrates a significant improvement by ReMo. Table 1.15 shows the process area coverage by projects. ProjectI and ProjectH are excluded from the table as their underlying reference model does not provide process correlation information. The table shows that ReMo outperforms the current practice for all the three projects.

Figure 1.27: Comprehensiveness comparison —Process area coverage.
Table 1.15: Process area coverage per project.

Figure 1.28 shows the comparison of ReMo with the current practice for comprehensiveness. In Figure 1.28(a), the current practice takes in single weakness W-DE-1 and produces a recommendation based on the weakness. The produced recommendation simply suggests an activity to establish a test plan without concrete advice as to how test plans should be developed. Furthermore, it does not consider any finding about strength. On the other hand, the recommendation produced by ReMo is built upon a group of five related findings from the four process areas. In addition, the considered findings also include both weaknesses and strengths. This enables ReMo to produce detailed advice on specific items (e.g., test coverage criteria) to be considered in software test planning activity. Similarly, in Figure 1.28(b), the ReMo recommendation, which is built upon a group of the six related findings from the five process areas, provides specific activities on which test strategies should be established and the bases to be considered in developing test strategies, while the one produced by the current practice is terse and abstract.

Figure 1.28: Comprehensiveness comparison —Recommendation example.
1.6.3 Threats to Validity
In this subsection, we discuss threats to validity from construct, internal, and external perspectives [66-70].
1.6.3.1 Construct Validity
Construct validity is concerned with failing on developing a sufficiently operational set of measures and collecting data due to subjective judgement. With respect to construct validity, the derived evaluation results in our case studies might involve subjectivity. To mitigate this threat, we used multiple sources of evidence for the results, including documentation reviews, interviews, surveys, and observations. These sources confirm that there exists consistency in the collected data. We also used an established measurement tool (i.e., TAM) to further mitigate the threat. The preliminary case study results were peer-reviewed and confirmed by a group of practitioners who participated in the case studies.
1.6.3.2 Internal Validity
Internal validity is concerned with the validity of causal relations of outputs. The quality of ReMo recommendations might be relative to the level of experience of the participants who participated in the case studies. It is quite natural that more experienced people would likely produce better quality outcomes. In the outcome evaluation, the participants consistently stated that ReMo helps produce better recommendations compared to their prior recommendations produced by an ad-hoc practice in the past. This testifies that although the quality of ReMo recommendations is relative to experience level, practitioners do feel that at their experience level, the quality of ReMo recommendations is better than those produced in the past practice.
1.6.3.3 External Validity
External validity is concerned with the generalization of study results. In this work, the improvements by ReMo may be justifiable only within the studied SPI projects and participants. To mitigate this threat, we strived to conduct as many case studies as possible with more process experts involved. The contexts of the studied projects vary in business domain, company size, assessed organization size, process reference model, assessment method, and the number of involved process areas and findings. The participants of the case studies also have many years of experiences in various domains, including enterprise system integration, automotive, and telecommunication. We think that the diversity of the covered contexts and domains testifies to the generality of ReMo to a reasonable extent.
1.7 Discussion
In this study, ReMo, a process model for producing process improvement recommendations, is presented and validated through multiple industrial case studies and structured reviews by experts. The results show that ReMo is applicable in industrial practice of SPI and improves the quality of improvement recommendations. The creation of improvement recommendations is known to be an essential activity in software process improvement [8-10,23,29]. However, both the commercial (e.g., CMMI, TMMI, ISO/IEC) and academic literature have so far focused mainly on establishing a set of best practices as reference models and applying the models across industries to understand organizational development capability. There exists only a little research regarding quality improvement recommendations. Table 1.16 summarizes the existing relevant studies (see Section 1.3 for details of each study) in comparison with ReMo. In practice, although improvement recommendations are regarded as essential, their creation is carried out in an ad-hoc manner, and the quality of essential activities and their outcome highly rely on the personal capability of practitioners. This should be changed. Process reference models are used to improve the software development process. In the same sense, SPI processes should be used to improve SPI. ReMo as an SPI process can serve as a guidance and training material for junior and senior practitioners to produce quality improvement recommendations.
ReMo was evaluated through diverse case studies. In the evaluation of perceived usefulness (see Table 1.10), ReMo received relatively lower scores on work more quickly (5.6/7) and makes job easier (5.7/7), which are concerned with efficiency, while receiving higher scores on effectivenss (6.3/7) and useful (6.1/7). The room for improvement in efficiency can be filled up by establishing a knowledge base of empirical SPI data (e.g., assessment findings, findings analysis results, produced recommendations, development context, etc.) and AI-assistant tool support which can accelerate buy-in of ReMo by SPI practitioners and increase the productivity of SPI activity. ReMo is ready to expand its application to other development contexts (e.g., agile, DevOps, etc.) and assessment models (ISO/IEC 15504, ITIL, TMMI, etc.) to enhance the generality and practicality of ReMo. ReMo uses findings from an assessment model to create recommendations. However, ReMo is not dependent on any specific assessment model. Although the CMMI and SPCM assessment models were used in the case studies, ReMo can also be used with other assessment models.
Table 1.16: A comparison of ReMo with existing studies.

1.8 Conclusion
We have presented ReMo, a model for systematic development of recommendations in the process improvement process. The development of ReMo is driven by practical needs from the field and its benefits and impact were evaluated through diverse case studies, and surveys and interviews of practitioners. ReMo takes as input the findings resulting from process assessment and analyzes them for correlations. Improvement packages are identified by grouping findings that have a great impact across process areas. Improvement packages are refined through four-view analysis. Recommendation seeds are identified from a refined improvement package and evolve to recommendation items to form a concrete recommendation. Twelve case studies were conducted to evaluate ReMo for outcome quality and process acceptance. The evaluation showed that ReMo recommendations are more concrete and comprehensive than those produced by the current practice. Acceptance of ReMo is evaluated as 5.8 out of 7.0 for perceived usefulness and 6.0 out of 7.0 for perceived ease of use. A statistical analysis of the evaluation results to various contextual parameters (e.g., organizational size, number of involved process areas, participants’ experience) showed that ReMo is general within the considered projects in the case studies.
The consideration of process areas in correlation analysis enables identification of implicit correlations across related process areas whose relevance is not explicit. Such process areas are usually considered independently in practice, which makes it difficult to identify hidden correlations. The type of input findings (weakness, strength) influences the results of ReMo. In the twelve case studies, eight studies used only weaknesses and the other four used both strengths and weaknesses. While the sole use of weaknesses does not have a negative impact on the quality of ReMo outcomes, the combined use of both weaknesses and strengths produces more constructive outcomes. Also, the quality of input findings may have an impact on the quality of ReMo outcomes, and thus certain quality control is necessary for input findings.
ReMo is designed for the capability-based process reference models which are widely used in industry. However, ReMo can also be used for a non-capability-based model (e.g., ISO 26262) by tailoring (or excluding) the assessment model view in the refinement process. While ReMo helps improve the productivity of less experienced individuals, its impact can be much greater if more experienced and motivated practitioners work as a team. The most rewarding comment in the case studies was submitted by P11, who said that “ReMo is very systematic and helped me a lot in deriving improvement action plans. I could not get it done without ReMo.”
We plan to define metamodels and tool support for establishing finding correlations and identifying improvement packages. As advised in case studies, we shall look into the extent to which ReMo can be used in other domains such as systems engineering. For instance, the life cycle view and assessment model view might need to be tailored for a specific life cycle model in the target domain.
Acknowledgments
This research was partially supported by the MSIT (Ministry of Science and ICT), Republic of Korea, under the ITRC (Information Technology Research Center) support program (IITP-2021-2017-0-01628 ) supervised by the IITP (Institute for Information & Communications Technology Promotion)
References
1. Staples, M., & Niazi, M. (2008). Systematic review of organizational motivations for adopting CMM-based SPI. Information and Software Technology, 50(7-8), 605-620.
2. Unterkalmsteiner, M., Gorschek, T., Islam, A. M., Cheng, C. K., Permadi, R. B., & Feldt, R. (2011). Evaluation and measurement of software process improvement - a systematic literature review. IEEE Transactions on Software Engineering, 38(2), 398-424.
3. Swinarski, M., Parente, D. H., & Kishore, R. (2012). Do small IT firms benefit from higher process capability?. Communications of the ACM, 55(7), 129-134.
4. Paulk, M. C., Humphrey, W. S., & Pandelios G. J. (1992). Software process assessments: Issues and lessons learned. in ISQE92 Proceedings, 4B41-4B58, 41-58.
5. Sommerville, I., & Ransom, J. (2005). An empirical study of industrial requirements engineering process assessment and improvement. ACM Transactions on Software Engineering and Methodology (TOSEM), 14(1), 85-117.
6. Goldenson, D. R., & Herbsleb, J. D. (1995). After the Appraisal: A Systematic Survey of Process Improvement, its Benefits, and Factors that Influence Success. CMU/SEI-95-TR-009, Software Engineering Inst., Carnegie Mellon University.
7. Humphrey, W. S., Snyder, T. R., & Willis, R. R. (1991). Software process improvement at Hughes Aircraft. IEEE Software, 8(4), 11-23.
8. Team, S. U. (2011). Standard CMMI Appraisal Method for Process Improvement (SCAMPI) A, Version 1.3: Method Definition Document. Software Engineering Institute, Carnegie Mellon University, Tech. Rep. CMU/SEI-2011-HB-001.
9. ISO/IEC, ISO/IEC 15504 Information technology - Process assessment Part 1 - Part 5 (2006).
10. McFeeley, B. (1996). IDEAL: A User’s Guide for Software Process Improvement. CMU/SEI-96-HB-001, Carnegie Mellon University Software Engineering Inst.
11. Zahra, K., Azam, F., Ilyas, F., Faisal, H., Ambreen, N., & Gondal, N. (2017, January). Success factors of organizational change in software process improvement: A systematic literature review. In Proceedings of the 5th International Conference on Information and Education Technology (pp. 155-160).
12. Baddoo, N., & Hall, T. (2003). De-motivators for software process improvement: an analysis of practitioners’ views. Journal of Systems and Software, 66(1), 23-33.
13. Dyba, T. (2005). An empirical investigation of the key factors for success in software process improvement. IEEE transactions on Software Engineering, 31(5), 410-424.
14. Niazi, M., Babar, M. A., & Verner, J. M. (2010). Software Process Improvement barriers: A cross-cultural comparison. Information and Software Technology, 52(11), 1204-1216.
15. Cattaneo, F., Fuggetta, A., & Sciuto, D. (2001). Pursuing coherence in software process assessment and improvement. Software Process: Improvement and Practice, 6(1), 3-22.
16. Pettigrew, A. M. (2012). Context and action in the transformation of the firm: A reprise. Journal of Management Studies, 49(7), 1304-1328.
17. Runeson, P., & Höst, M. (2009). Guidelines for conducting and reporting case study research in software engineering. Empirical Software Engineering, 14(2), 131-164.
18. Davis, F. D. (1989). Perceived usefulness, perceived ease of use, and user acceptance of information technology. MIS Quarterly, 319-340.
19. Legris, P., Ingham, J., & Collerette, P. (2003). Why do people use information technology? A critical review of the technology acceptance model. Information & Management, 40(3), 191-204.
20. Choi, S., Kim, D. K., & Park, S. (2012, June). ReMo: a recommendation model for software process improvement. In 2012 International Conference on Software and System Process (ICSSP) (pp. 135-139). IEEE.
21. Hwang, S. M., & Im, S. (2011, May). Korean software process quality certification model. In 2011 First ACIS/JNU International Conference on Computers, Networks, Systems and Industrial Engineering (pp. 123-128). IEEE.
22. Hörmann, K., Müller, M., Dittmann, L., & Zimmer, J. (2008). Automotive SPICE in Practice: Surviving Implementation and Assessment. Rocky Nook., 1st Edition.
23. CMMI Product Team (2010). CMMI for Development, Version 1.3, Tech. Rep. CMU/SEI-2010-TR- 033, Software Engineering Inst, Carnegie Mellon University.
24. Mejía, J., Iñiguez, F., & Muñoz, M. (2017, June). SMART-SPI: A data analysis model proposal for software process improvement. In 2017 12th Iberian Conference on Information Systems and Technologies (CISTI) (pp. 1-7). IEEE.
25. Shrestha, A., Cater-Steel, A., Toleman, M., Behari, S., & Rajaeian, M. M. (2020). Development and evaluation of a software-mediated process assessment method for IT service management. Information & Management, 57(4), 103213.
26. White, S. K., & Greiner, L. (2019). What is ITIL? Your guide to the IT Infrastructure Library. Publicado em. (2019, Jan 18). URL https://www.cio.com/article/2439501/infrastructure-it-infrastructure-library-itil-definition
27. Laksono, M. A., Budiardjo, E. K., & Ferdinansyah, A. (2019, January). Assessment of Test Maturity Model: A Comparative Study for Process Improvement. In Proceedings of the 2nd International Conference on Software Engineering and Information Management, New York, NY, USA, (pp. 110-118).
28. Van Veenendaal, E., & Wells, B. (2012). Test maturity model integration (TMMi). TMMI Foundation (www.tmmifoundation.org), Uitgeverij Tutein Nolthenius.
29. T. Foundation, TMMi Assessment Method Application Requirements (TAMAR) Release 1.0, Tech. rep., TMMi Foundation (2014). URL http://www.tmmi.org
30. Yoji Akao. (2004). Quality function deployment: integrating customer requirements into product design. SteinerBooks.
31. Hierholzer, A., Herzwurm, G., & Schlang, H. (2003). Applying QFD for software process improvement at SAP AG, in: Proceedings of the World Innovation and Strategy Conference, 1998, pp. 85-95.
32. Sun, Y., & Liu, X. F. (2010). Business-oriented software process improvement based on CMMI using QFD. Information and Software Technology, 52(1), 79-91.
33. Raza, M., Faria, J. P., Amaro, L., & Henriques, P. C. (2017, July). WebProcessPAIR: recommendation system for software process improvement. In R. Bendraou, D. Raffo, L. Huang, F. M. Maggi (Eds.), Proceedings of the 2017 International Conference on Software and System Process, Paris, France, (pp. 139-140).
34. Farooq, U., Ahmed, M., Hussain, S., Hussain, F., Naseem, A., & Aslam, K. (2021). Blockchain-Based Software Process Improvement (BBSPI): An Approach for SMEs to Perform Process Improvement. IEEE Access, 9, 10426-10442.
35. Yli-Huumo, J., Ko, D., Choi, S., Park, S., & Smolander, K. (2016). Where is current research on blockchain technology?—a systematic review. PloS one, 11(10), e0163477, 1-27.
36. Pino, F. J., Pardo, C., García, F., & Piattini, M. (2010). Assessment methodology for software process improvement in small organizations. Information and Software Technology, 52(10), 1044-1061.
37. Wiegers, K. E., & Sturzenberger, D. C. (2000). A modular software process mini-assessment method. IEEE Software, 17(1), 62-69.
38. Tang, J., Jing, M., & Zhu, Q. (2012). Towards Quantitative Assessment Model for Software Process Improvement in Small Organization. Information Technology Journal, 11(1), 49-57.
39. Habra, N., Alexandre, S., Desharnais, J. M., Laporte, C. Y., & Renault, A. (2008). Initiating software process improvement in very small enterprises: Experience with a light assessment tool. Information and Software Technology, 50(7-8), 763-771.
40. Wilkie, F. G., Mc Caffery, F., McFall, D., Lester, N., & Wilkinson, E. (2007). A Low-overhead method for software process appraisal. Software Process: Improvement and Practice, 12(4), 339-349.
41. Pettersson, F., Ivarsson, M., Gorschek, T., & Öhman, P. (2008). A practitioner’s guide to light weight software process assessment and improvement planning. Journal of Systems and Software, 81(6), 972-995.
42. Daily, K., & Dresner, D. (2003). Towards software excellence—informal self-assessment for software developers. Software Process: Improvement and Practice, 8(3), 157-168.
43. Villalón, J. A. C. M., Agustín, G. C., Gilabert, T. S. F., Seco, A. D. A., Sánchez, L. G., & Cota, M. P. (2002). Experiences in the application of software process improvement in SMES. Software Quality Journal, 10(3), 261-273.
44. Harjumaa, L. (2005). A pattern approach to software inspection process improvement. Software Process: Improvement and Practice, 10(4), 455-465.
45. Haase, V. H. (1998, August). Software process improvement planning with neural networks. In Proceedings. 24th EUROMICRO Conference (Cat. No. 98EX204) (Vol. 2, pp. 808-815). IEEE.
46. Gorschek, T., & Wohlin, C. (2004). Packaging software process improvement issues: a method and a case study. Software: Practice and Experience, 34(14), 1311-1344.
47. Monteiro, P., Machado, R. J., Kazman, R., & Henriques, C. (2010, June). Dependency analysis between CMMI process areas. In International Conference on Product Focused Software Process Improvement (pp. 263-275). Springer, Berlin, Heidelberg.
48. Chen, X., Staples, M., & Bannerman, P. (2008, September). Analysis of dependencies between specific practices in CMMI maturity level 2. In European Conference on Software Process Improvement (pp. 94-105). Springer, Berlin, Heidelberg.
49. Calvo-Manzano, J., Cuevas, G., Mejía, J., San Feliu, T., & Sánchez, A. (2008, September). CMMI-ACQ: A formal implementation sequences of the processes areas at maturity level 2. In 2008 Electronics, Robotics and Automotive Mechanics Conference (CERMA’08) (pp. 212-217). IEEE. Doi:10.1109/CERMA.2008.55.
50. CMMI Product Team, CMMI for Acquisition, Version 1.3, Tech. Rep. CMU/SEI-2010-TR- 032, Software Engineering Inst., Carnegie Mellon University (2010). URL http://resources.sei.cmu.edu/library/asset-view.cfm?AssetID=9657
51. Arcilla, M., Calvo-Manzano, J., Cuevas, G., Gómez, G., Ruiz, E., & San Feliu, T. (2008, September). A solution for establishing the information technology service management processes implementation sequence. In European Conference on Software Process Improvement (pp. 106-116). Springer, Berlin, Heidelberg.
52. Frederiksen, H. D., & Mathiassen, L. (2008). A contextual approach to improving software metrics practices. IEEE Transactions on Engineering Management, 55(4), 602-616.
53. Bremer, M. (2012), Organizational Culture Change: Unleashing your Organization’s Potential in Circles of 10, Kikker Groep.
54. Abran, A., Moore, J. W., Bourque, P., Dupuis, R., & Tripp, L. (2004). Software engineering body of knowledge. IEEE Computer Society, Angela Burgess.
55. Johansen, J., & Pries-Heje, J. (2007). Success with improvement—requires the right roles to be enacted—in symbiosis. Software Process: Improvement and Practice, 12(6), 529-539.
56. Smith, M. L., Erwin, J., & Diaferio, S. (2005). Role & responsibility charting (RACI). In Project Management Forum (PMForum) (Vol. 5). http://myclass.peelschools.org/sec/12/4268/Resources/RACIRWeb31:pdf
57. Davis, F. D., Bagozzi, R. P., & Warshaw, P. R. (1989). User acceptance of computer technology: A comparison of two theoretical models. Management Science, 35(8), 982-1003.
58. Umarji, M., & Seaman, C. (2005). Predicting acceptance of software process improvement. ACM SIGSOFT Software Engineering Notes, 30(4), 1-6.
59. Chan, F. K., & Thong, J. Y. (2009). Acceptance of agile methodologies: A critical review and conceptual framework. Decision Support Systems, 46(4), 803-814.
60. Riemenschneider, C. K., Hardgrave, B. C., & Davis, F. D. (2002). Explaining software developer acceptance of methodologies: a comparison of five theoretical models. IEEE Transactions on Software Engineering, 28(12), 1135-1145.
61. Carmines, E. G., & Zeller, R. A. (1979). Reliability and validity assessment. SAGE Publication.
62. Santos, J. R. A. (1999). Cronbach’s alpha: A tool for assessing the reliability of scales. Journal of Extension, 37(2), 1-5.
63. Mann, H. B., & Whitney, D. R. (1947). On a test of whether one of two random variables is stochastically larger than the other. The Annals of Mathematics and Statistics, 50-60.
64. Turoff, M., & Linstone, H. A. (2002). The Delphi method-techniques and applications. Addison-Wesley.
65. I. Object Management Group, Software & Systems Process Engineering Meta-Model (SPEM) 2.0 (April 2008).
66. Yin, R. K. (2009). Case Study Research. Design and Methods 4th edn., SAGE Publications.
67. Raza, M., & Faria, J. P. (2016, August). ProcessPAIR: A tool for automated performance analysis and improvement recommendation in software development. In Proceedings of the 31st IEEE/ACM International Conference on Automated Software Engineering (pp. 798-803).
68. Le, D. N., Nguyen, G. N., Garg, H., Huynh, Q. T., Bao, T. N., & Tuan, N. N. (2021). Optimizing Bidders Selection of Multi-Round Procurement Problem in Software Project Management Using Parallel Max-Min Ant System Algorithm. CMC-COMPUTERS MATERIALS & CONTINUA, 66(1), 993-1010.
69. Bao, T. N., Huynh, Q. T., Nguyen, X. T., Nguyen, G. N., & Le, D. N. (2020). A Novel Particle Swarm Optimization Approach to Support Decision-Making in the Multi-Round of an Auction by Game Theory. International Journal of Computational Intelligence Systems, 13(1), 1447-1463.
70. Le, D. N. (2017). A new ant algorithm for optimal service selection with end-to-end QoS constraints. Journal of Internet Technology, 18(5), 1017-1030.
Appendix. Example Recommendations in Case Studies


