Chapter 3
Mitigate threats using Azure Sentinel
Azure Sentinel is a cloud-based SIEM (security information and event management) solution. SIEM solutions have been in existence for a number of years, and their key purpose is to collect and correlate events across an organization’s IT environment to detect anomalous activities that might be indicative of a security breach. These alerts can then be dealt with by a security operations center (SOC) team to investigate, respond, and mitigate the issue that the SIEM has alerted on. Having an effective SIEM is critical to any organization’s security operations; you might have heard the phrase “that’s out of scope… said no attacker ever.” The fact is that attackers will use any vulnerable assets they find in an IT environment to move laterally to find objects of value (data, computer power, and the like), so an organization simply cannot afford to have blind spots in their monitoring. Individual security tools might pick up one aspect of an attack (such as initial access through a vulnerable endpoint), but this alert by itself won’t allow an SOC to understand the full scope of the attack and respond appropriately. A SIEM allows security operations analysts to correlate events in the wider IT environment and understand the seriousness of a breach.
In this chapter you’ll learn about designing an Azure Sentinel workspace, ingesting data sources into Azure Sentinel, managing analytics rules, configuring automation, using workbooks, and hunting for threats using Azure Sentinel.
Skills covered in this chapter:
Plan and implement the use of data connectors for the ingestion of data sources into Azure Sentinel
Configure Security Orchestration, Automation, and Response (SOAR) in Azure Sentinel
Skill 3-1: Design and configure an Azure Sentinel workspace
This objective deals with designing and configuring an Azure Sentinel workspace. Because Azure Sentinel is a SaaS (Software as a Service) solution, much of the core configuration is taken care of for you by Microsoft, but—as with any SaaS—certain aspects of configuration that still need to be implemented by each individual organization using the service.
Plan an Azure Sentinel workspace
Azure Sentinel is an enrichment layer that sits on top of a Log Analytics workspace. You cannot use Azure Sentinel without first having a Log Analytics workspace created in your Azure tenant. Log Analytics is where all logs that are ingested into Azure Sentinel are stored. There are several aspects of design and architecture to consider before creating your Log Analytics workspace(s) for Azure Sentinel.
First, you must consider the number of workspaces. Where possible, it is recommended that you use one central security workspace. However, there are times when this might not be possible. The main reasons for requiring a multi-workspace deployment are as follows:
If logs need to be kept in a certain jurisdiction for compliance or regulatory requirements for a global organization
To reduce Azure region networking egress costs
For subsidiary organizations that run their own security operations
Note
Remember that Log Analytics and Azure Sentinel have a one-to-one relationship. If you choose to have multiple Log Analytics workspaces in your deployment, you will, in turn, have multiple Azure Sentinel instances. This chapter will cover management of multi-workspace incidents later.
If you require multiple workspaces, this will take one of two forms:
Cross-tenant scenario Where multiple Azure tenants each have Azure Sentinel workspaces that need to be centrally managed
Cross-workspace scenario Where there are multiple workspaces in one Azure tenant that need to be centrally managed
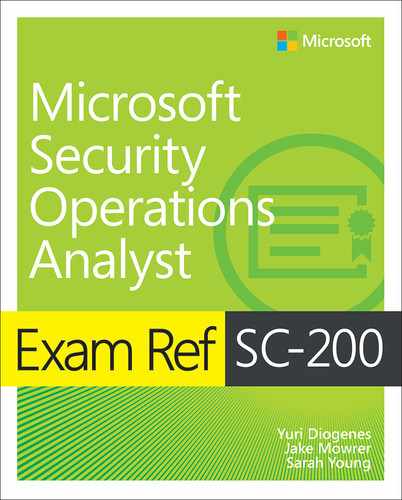
Azure Sentinel can support scenarios where multiple Azure tenants are involved by using Azure Lighthouse, which is an Azure service that allows cross-tenant management, with the MSSP managing the customer’s Azure Sentinel workspace. This architecture can also be used for organizations that have subsidiaries who have their own separate Azure tenants. Figure 3-1 shows how Azure Lighthouse can be used to manage Azure Sentinel workspaces in different Azure tenancies.
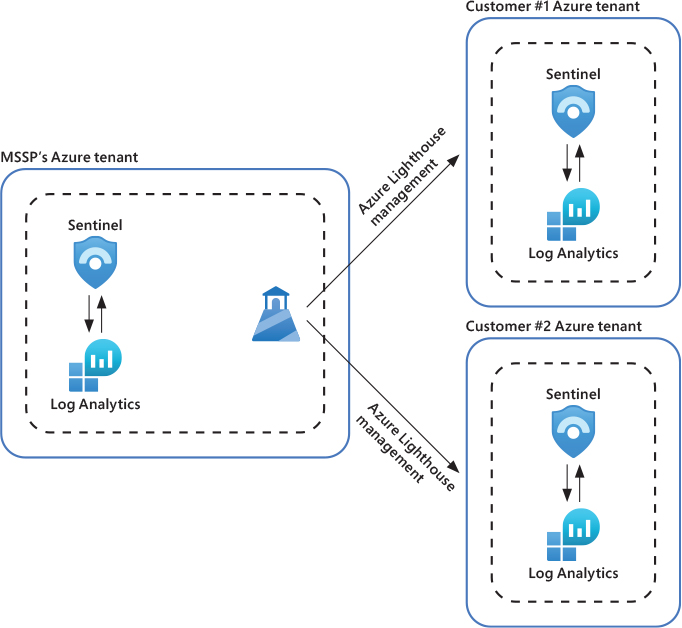
FIGURE 3-1 Managing Azure Sentinel workspaces across different Azure tenancies using Azure Lighthouse
There are many advantages to using Azure Lighthouse if your organization chooses to outsource their security operations. Here are a few:
All data stays in the end customer’s Azure tenant Data is not stored in your MSSP’s Azure tenant and is not mixed with other customer data. This preserves data sovereignty and allows for straightforward offboarding should the need arise.
MSSPs only have access to the Azure resource(s) that the end customer grants them This is unlike traditional delegated access in on-premises environments where a third-party service provider might have had access to the whole IT environment, even when only a specific application is needed.
MSSPs get consolidated views of all the customer workspaces they manage They don’t have to log in to each Azure Sentinel workspace separately, which is inefficient and not scalable.
More Info Running Azure Sentinel Using Azure Lighthouse
You can learn more about running Azure Sentinel with Azure Lighthouse here: https://aka.ms/azsentinelmssp.
Aside from Azure Lighthouse, there are several features in Log Analytics and Azure Sentinel that allow for investigation of incidents across workspaces in the same Azure tenant, as shown in Figure 3-2 and discussed in detail later in this chapter:
Cross-workspace queries
Cross-workspace analytics rules
Cross-workspace hunting queries
Cross-workspace workbooks

FIGURE 3-2 Cross-workspace analytics rules in the same Azure tenant
Other aspects of Azure Sentinel design to consider are as follows:
Azure tenant placement A Log Analytics workspace is an Azure resource, and like with any Azure resource, consideration needs to take place for where this will sit. You will need to define a subscription, resource group, and region. It is recommended that the Log Analytics workspace that you are going to set up Azure Sentinel on top of is placed in a separate resource group for simplicity in configuring RBAC (more detail later). You may choose to place the workspace in an existing Azure Subscription or in a separate one.
Commitment tiers If you plan to ingest more than 100GB per day into your Azure Sentinel workspace, it is worthwhile looking at commitment tiers that give you a discount on ingestion compared to pay-as-you-go pricing. Note that even if you don’t ingest data up to your commitment tier allotment, you will be charged for it anyway if you change commitment tiers. Commitment tiers need to be configured at both the Log Analytics and Azure Sentinel level.
More Info Azure Sentinel Commitment Tiers
You can learn more about Azure Sentinel commitment tiers here: https://azure.microsoft.com/pricing/details/azure-sentinel/.
After you have decided on the number of workspaces and how they will fit into your Azure tenancy, you can enable Log Analytics workspace(s) and subsequently Azure Sentinel by performing the following steps:
Navigate to the Azure portal by opening https://portal.azure.com.
In the Search bar, type Sentinel, and under Services, click Azure Sentinel Workspace. The Azure Sentinel page appears, as shown in Figure 3-3.
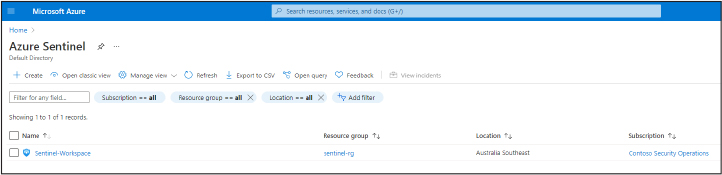
FIGURE 3-3 Creating a new Log Analytics workspace
Click Create. The Add Azure Sentinel To A Workspace page appears.
Click Create A New Workspace.
The Create Log Analytics Workspace page appears, as shown in Figure 3-4.

FIGURE 3-4 Create Log Analytics Workspace page
Configure the Subscription, Resource Group, and Region for your Log Analytics workspace.
Select Pricing Tier, add Tags (if required), and then select Create. Wait for your Log Analytics workspace to be provisioned.
In the Azure portal, search for Azure Sentinel and select Add on the Azure Sentinel page. The Add Azure Sentinel To A Workspace page appears, as shown in Figure 3-5.
FIGURE 3-5 Add Azure Sentinel To A Workspace
Select the Log Analytics workspace on which you want to activate Azure Sentinel.
Configure Azure Sentinel roles
As with other Azure resources, Azure Sentinel comes with several built-in Azure roles that you can assign to users who need to access your workspace. Remember to adhere to the principle of least privilege and always assign the absolute lowest level of privilege that a user requires to complete their role. Following are the built-in rules:
Azure Sentinel Reader Can view data, incidents, workbooks, and other Azure Sentinel resources.
Azure Sentinel Responder In addition to the permissions granted by an Azure Sentinel Reader role, the Azure Sentinel Responder role allows for managing of incidents.
Azure Sentinel Contributor In addition to the permissions that Reader and Responder roles have, Azure Sentinel Contributor can create and edit workbooks, analytics rules, and other Azure Sentinel resources.
To assign an Azure Sentinel role to a user, perform the following steps:
Navigate to the Azure portal by opening https://portal.azure.com.
In the Search bar, type Resource Groups, and under Services, click Resource Groups. The Resource Groups page appears, as shown in Figure 3-6.

FIGURE 3-6 The Resource Groups page in the Azure portal
Select the resource group that your Azure Sentinel workspace is associated with. The resource group’s overview page appears.
From the resource group overview page, select the Access Control (IAM) page, which is shown in Figure 3-7.

FIGURE 3-7 Access Control (IAM) for a resource group
On the Access Control (IAM) page, select Add role assignment, as shown in Figure 3-8.
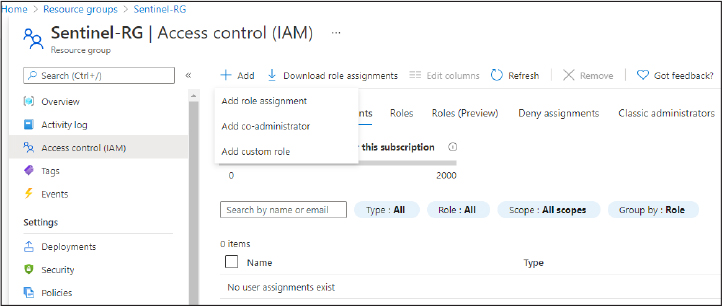
FIGURE 3-8 Adding a role assignment for a user
The Add Role Assignment blade appears, as shown in Figure 3-9.
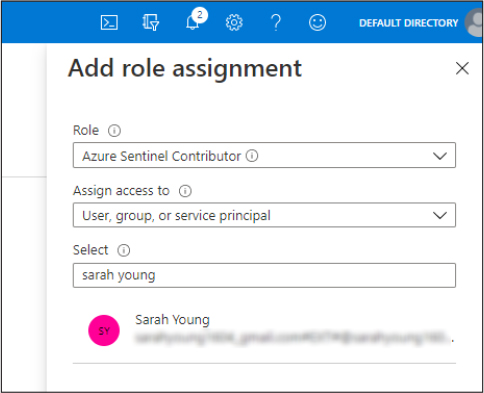
FIGURE 3-9 Add Role Assignment
On the Add Role Assignment blade, search for the Azure Sentinel role you want to assign, and in Azure AD, search for the user who you want to assign the role to.
Select Save to add this assignment.
Note
The steps above detail how to assign Azure Sentinel permissions to a user based on the resource group. It is also possible to follow these steps and assign the role at the subscription or management group level that the workspace is in and the resource group will subsequently inherit this permission. However, best practice dictates that roles should be added at the resource group level, not at the subscription level or management group level.
Design Azure Sentinel data storage
Earlier in this chapter we explained that Azure Sentinel’s data store is Log Analytics, which itself is a part of the wider Azure Monitor platform. As the name suggests, Azure Monitor is a suite of services in the Azure platform that assist with monitoring.
Tip
When reading Microsoft documentation, you might find that some Log Analytics and Sentinel documentation refers to Azure Monitor. Remember, Log Analytics, and therefore Azure Sentinel, is a part of the Azure Monitor platform; this isn’t a typo or a mistake in the documentation.
Log Analytics is an immutable log store that uses different tables to store the logs that it ingests in rows. What this means is that after data has been ingested into a Log Analytics workspace, it cannot be changed or amended and will only be removed from the workspace when the log reaches its retention period and is aged out of the workspace.
It is possible to retain data in a Log Analytics workspace for up to 730 days (2 years), but the default data retention is set to 30 days. When you activate Azure Sentinel on a Log Analytics workspace, you receive up to 90 days of free data retention. Azure Sentinel is priced on ingestion and log retention, so if you choose to retain logs in your workspace for more than 90 days, fees will be assessed. It is recommended that you choose a retention period in your workspace that balances how far back you are likely to actively query your security logs against the cost of retention.
Tip Data Retention
You must manually alter the data retention to 90 days after you activate Azure Sentinel on a Log Analytics workspace; it is not changed automatically. This is important because when data reaches its configured retention limit, it will be automatically purged by Log Analytics, and you wouldn’t want to not take advantage of your free 90 days of retention!
Remember that you can set retention periods in Log Analytics on a per-table basis, so you can opt to retain certain tables for longer than others to reduce the cost of retaining an entire workspace for a longer period. A table that is often kept for longer than others is the SecurityIncident table, as this stores details of the security incidents that have been raised by Azure Sentinel and querying this table allows for SOC managers to see their SOC’s performance metrics, number of incidents raised over time, and so on. Ultimately, a cost/benefit analysis will have to be performed to decide what works best for your implementation of Azure Sentinel; there are tools such as the Azure Sentinel pricing calculator that can help you with this.
More Info Azure Sentinel Pricing Calculator
You can learn more about Azure Sentinel pricing at https://azure.microsoft.com/pricing/calculator/.
To change the data retention settings in your workspace perform the following steps:
Navigate to the Azure portal by opening https://portal.azure.com.
In the Search bar, type Log Analytics, and under Services, click Log Analytics Workspace. The Log Analytics Workspace page appears.
Select your workspace, and the Usage And Estimated Costs page appears, as shown in Figure 3-10.

FIGURE 3-10 Navigating to the Data Retention settings in a Log Analytics workspace
Select the Usage And Estimated Costs blade.
Select Data Retention and move the slider on the Data Retention blade to your desired retention period for your workspace (shown in Figure 3-11) and select OK.

FIGURE 3-11 Setting the Data Retention blade to your desired retention period for your workspace
Long-term storage of Azure Sentinel data
Many organizations must adhere to strict data retention requirements for regulatory and compliance purposes that exceed the maximum 730 days that can be configured in Log Analytics. Additionally, keeping data in Log Analytics for the full 730 days that can be configured could be prohibitively expensive for a security operations team’s budget.
There are two options to consider if long-term storage of Azure Sentinel logs is required for an implementation:
Moving to blob storage
Moving to Azure Data Explorer (ADX)
Sending data directly to blob storage is effectively archiving them and putting them in a cold store. This is the cheapest storage option, but the data will require “rehydrating” if they are needed to be actively queried again. ADX can be considered a warm store, which means data can be queried there. (It even uses the same query language—KQL.) However, the features are basic compared to Log Analytics and Azure Sentinel’s rich feature set for security operations.
More Info Long-Term Retention of Azure Sentinel Data
You can learn more about long-term retention options for Azure Sentinel data at https://techcommunity.microsoft.com/t5/azure-sentinel/using-azure-data-explorer-for-long-term-retention-of-azure/ba-p/1883947.
Configure Azure Sentinel service security
Azure Sentinel relies on other services for some of its functionality. This means that to use these features, additional permissions other than the built-in Azure Sentinel roles need to be used:
Using Playbooks for automation In order to use Playbooks in Azure Sentinel, you will also need to assign the Logic App Contributor built-in role because Playbooks are part of Azure Logic Apps, which is considered to be a separate Azure resource and thus, has its own set of permissions.
Connecting data sources to Azure Sentinel A user must have write permissions on the Azure Sentinel workspace to be able to add a data source. They might also need additional permissions specific to each data source; these are listed on the connector’s page.
Guest users assigning incidents To assign incidents in Azure Sentinel, guest users require the Directory Reader permissions to be assigned to them. Note that this role is not an Azure role but an Azure Active Directory role and that regular (non-guest) users have this role assigned by default.
Creating and deleting workbooks In order to create and delete workbooks in Azure Sentinel, a user will need to be assigned the Azure Monitor role of Monitoring Contributor. This is not required for using workbooks. It’s only necessary for creating and deleting workbooks.
More Info Azure Sentinel Permissions and Built-In Roles
You can learn more about Azure Sentinel permissions and built-in roles at https://docs.microsoft.com/azure/sentinel/roles.
Skill 3-2: Plan and implement the use of data connectors for the ingestion of data sources into Azure Sentinel
This objective deals with the planning and implementation of connecting data sources to Azure Sentinel. No SIEM solution can function without data sources, so this is a critical aspect of creating an effective Azure Sentinel implementation that will successfully protect your IT environment.
Identify data sources to be ingested into Azure Sentinel
Identifying which data sources to ingest into Azure Sentinel is a critical activity that should ideally be decided upon before you begin your implementation. Azure Sentinel makes it easy to identify data sources that can be connected to the product via the built-in data connectors in the data connector gallery.
As a starting point, we recommend that you review the data connector gallery and identify which of these data sources you have in your environment and which ones you want to connect. Azure Sentinel has an extensive collection of built-in data connectors for both Microsoft and third-party products that can be utilized.
Follow these steps to review the data connector gallery:
Navigate to the Azure portal by opening https://portal.azure.com.
In the Search bar type Sentinel, and under Services, click Azure Sentinel. The Azure Sentinel workspace page appears, as shown in Figure 3-12.

FIGURE 3-12 Selecting the correct Azure Sentinel workspace
Select the workspace you want to use. The Azure Sentinel | Overview page appears, as shown in Figure 3-13.

FIGURE 3-13 The Azure Sentinel | Overview page
Click Data Connectors, which opens the Data Connectors page, as shown in Figure 3-14.

FIGURE 3-14 Data Connectors gallery
Scroll through the gallery and note the data sources that are in your IT environment and that you want to ingest.
Add these data sources to your design document.
 Exam Tip
Microsoft frequently adds new data connectors to Azure Sentinel. Make sure you review the Data Connectors gallery on a regular basis, so that you are familiar with the current offerings before your SC-200 exam.
Although Azure Sentinel has many built-in data connectors, there might be data sources that you need to connect that are not in the gallery. We will cover how you can configure a custom connector to ingest these data sources into Sentinel later in the chapter. Meanwhile, we will continue to focus on identification of data sources. Many organizations have older, on-premises SIEMs that they are migrating away from, and you should review whether the data sources ingested by these SIEMs should be redirected to be ingested by Azure Sentinel.
Note Microsoft Graph Security API
Organizations who have an incumbent SIEM solution are unlikely to want to migrate all their data sources to Azure Sentinel in a big bang approach. It is more likely that the organization runs both SIEMs side-by-side and gradually migrates more and more sources to Azure Sentinel, and in due course, the on-premises SIEM is decommissioned. Using the Microsoft Graph Security API, Azure Sentinel can integrate with popular on-premises SIEM solutions to support this approach while still maintaining a holistic view of security events. You can learn more about the Microsoft Graph Security API at https://docs.microsoft.com/en-us/graph/security-concept-overview.
After reviewing the data connector gallery and the current data sources that are being monitored by an organization’s incumbent SIEM solution, the last stage of the process is to verify whether there are other data sources that need to be connected to Azure Sentinel from the IT environment. When setting up or migrating to a new SIEM, it is worthwhile to verify there aren’t any blind spots in your monitoring setup and that there aren’t any assets that have not been monitored previously. This can occur for various reasons, including:
Difficulty in integrating the data source
Volume or noisiness of data source
Human error/oversight
If a data source was previously unable to be integrated into a SIEM, the data source should be reassessed to see whether it is more viable to connect it to the SIEM to reduce as many blind spots as possible in the environment when moving to a modern solution.
Tip
You might be familiar with the phrase “collection is not detection.” Remember, ingestion charges increase as more data is sent to your workspace, so it is important to only ingest data that has use in a security monitoring context. As a rule of thumb, if you’re not going to run a detection against it or use the data source for hunting, you need to reassess whether you should be ingesting it at all. Blindly ingesting as many data sources as possible will lead to a very large Azure bill!
Free data sources in Azure Sentinel
There are some data sources that can be ingested into Azure Sentinel free of charge. At the time of writing, the following sources could be ingested into a workspace completely free of charge when using the built-in Azure Sentinel connector:
Azure Activity logs
Office 365—Exchange, SharePoint, and Teams logs
Security alerts (not raw logs) from Microsoft security products—MCAS, Azure Defender, Defender for Identity, Defender for Endpoint, and so on
Note Only the Ingestion Is Free
These data sources would accumulate a retention charge if they were retained for more than 90 days in a workspace; only the ingestion is free.
Tip Check the Free Data Sources
From time to time, Microsoft might change the data sources that are free to ingest. Make sure that you check this prior to your exam and—arguably more importantly—prior to an implementation, so you or your customer don’t get a nasty billing shock!
Identify the prerequisites for a data connector
Azure Sentinel makes it easy to understand what prerequisites you need before you can use a data connector: they are all listed on each data connector’s page. Some data connectors require Syslog/CEF connectors or Windows Event collectors to be set up as a prerequisite for use, but we’ll dive into that in more detail later in this chapter.
Follow these steps to view the prerequisites for using a data connector:
Navigate to the Azure portal by opening https://portal.azure.com.
In the Search bar, type Sentinel, and under Services, click Azure Sentinel. The Azure Sentinel Workspace page appears.
Select the workspace you want to use. The Azure Sentinel | Overview page appears.
Click Data Connectors, which opens the Data Connectors page.
Select the data connector for which you want to view the prerequisites and click the Open Connector page button.
The connector’s overview page appears, as shown in Figure 3-15.
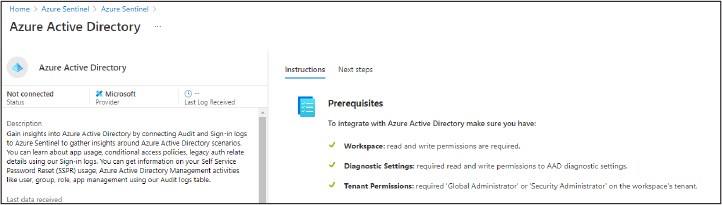
FIGURE 3-15 Data connector prerequisites
The prerequisites to be able to use the selected data connector can be found in the top-right part of the connector’s page.
Tip Note Additional Permissions Needed
Some data connector prerequisites will require you to have Azure AD permissions in other parts of Azure—not just Azure Sentinel—so take careful note of what additional permissions you need to be granted to be able to use a data connector.
Configure and use Azure Sentinel data connectors
Now that you’ve identified which data connectors you want to use and have all the prerequisites in hand, it’s time to start configuring your Azure Sentinel data connectors. As always, Azure Sentinel tries to make this process as easy and painless as possible for you (you’re probably noticing a theme here!).
Following are some examples of the Azure Sentinel data connectors you might connect in this manner:
Microsoft Cloud App Security (MCAS)
Azure Defender
Azure Defender for IoT
Microsoft Defender for Endpoint
Microsoft Defender for Identity
Microsoft Defender for Office 365
Azure Active Directory Identity Protection
To configure a data connector:
Navigate to the Azure portal by opening https://portal.azure.com.
In the Search bar, type Sentinel, and under Services, click Azure Sentinel. The Azure Sentinel Workspace page appears.
Select the workspace you want to use. The Azure Sentinel | Overview page appears.
Click Data Connectors. The Data Connectors page appears.
Select the data connector that you want to configure and click the Open Connector page button.
The configuration steps to activate the selected data connector can be found on the bottom-right of the connector’s page. Configuration steps vary from data connector to data connector, as shown in Figures 3-16 and 3-17.
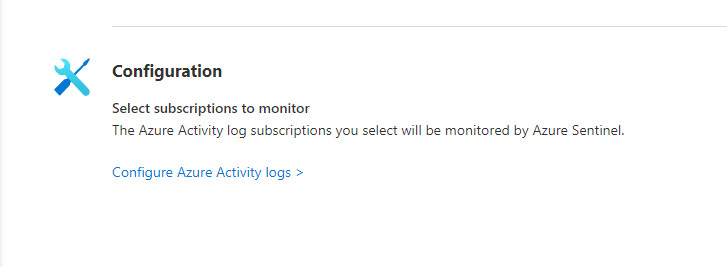
FIGURE 3-16 Configuration steps for the Azure Activity data connector
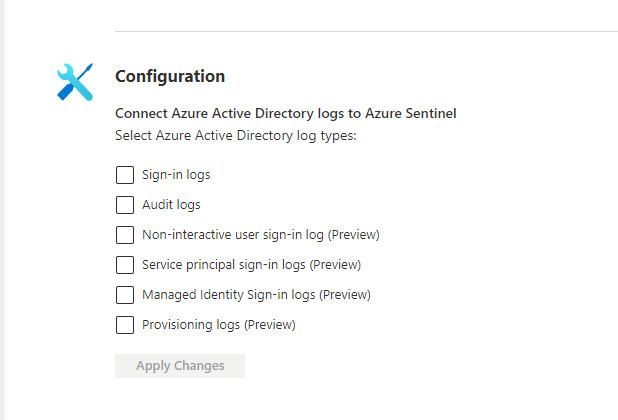
FIGURE 3-17 Configuration steps displayed for the Azure Active Directory data connector
Follow the configuration steps detailed to connect your data source to your workspace.
After you’ve connected the data source to your workspace, you can use the data connector’s page to check the status of the connector, when the last log was received, and the like, as shown in Figure 3-18.

FIGURE 3-18 Checking the status of the Azure Activity data connector in Azure Sentinel
Note BE Patient
After you have connected a data source, don’t be concerned if you don’t see logs being received immediately. Depending on the data source, it might take up to a few hours before logs will start being ingested from that source into your workspace.
Design and configure Syslog and CEF event collections
Syslog and CEF formats are used by a huge range of systems for logging. You’ll notice that if you review the prerequisites for the built-in Azure Sentinel data connectors that several of them use Syslog or CEF collection to ingest logs.
Tip Don’t Make A Custom Connector Unnecessarily
If there isn’t a native Azure Sentinel data connector for your data source, check to see if that source can output logs in Syslog or CEF. Don’t jump right into making a custom connector if you don’t need to!
Before we dive in to how to design a collector for these types of logs, let’s quickly step back and understand what Syslog and CEF are.
Syslog
Syslog has been around for a long time in computing terms—it first came into existence in the 1980s—and was documented in RFC 3164 in the early 2000s by the IETF. I deliberately use the word “documented” rather than “standardized,” as you might be more used saying when referring to RFCs. This is because the only consistent part of a Syslog message is the beginning portion, where there is a timestamp and IP address or hostname. The contents of the remaining message can vary from source to source. Syslog logs are sent to the Syslog table.
Common Event Format (CEF)
CEF is also known as “Syslog CEF” because CEF is a normalized version of Syslog. It is already parsed and formatted, so it requires less work when the log is ingested into a SIEM solution. If a data source you want to connect to Azure Sentinel can output in Syslog or CEF, choose CEF! CEF logs are sent to the CommonSecurityLog table. CEF logs are formatted like this:
CEF:Version|Device Vendor|Device Product|Device Version|Signature
ID|Name|Severity|Extension
Note Query Time Parsing
Syslog will require further parsing before it can be used, which can be done in KQL using query time parsing. Microsoft has written some parsers to get you started. You can learn more about query time parsing in Azure Sentinel at https://docs.microsoft.com/en-us/azure/sentinel/normalization#installing-a-parser.
Syslog/CEF collector architecture options
The great news is that it doesn’t matter whether you’re collecting Syslog or CEF, the agent used and architectural considerations are exactly the same. A Syslog/CEF collector for Azure Sentinel uses the Linux version of the Log Analytics agent, also known as the OMS agent.
Tip Installation Script
Installation of this agent is very simple, and Microsoft provides an installation script that you can learn more about at https://docs.microsoft.com/en-us/azure/azure-monitor/agents/agent-linux.
With regard to the architecture choices for your Syslog/CEF collector, you have two choices: Deploy on-premises or deploy in the cloud. Both architectures are supported, so ultimately, you will need to decide what works best for your environment. A cloud-based collector offers the elasticity and resiliency of cloud resources but might require more on-premises configuration. For example, if there is a firewall between the on-premises environment and the network connection to the Azure cloud (such as via Express Route, VPN, and so on), then ports would need to be opened for every Syslog/CEF source to be allowed through to reach the cloud. This might not be feasible or acceptable for security teams. In this case, an on-premises collector could better serve the implementation. As with so many things in IT implementations, there are pros and cons to each choice. These architecture options are shown below in Figures 3-19 and 3-20.
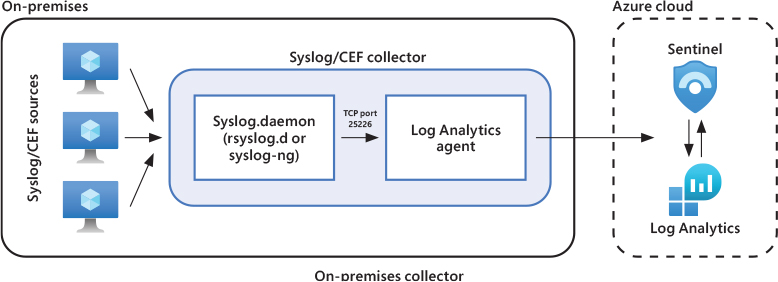
FIGURE 3-19 Architecture for an on-premises-based Syslog/CEF collector

FIGURE 3-20 Architecture for a cloud-based Syslog/CEF collector
Tip Events per Second (EPS)
Remember to size your collectors appropriately depending on the number of events per second (EPS) that you expect to collect from your environment. A single log forwarder machine using the rsyslog daemon has a supported capacity of up to 8500 EPS.
Design and configure Windows Events collections
Windows security events are events logged by devices using the Windows OS (servers and endpoints, physical and virtual) and can be sent to an Azure Sentinel workspace for analysis and for correlation with other events in your environment. Azure Sentinel provides a built-in connector where you can stream Windows security events to your workspace, as shown in Figure 3-21. Logs collected using this data source go into the SecurityEvents table.
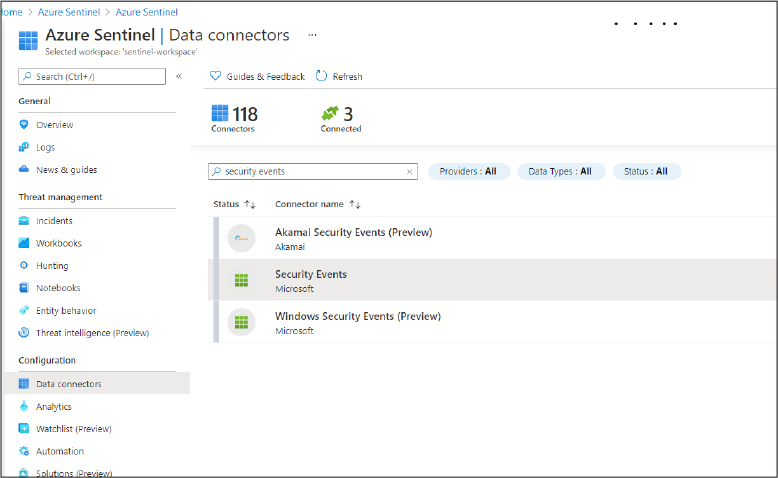
FIGURE 3-21 The built-in Security Events connector
Tip Security Events Connector
If you are using the same workspace for Azure Sentinel as Azure Security Center, you might already be collecting Windows security event logs if you have configured this in ASC. If this is the case, you don’t need to do anything in the Azure Sentinel UI, and you should already see the Security Events connector showing as Connected.
As we did with collecting Syslog and CEF events, we will be using the Log Analytics agent to collect Windows security events, but we will be using the Windows version (unsurprisingly!). Unlike Syslog/CEF collection, we won’t be creating a centralized collector. When using the Windows version of the Log Analytics agent, each agent streams directly to the Azure Sentinel workspace. There is no intermediary device. In Figure 3-22, you can see how Windows systems stream security events to a Sentinel workspace.

FIGURE 3-22 Streaming Windows security events to Azure Sentinel
Note Log Analytics Gateway
If you have Windows systems that have no Internet access in your environment, you can use a Log Analytics gateway to act as a forward proxy for your Windows security events. You can learn more about the Log Analytics gateway at https://docs.microsoft.com/en-us/azure/azure-monitor/agents/gateway.
Configuring Windows security event collection for Azure Windows Virtual Machines
Folow these steps to configure the Security Events connector in Azure Sentinel for Azure Windows Virtual Machines:
Navigate to the Azure portal by opening https://portal.azure.com.
In the Search bar, type Sentinel, and under Services, click Azure Sentinel. The Azure Sentinel Workspace page appears.
Select the workspace you want to use. The Azure Sentinel | Overview page appears.
Click Data Connectors, which opens the Data Connectors page.
Select the Security Events Data Connector and click the Open connector Page button. The Security Events Data Connector | Overview page appears.
The shortcuts to install the Log Analytics agent on your Windows system can be found on the bottom-right part of the connector’s page. Figure 3-23 shows the shortcuts to installation on the connector page.

FIGURE 3-23 Log Analytics agent connector installation locations
Click Download & Install Agent For Azure Windows Virtual Machines.
On the Virtual Machines page, select the machine(s) that you want to connect.
On the AzureWindowsServer page, click Connect. You will see the connection to your Sentinel workspace taking place, as shown in Figure 3-24.
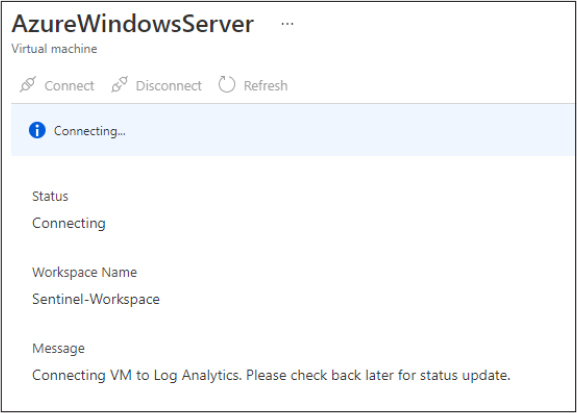
FIGURE 3-24 Connecting an Azure virtual machine to Azure Sentinel for Windows security event streaming
Configuring Windows security event collection for non-Azure Windows Machines
Follow these steps to configure the Security Events connector in Azure Sentinel for non-Azure Windows machines:
Navigate to the Azure portal by opening https://portal.azure.com.
In the Search bar, type Sentinel, and under Services, click Azure Sentinel. The Azure Sentinel Workspace page appears.
Select the workspace you want to use. The Azure Sentinel | Overview page appears.
Click Data Connectors. The Data Connectors page appears.
Select the Security Events Data Connector and click the Open Connector button.
The shortcuts to install the Log Analytics agent on your Windows system can be found on the bottom-right of the connector’s page. Figure 3-25 shows the installation shortcuts on the connector page.

FIGURE 3-25 Downloading the Log Analytics agent for non-Azure Windows machines
Click Download & Install Agent For Non-Azure Windows Machines. The Agents Management page appears, as shown in Figure 3-26.
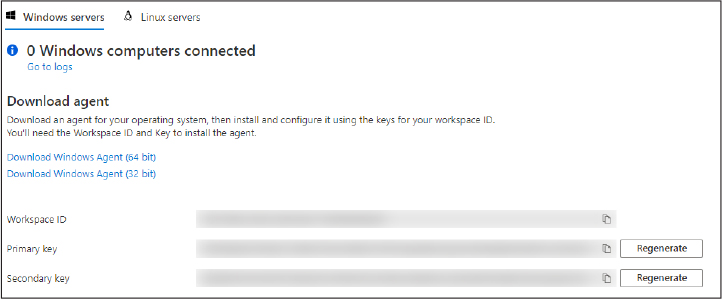
FIGURE 3-26 Retrieving Workspace ID and workspace keys
Make a note of your Workspace ID and workspace keys (Primary Key and Secondary Key) to input into the agent later.
Run the installer package on your target system, and it will launch the Microsoft Monitoring Agent Setup Wizard, as shown in Figure 3-27.

FIGURE 3-27 Microsoft Monitoring Agent Setup Wizard
Agree to the Microsoft software license terms and select a folder in which to install the agent.
In Agent Setup Options, select Connect The Agent To Azure Log Analytics (OMS), as shown in Figure 3-28.
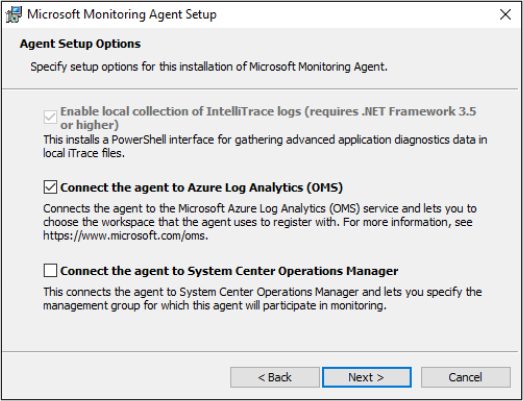
FIGURE 3-28 Microsoft Monitoring Agent Setup
After clicking Next, you will asked to provide your Workspace ID and Workspace Key for your Sentinel workspace, as shown in Figure 3-29.
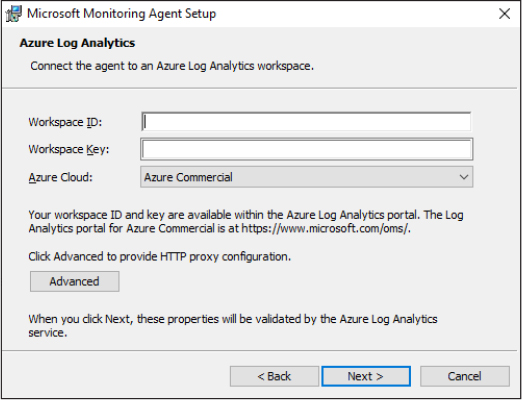
FIGURE 3-29 Adding the Workspace ID and Workspace Keys
Click Next and complete the installation of the agent.
Return to the Azure portal and check the Agents Management page where you should now see your non-Azure machine connected, as shown in Figure 3-30.

FIGURE 3-30 Agents Management page
Choosing Windows security events to stream to an Azure Sentinel workspace
There are thousands of Windows Events, and it can be hard to choose which ones you need to ingest, so Microsoft provides preset options in the connector itself (shown in Figure 3-31):
All Events
Common
Minimal
None

FIGURE 3-31 Preset streaming options available for the Security Events connector
More Info Windows Security Events Included in Each Preset Option
You can learn more about the Event IDs included in each preset streaming option at https://docs.microsoft.com/en-us/azure/sentinel/connect-windows-security-events.
Configure custom threat intelligence connectors
Using threat intelligence (TI) feeds enriches the information a SIEM collects and thus enhances your security operations. TI feeds contain information about cyberthreats. Most typically, we see these expressed as indicators of compromise (IOCs). An IOC could be a known malicious IP, URL, hash value, and the like. If this IOC is matched to values in the data from your IT environment, it could indicate that an attacker is (or has been) in your environment. This is why IOCs from threat intelligence are often used for proactive hunting. From an incident perspective, if an incident is raised where some entities have matches to your threat intelligence, an SOC might choose to raise the severity of the incident because there is a higher likelihood that known attackers are part of the incident.
IOCs often have an expiration date attached to them. We know that attackers will change how they present their attacks frequently to avoid detection, which is why IOCs need frequent updating via a TI feed. TI feeds can be purchased from a vendor, but there are also open-source and free-to-use TI feeds available in the community.
In Azure Sentinel, when TI feeds are connected, the IOCs from the feed will be stored in the ThreatIntelligenceIndicator table, and you’ll be able to review them in a more user-friendly format on the Threat intelligence page in the Sentinel UI. You can also add IOCs manually on the New Indicator blade, as shown in Figure 3-32.
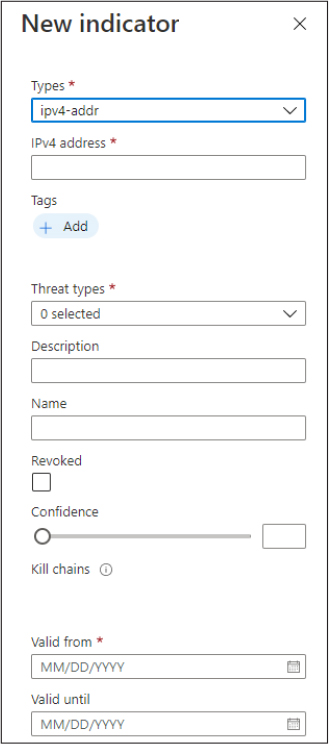
FIGURE 3-32 Manually adding an IOC
If you are using a threat intelligence feed, it is likely to be sent from a STIX/TAXII setup:
STIX (Structured Threat Information eXpression) STIX is a standardized language that has been developed by MITRE in a collaborative way to represent structured information about cyber threats.
TAXII (Trusted Automated eXchange of Indicator Information) TAXII is a transport vehicle for STIX-structured threat information that allows STIX information to be exchanged between parties.
STIX and TAXII were created to allow easy and consistent sharing of threat information between individual people or organizations worldwide.
Azure Sentinel has a built-in threat Intelligence data connector that can be used to connect to TAXII servers and import IOCs into the ThreatIntelligenceIndicator table.
Tip Older TAXII Versions Not Supported
Azure Sentinel only supports connections to the most recent versions of TAXII: 2.0 or 2.1. Older versions of TAXII are not supported.
Follow these steps to configure the Threat Intelligence Connector in Azure Sentinel:
Navigate to the Azure portal by opening https://portal.azure.com.
In the Search bar, type Sentinel, and under Services, click Azure Sentinel. The Azure Sentinel Workspace page appears.
Select the workspace you want to use. The Azure Sentinel | Overview page appears.
Click Data Connectors. The Data Connectors page appears.
Select the Threat intelligence (TAXII) Data Connector and click the Open Connector button. The Threat Intelligence (TAXII) Data Connector appears, as shown in Figure 3-33.

FIGURE 3-33 Configuring a TAXII server
Under Configuration, complete the details required to connect your TAXII server to Azure Sentinel. (This is standard information and should be provided by the threat intelligence feed provider.) Click Add.
You can check which TAXII servers you have connected to your Sentinel workspace by scrolling down to the bottom of the Threat Intelligence Connector page and checking the List Of Configured TAXII Servers, as shown in Figure 3-34.

FIGURE 3-34 Checking configured TAXII servers on the Threat intelligence connector page
You can view IOCs on the Threat intelligence page in the Sentinel UI, as shown in Figure 3-35.

FIGURE 3-35 Viewing imported IOCs on the Threat Intelligence page
Note Active Column
IOCs that have expired will still appear in the ThreatIntelligenceIndicator table because of the immutable nature of Log Analytics and will only age out when they reach the workspace’s configured retention period. To combat this, the ThreatIntelligenceIndicator table has an Active column; when an IOC’s expiry date is reached, a new entry will be added with False in the Active column, and it will no longer be used by Azure Sentinel for IOC matching.
Create custom logs in Azure Log Analytics to store custom data
Sometimes, it won’t be possible to use any of the native methods described in the previous sections to connect your data source…so what then? The main method by which you can ingest custom logs into Azure Sentinel is to use the HTTP Data Collector API, but there are different ways to interact with it—direct via the API or via Azure Logic Apps. Depending on the use case, volume, and type of data you need to ingest, it will likely become obvious which method is better to use.
Tip Ingesting Custom Logs
As a rule of thumb, it is best to only ingest custom logs via Azure Logic Apps for relatively small quantities of data, such as enrichment data.
Custom log ingestion via the Azure Monitor HTTP Data Collector API
Azure Monitor provides the HTTP Data Collector API that can ingest data from a REST API client. Remember, Log Analytics is part of the wider Azure Monitor platform, so don’t be put off by the name! Data must be sent to the HTTP Data Collector API in JSON format, and from there, it will be parsed into a custom table. When you submit the data, an individual record is created in the repository for each record in the request payload, as shown in Figure 3-36.
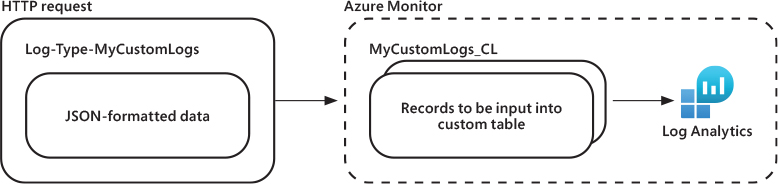
FIGURE 3-36 Sending data to the Azure Monitor HTTP Data Collector API
You have many options when choosing how to interact with this API; typically this would be via an existing REST API client or a serverless function written in Powershell, Python, C#, and so on. There really are no limits to how you interact and send data as long as you stick to the rules and formats required by the API.
More Info Using the Azure Monitor HTTP Data Collector API
Although outside the scope of this exam, you can read more about the exact formats required and see some code examples at https://docs.microsoft.com/en-us/azure/azure-monitor/logs/data-collector-api#concepts.
Custom log ingestion via Azure Logic Apps
We’ll be covering more about Azure Logic Apps and automation later in this chapter, but in this section we’ll talk about how you can configure a Logic App to ingest custom data into your workspace. If you’re unfamiliar with this product, Logic Apps provides a GUI-based interface to write automation scripts called Playbooks. If you’ve ever used Microsoft Flow, you’ll have a good idea of what you’ll be doing in Azure Logic Apps.
Let’s walk through an example of pulling data from an external API to store in a custom table in Log Analytics. In my example, we’re going to be pulling weather data, but in real life security operations this is more likely to be threat intel or something else that enriches the data in your workspace.
Navigate to the Azure portal by opening https://portal.azure.com.
In the Search bar, type Sentinel, and under Services, click Azure Sentinel. The Azure Sentinel Workspace page appears.
Select the workspace you want to use. The Azure Sentinel | Overview page appears.
Click Automation. The Automation page appears, as shown in Figure 3-37.

FIGURE 3-37 Reviewing the Automation page
Click Create > Add New Playbook. The Create A Logic App page appears, as shown in Figure 3-38.
Fill out the Subscription, Resource Group, Region, and Name of the Playbook and click Review + Create to validate your template.
When your template has validated, click Create.
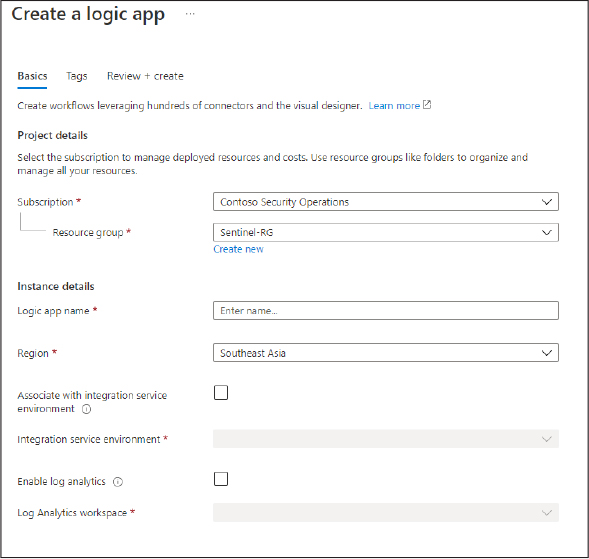
FIGURE 3-38 Completing the details of a Logic App
Open the blank Playbook you have created. You will be given the option to choose from various predefined templates. This time, select Blank Logic App. The Logic Apps Designer page appears.
We can now search for a trigger to kick-off the Playbook in the Logic App Connector Gallery. In Figure 3-39, you can see that we are searching for the Schedule trigger.
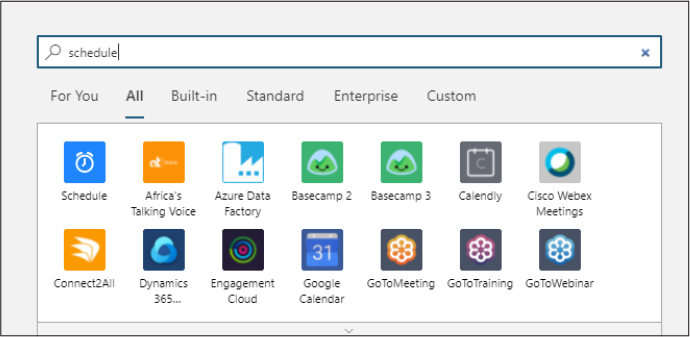
FIGURE 3-39 Searching for the Schedule trigger in the Logic App connector gallery
Note Don’t Confuse Connectors
Don’t confuse a Sentinel data connector with a Logic App connector. They are two very different things! Logic App connectors are a collection of triggers and actions that you can add to a Playbook to make your automation flow.
Select the Schedule connector and choose the Recurrence trigger.
Configure how frequently you want this Playbook to run. In my example, I’m going to configure it to run every 5 minutes, as you can see in Figure 3-40.
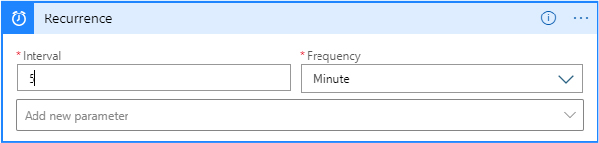
FIGURE 3-40 Configuring the frequency of the Playbook running in the Logic App Designer
For the next step in the Playbook, select HTTP Logic App Connector > HTTP Action. This is where we will configure the call to the external API for the custom data to be ingested.
Select GET for Method and add the URI for the API, plus any other necessary parts of the request such as authentication, headers, and so on. You can see the completed one for my weather API in Figure 3-41.
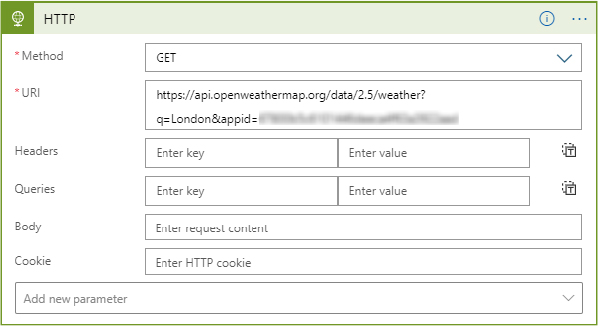
FIGURE 3-41 HTTP request to the external API
The final step in the Playbook will be to send this data into Log Analytics. Search for and select the Azure Log Analytics Data Collector and then select the Send Data action.
You will be asked to complete the details of the workspace to which you want to send the data (see Figure 3-42). Give the connection a memorable name and provide your workspace ID and key. (Earlier in this chapter, we explained how to obtain these.)
Click Create.

FIGURE 3-42 Completing the connection with the workspace
As shown in Figure 3-43, you will need to provide the JSON Request Body details that will be received by the Playbook. This allows the Playbook to parse the data correctly when it is received. You will also need to specify the name of the custom table that the data will be sent to in the Custom Log Name field.

FIGURE 3-43 Completing the JSON Request Body format and custom table names in the Playbook
Click Save at the top left of the Logic App Designer page.
Navigate to the Playbook’s Overview page and select Run Trigger > Recurrence to test your Playbook (see Figure 3-44). You will be able to see whether the Playbook ran successfully by looking at the bottom-right of the page.

FIGURE 3-44 Manually running a Playbook to test it
Now it’s time to check to see whether our logs were received properly into our custom table: Navigate to the Logs page. As you can see in Figure 3-45, on the Tables tab, we now have an extra drop-down menu, Custom Logs. Whatever name you specified in the Custom Log Name will be appended with
_CL. This prevents overlaps with the naming of built-in-in tables in Log Analytics.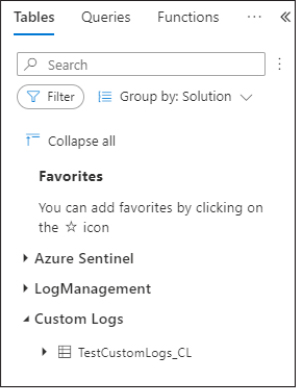
FIGURE 3-45 Custom logs listed alongside other tables on the Logs page
Skill 3-3: Manage Azure Sentinel analytics rules
Analytics rules are the Sentinel rules that correlate the logs that have been sent to the underlying Log Analytics workspace. Analytics rules run on a periodic basis with the intention of correlating specific patterns of events and activities in your environment logs. If a match to the rule is found, an alert and/or an incident is created, which your security operations team can act upon. (This is covered in more detail later in this section.)
Design and configure analytics rules
As with the rest of the product, you’ll find that Azure Sentinel has many out-of-the-box analytics rules to start you off in your implementation. If you’ve worked with other SIEMs before, you might know them as “detection rules.” These rules have been written by Microsoft security experts and, while they are fully customizable to your environment, they are a great way to get started with your base analytics rules in your Azure Sentinel implementation. It’s worth reviewing the out-of-the-box templates regularly to check if there are new ones; Microsoft adds more on a regular basis. There are five types of analytics rules in Azure Sentinel:
Scheduled query These queries run on a fixed schedule (every 5 minutes, every hour, and the like), and you can see the query logic and can make changes to it. We will discuss how to do this later in this section.
Microsoft security These rules automatically create incidents based on alerts from other Microsoft security products. These rules are a great way to get your Azure Sentinel deployment up and running quickly.
Fusion Fusion uses scalable machine learning algorithms that can correlate many low-fidelity alerts and events across multiple products into high-fidelity and actionable incidents. Fusion is enabled by default. Because the logic is hidden and therefore not customizable, you can only create one rule with this template.
Machine learning (ML) behavioral analytics These templates are based on proprietary Microsoft machine learning algorithms, so you cannot see the internal logic of how they work and when they run. Because the logic is hidden and therefore not customizable, you can only create one rule with each template of this type.
Anomaly These rules use SOC-ML (machine learning) to detect specific types of anomalous behavior. Each rule has its own unique parameters and thresholds appropriate to the behavior being analyzed, and while its configuration can’t be changed or fine-tuned, you can duplicate the rule and change and fine-tune the duplicate.
First, let’s look at the Analytics page in the portal, which can be seen in Figures 3-46 and 3-47.

FIGURE 3-46 Navigating the Analytics page
We recommend that you enable all out-of-the-box templates that use data sources that you ingest into your workspace. It’s very easy to do: You can use the filters to filter rule templates by a specific data source, or you can just look at the rule template summary (see Figure 3-47) and look at Data Sources.

FIGURE 3-47 Checking the rule template summary on the analytics page
Pay attention to the color of the connector icon next to the name of the data source. If it’s green, then Sentinel has found that type of logs in the workspace; if it’s gray, then you need to add that log type for the rule to work properly. Figure 3-48 shows examples of both green (AzureActivity) and gray (Amazon Web Services) icons, with the green icon shown first.
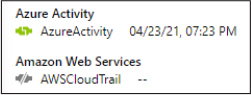
FIGURE 3-48 Data source indicator on the rule template summary
Note Rules and Data Sources
Azure Sentinel will not prevent you from creating rules from templates when you don’t have all the recommended data sources in your workspace. While you can create them, remember that rules can’t raise alerts if they don’t have all the data sources they need to correlate information!
To activate an analytics rule template:
Navigate to the Azure portal by opening https://portal.azure.com.
In the Search bar, type Sentinel, and under Services, click Azure Sentinel. The Azure Sentinel Workspace page appears.
Select the desired workspace. The Azure Sentinel | Overview page appears.
Click Analytics. The Analytics page appears, as shown in Figure 3-49.

FIGURE 3-49 The Analytics page
Select the Rule Templates tab.
Select the rule template you want to activate and at the bottom of the rule template summary, click Create Rule.
You will be taken to the Analytics Rule Wizard. Work your way through the tabs of the wizard. (These tabs are all prefilled when using a rule template.) After the validation check, click Create.
Note Customizing Analytics
All the tabs in the Analytics Rule Wizard are customizable. We will cover this in more detail later in this chapter.
You will return to the main Analytics page. Under the Active Rules tab, you should now see your newly created rule, as shown in Figure 3-50.

FIGURE 3-50 Checking active rules on the Analytics page
Create custom analytics rules to detect threats
Although the out-of-the-box analytics rules are a great way to start off your implementation, they aren’t optimized for a specific environment and therefore, you might want to customize these rules to make them more specific to your thresholds, operational procedures, and so on. There are many reasons for customizing query logic, but the most common reason is to reduce false positives (such as when a rule triggers an incident but further investigation indicates there wasn’t a security issue). SOCs are always trying to reduce false positives and noise because it wastes SOC analyst time. It is common for SOCs to not have enough analysts to look at alerts as it is, so they certainly don’t want them looking at false positives!
In this section, we will look at how you can customize analytics rules to optimize them. Let’s go back to the Analytics page and the analytics rule templates:
Navigate to the Azure portal by opening https://portal.azure.com.
In the Search bar, type Sentinel, and under Services, click Azure Sentinel. The Azure Sentinel Workspace page appears.
Select the workspace you want to use. The Azure Sentinel | Overview page appears.
Click Analytics. The Analytics page appears.
Select the Rule Templates tab.
Select the rule template you want to use and click Create Rule at the bottom of the rule template summary at the bottom-right of the page. For our example, I’m going to use the Failed AWS Console Logons But Success Logon To AzureAD Rule template. You will be taken to the Analytics Rule Wizard, as shown in Figure 3-51.

FIGURE 3-51 Customizing the General tab of an analytics rule
On the General tab, you can customize the Name, Description, and the MITRE Tactics that this rule detects on, as well as the Severity of the rule. In this example, I’m planning to change the failed login attempts in the rule’s logic, so I’m going to update the description of the number of failed logins from 5 to 10.
On the Set Rule Logic tab, you will see various aspects of the rule logic can be customized.
Rule Query The Kusto Query Language (KQL) of the query. (See the “Define incident creation logic” section later in this chapter for further details on this.) This is fully editable, and in this example, I’m going to change the variable named
signin_threshold, which can be seen in Figure 3-52. This threshold is currently set to 5 failed logins, but I’m going to change it to 10. What this means is that until there have been 10 failed logins for a user in AWS followed by a successful Azure login by the same user, this rule will not trigger and create an alert.Alert Enrichment This is where you can define entities that can be classified for further analysis by Azure Sentinel.
Query Scheduling In this section, you can configure how frequently your query runs and how far back in the logs the rule will look for matches (known as the lookback window). You can run queries in Azure Sentinel as frequently as every minute.
Threshold This allows you to define how many rule “hits” need to occur before an alert is raised. Generally, this can almost always be left on the default setting, Is Greater Than 0.
Event Grouping where you can configure how rule query results are grouped into alerts.
Note Keep Lookback Settings Consistent
Lookback windows can also be configured in the rule query logic itself. Remember to keep the lookback window consistent between the KQL logic and the rule settings in the portal.

FIGURE 3-52 Customizing the KQL of an analytics rule
Let’s move to the Incident Settings tab, as shown in Figure 3-53.

FIGURE 3-53 Customizing the incident settings of an analytics rule
The Incident Settings tab has many options that can be customized, and how these are configured is largely going to come down to the individual SOC and operational processes in an organization:
Incident Settings Here, you can enable/disable whether an incident in Azure Sentinel is triggered by an analytics rule. Often, people will say: “Of course I need an incident triggered from an analytics rule. That’s the whole point of the rules!” However, sometimes an alert is sufficient enough for an SOC to take note, but there is no need for a full-scale incident. A Playbook can be run on an alert, and automation might be able to take care of the actions that need to take place without having any human intervention. (More on that later in this chapter.) The SOC might decide that an incident is triggered only when a collection or threshold of multiple alerts occur. Again, the aim here is to maximize the efficiency of the SOC and to ensure that SOC analysts spend their time on the right events that haven’t been seen before and that require human intervention.
Alert Grouping If you’ve worked in security operations (or any other kind of monitoring, for that matter), you’ll likely have seen when a single event raises multiple incidents, overwhelming the analysts and your monitoring panel. Alert grouping can prevent this in an SOC by telling Azure Sentinel to group identical alerts into the same incident in a specified timeframe and thereby reducing noise.
Re-open closed matching incidents As the name suggests, this setting will allow Azure Sentinel to re-open a closed incident if an alert matching the alert grouping configured on the rule matches.
The Automated Response tab is where either automation rules or Playbooks can be attached to a rule. We discuss this in more detail later in this chapter.
After the validation check, click Create. You will return to the main Analytics page. On the Active Rules tab, you should now see your newly created rule.
Activate Microsoft security analytics rules
Microsoft security services perform in-depth analysis of the logs they process and generate high-fidelity alerts. The services in this suite are:
Microsoft Cloud App Security (MCAS)
Azure Defender
Azure Defender for IoT
Microsoft Defender for Endpoint
Microsoft Defender for Identity
Microsoft Defender for Office 365
Azure Active Directory Identity Protection
As we learned earlier in this section, these products’ alerts can be connected to Azure Sentinel using built-in data connectors. Instead of performing further analysis on these alerts, as they have already had a significant amount of analysis done in the service, you might want to create an Azure Sentinel incident right away. This can be achieved quickly and simply by using Microsoft security analytics rules.
Note Microsoft Security Service Alert Connector
If you have connected the Microsoft security service alert connector to your workspace, you will still find the alerts from that service in the SecurityAlerts table. Microsoft security analytics rules are a method to quickly raise incidents from those alerts as soon as they are received into the workspace.
Let’s learn how to activate these rules:
Navigate to the Azure portal by opening https://portal.azure.com.
In the Search bar, type Sentinel, and under Services, click Azure Sentinel. The Azure Sentinel Workspace page appears.
Select the workspace you want to use. The Azure Sentinel Overview page appears.
Click Analytics. The Analytics page appears.
Click Create and select Microsoft Incident Creation Rule, as displayed in Figure 3-54.

FIGURE 3-54 Creating a Microsoft security analytics rule
The Microsoft Incident Creation Rule Wizard appears, as shown in Figure 3-55.

FIGURE 3-55 Configuring a Microsoft security analytics rule in the Analytics Rule Wizard
The wizard has several fields that need completing, but you will notice that it has far fewer configurables than a scheduled query rule:
Name The name of the rule.
Description The description of the rule.
Status Set to Enabled or Disabled.
Microsoft Security Service This is where you select the type of Microsoft security service alerts that the rule will listen for. You must have one rule per Microsoft security service; they cannot be combined into one.
Filter By Severity You can choose to only create incidents for alerts of a certain severity. For example, you might only choose to create incidents for high- and medium-severity alerts using the rule.
Include/Exclude Specific Alerts This is where you can explicitly include or exclude certain alerts. This can be useful if a security service generates a noisy alert that does not require an incident to be raised.
Tip Include/Exclude Specific Alerts Feature
Be careful when using the Include/Exclude Specific Alerts feature. While this is an effective way to reduce noise coming from your environment, it means that every instance of the alert specified will not raise an incident, so it is important to be sure that by using this feature, you won’t inadvertently miss a real incident.
The Automated Response tab is where either automation rules or Playbooks can be attached to a rule. We will cover this in more detail later in this chapter.
After the validation check, click Create.
You will return to the main Analytics page. On the Active Rules tab, you should now see your newly created rule.
Configure connector-provided scheduled queries
We do often seem to start a section with a statement like this, but once again, I’ll be referring to Azure Sentinel’s out-of-the-box capabilities and how Microsoft makes it straightforward to configure relevant analytics rules. Earlier in the chapter, we already looked at the data source connector page and analytics rule templates, and in this section, we’ll again be looking at these parts of Azure Sentinel.
If you open a Data Connector page, you can see the instructions that tell you how to connect that data source to the workspace. You might have noticed the Next Steps tab, which contains links to workbook templates, query samples, and Relevant Analytics Templates (see Figure 3-56).

FIGURE 3-56 Relevant Analytic Templates
Here, you can click Create Rule, and you will be taken to the Analytics Rule Wizard—Create New Rule From Template page. From there, you can create and customize this rule. (We walked through using this wizard earlier in this chapter in “Create custom analytics rules to detect threats.”)
Tip In Use
When checking relevant analytic rule templates, rules that have already been deployed will be marked with IN USE (see Figure 3-56).
Although this isn’t showcasing functionality that can’t be found elsewhere in Azure Sentinel—especially on the Analytics page—it is strongly recommended that you activate all rule templates that use the data sources you are choosing to connect to your workspace, so having another method to verify this has been done correctly is never a bad thing!
Configure custom scheduled queries
Earlier in this skill, we discussed how to customize analytics rule templates. Now let’s discuss how to create a custom scheduled query from scratch. If you’ve been following along using Azure Sentinel and testing out the steps earlier in this section, you’ve probably got a good idea what’s coming in this section. We’ll be using the Analytics Rule Wizard on the Analytics page to create our brand-new rule. This time—rather than deploying or amending an existing rule template—we will be completing the entire rule ourselves.
So why do we need these rules? Aren’t the rule templates enough to cover most likely security events? Although the analytics rule templates are written by experts and cover a wide range of scenarios, it is likely that a large, complex IT environment will need to have custom analytics rules for detections that are very specific to that environment or that are for data sources that don’t have any rule templates.
Let’s step through creating an analytics rule from scratch:
Navigate to the Azure portal by opening https://portal.azure.com.
In the Search bar, type Sentinel, and under Services, click Azure Sentinel. The Azure Sentinel Workspace page appears.
Select the workspace you want to use. The Azure Sentinel Overview page appears.
Click Analytics. The Analytics page appears.
Click Create > Scheduled Query Rule. The Analytics Rule Wizard—Create page New Rule page appears, as shown in Figure 3-57.
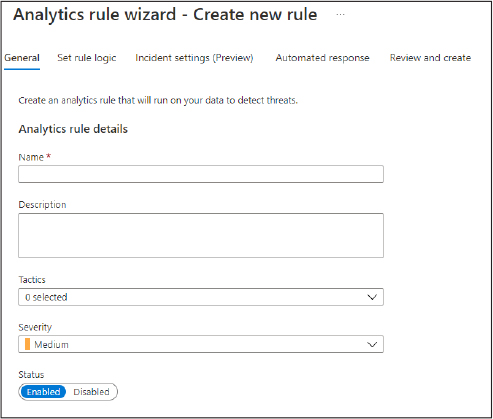
FIGURE 3-57 A blank analytics rule wizard to create a new analytics rule
The wizard is the same as the Analytics Rule Wizard used for templates, except this time, it is completely blank for you to fill in as you please.
We covered the different fields and how to complete them in the wizard in the “Create custom analytics rules to detect threats” section, earlier in this chapter.
After the validation check, click Create.
You will return to the main Analytics page. On the Active Rules tab, you should now see your newly created rule.
Define incident creation logic
For the final part of this section, we’re going to address how to create incident creation logic, which is something we’ve skipped over to leave for the grand finale of this section. It’s important to remember that although the exam outline (and hence, the title of this section) calls for learning how to define incident creation logic, what we’re going to discuss in this section is the use of the KQL query language, which is used to define queries, events, alerts, and incidents.
Kusto Query Language (KQL)
Kusto Query Language (KQL) is a query language used in several Microsoft products, so if you’re learning about Microsoft security services, then it’s worthwhile investing some time to become familiar with the language. A not-so-well-known fact is that Kusto Query Language is named after Jacques Cousteau, the famous underwater explorer. KQL is a high-level language (meaning that it is closer to human language), but it has the flexibility and power to perform complex queries. Although not identical, if you’ve spent time using SQL, then learning KQL should be a straightforward task.
KQL is a complex language with many operators, so in this section, we will cover the basics of KQL and some of the operators commonly used to form incident creation logic.
Exam Tip
For the SC-200 exam, make sure that you are comfortable reading KQL queries that typically might be found in an Azure Sentinel analytics rule. Aside from this study guide, study the rule templates in Azure Sentinel as examples of real-life incident/alert creation logic, and make sure you understand the KQL in them.
Let’s start with the basics. In KQL, you must define the table that you are searching in. In this example, I’m searching the OfficeActivity table (shown in Table 3-1) for Exchange workloads. The where operator is used to filter the table to a subset of rows. In this case, that means any rows that have Exchange in the OfficeWorkload column.
OfficeActivity
| where OfficeWorkload == "Exchange"
Note KQL Spacing
We have spaced-out the KQL to make it easier to read, but you can put KQL on one line with correct spacing and syntax.
A very commonly used operator (and one of my personal favorites) is take. This operator returns the number of rows you specify:
OfficeActivity
| take 10
In this case, the query would return 10 rows from the OfficeActivity table. This operator is especially useful for testing queries when you’re not sure how many results it might bring back. Also, it’s helpful for looking at the structure and a few examples of rows from the specified table.
Note Guaranteeing A Sort Order
When only the take operator is used by itself, the rows that are returned aren’t guaranteed to be the same each time the query is run. You can only guarantee the sort by using the take operator in conjunction with a sort by operator, which is covered next.
Sort is a powerful operator that does exactly as the name suggests: It sorts rows of the table by one or more specified columns in ascending or descending order:
OfficeActivity
| sort by OfficeWorkload, UserId asc
In this example, we’re sorting the OfficeActivity table (see Table 3-1) in ascending order by the OfficeWorkload and UserId columns. A close relative of this operator is top, which will return the top values after the sort (for example, the top 10 or top 100). This can be very useful for making queries more efficient if you don’t require the entire contents of the table to be sorted, which is often the case in security queries. Often, searches will be looking for things such as the top number of failed logins in an environment and the users associated with them.
TABLE 3-1 OfficeActivity table
KQL Operator |
Description |
Syntax |
Example query |
|---|---|---|---|
Where |
Filters on a specific predicate |
T | where Predicate |
|
Take |
Returns the specified number of records |
T | take NumberOfRows |
|
Sort |
Sorts rows of the table by one or more specified columns in ascending or descending order |
T | sort by expression1 [asc|desc], expression2 [asc|desc], … |
|
Top |
Returns the first N rows of the dataset when the dataset is sorted using a column or expression |
T | top numberOfRows by expression [asc|desc] [nulls first|last] |
|
Count |
Counts the number of records in the specified table |
T | count |
|
Summarize |
Groups the rows according to the by group columns, and calculates aggregations over each group |
|
|
Extend |
Creates additional, calculated columns and adds them into the table |
T | extend [ColumnName ] |
|
Project |
Selects the columns to include in the query result in the order specified |
T | extend [ColumnName] |
|
Let |
Creates a variable that can be referenced in queries |
let Name = ScalarExpression | TabularExpression |
|
Note Queries Don’t Change Underlying Data
All extra columns and tables created when queries run are ephemeral and exist only for the duration of the query. They are not stored in the underlying workspace. Remember that Log Analytics is immutable and thus, queries cannot change the underlying data.
Let’s break down one of the query templates to better understand how KQL works in practice. In Figure 3-58, the Failed AWS Console Logons But Success Logon To AzureAD rule is shown.
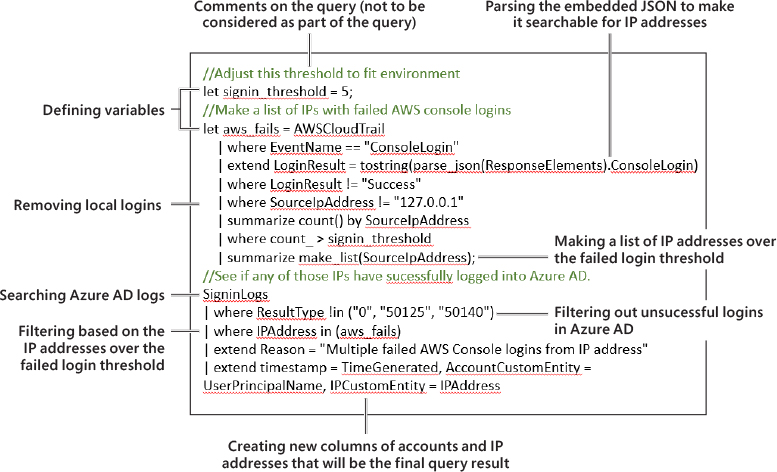
FIGURE 3-58 Breaking down the Failed AWS Console Logons But Success Logon To AzureAD analytics rule
The KQL in the rule is shown in Listing 3-1.
Listing 3-1 Failed AWS Console Logons But Success Login to AzureAD
//Adjust this threshold to fit environment
let signin_threshold = 5;
//Make a list of IPs with failed AWS console logins
let aws_fails = AWSCloudTrail
| where EventName == "ConsoleLogin"
| extend LoginResult = tostring(parse_json(ResponseElements).ConsoleLogin)
| where LoginResult != "Success"
| where SourceIpAddress != "127:0:0:1"
| summarize count() by SourceIpAddress
| where count_ > signin_threshold
| summarize make_list(SourceIpAddress);
//See if any of those IPs have sucessfully logged into Azure AD.
SigninLogs
| where ResultType !in ("0", "50125", "50140")
| where IPAddress in (aws_fails)
| extend Reason = "Multiple failed AWS Console logins from IP address"
| extend timestamp = TimeGenerated, AccountCustomEntity = UserPrincipalName,
IPCustomEntity = IPAddress
Let’s break this rule down step-by-step:
The
signinthreshold variable is declared as5and is namedsignin_threshold.A second variable is declared as
aws_fails, but this variable is a list of IP addresses, so there are more lines of KQL to filter out these IP addresses.Note that comments can be added to the query and prepended with
//, and they will be ignored by the query parser.To find a list of IP addresses from AWS Cloudtrail, the query first searches for
ConsoleLogin events.A new column is created using the
extendoperator calledLoginResult. As part of the creation of this column, the query is using theparse_jsonoperator is used to parse the embedded JSON in theResponseElementscolumn, so the query can search for records that do not containSuccess.Local logins are removed (127.0.0.1).
The number of unsuccessful logins are summarized by the
SourceIpAddresscolumn.A list is created of any IP addresses that have been counted by the query as having more than the threshold (5) unsuccessful login attempts.
This list of IP addresses is now our
aws_failsvariable.Moving to the second part of the query, it searches Azure AD logs to see if there have been any successful logins to Azure from the list of IP addresses we made in the first part of the query.
Finally, any matching results will be presented in a user-friendly manner and mapped to entities using the
extendoperator and custom entities.
Tip Uncoder.IO
If you’re trying to translate rules from another SIEM to KQL, uncoder.io is a great free tool to use (see https://uncoder.io/). It provides rule “translations” from other SIEM languages and is a great way to pick up KQL if you have previously worked on other SIEMs.
Skill 3-4: Configure Security Orchestration, Automation, and Response (SOAR) in Azure Sentinel
Security orchestration, automation, and response (SOAR) is a powerful tool that can help streamline security operations and is sometimes overlooked in the content of Azure Sentinel. People forget that Azure Sentinel is both a SIEM and a SOAR product. In the past, SIEM and SOAR products were separate, had to be purchased separately, and might have not come from the same vendor. In this section, we’ll learn about how to work with the SOAR capabilities in Azure Sentinel.
Create Azure Sentinel Playbooks
If you’ve used other Azure products, you might already be familiar with Azure Logic Apps, which is the main “engine” that drives automation in Azure Sentinel. Azure Logic Apps is a GUI-based tool that can create complicated automation Playbooks with little-to-no programming and coding knowledge required. This is great for SOC analysts and SOC engineers who might have little previous knowledge of how to make automation scripts. If you’ve used Microsoft Flow before, you’ll also have a good idea of what to expect when it comes to creating automation in Azure Sentinel.
Before we go any further, let’s have a terminology check to clarify our understanding:
Azure Logic Apps This is the name of the Azure service that provides automation throughout the Azure cloud, including for Azure Sentinel. Because Azure Logic Apps is a separate service to Azure Sentinel, it requires separate permissions for a user to create and run Playbooks (which are discussed earlier in the chapter).
Playbook A Playbook is a collection of automated actions in a workflow.
Logic App connector This is not the same as an Azure Sentinel data connector. Instead, a Logic App Connector is a predefined trigger or action that can be added into a Playbook. At the time this book was written, there were more than 300 Logic App connectors.
More Info Logic App Connector List
You can look at the full current list of Logic App connectors here: https://docs.microsoft.com/en-us/connectors/connector-reference/connector-reference-logicapps-connectors.
There are three main scenarios for which automation is used in Azure Sentinel:
Alerting This is the most used type of automation and the most straightforward to configure. When an incident or alert is triggered, Playbooks can be configured to send emails, Teams messages, and the like to alert the on-call team that an incident has been raised.
Remediation This is where automation takes remedial action in the IT environment to contain or even stop a security incident. Examples here could be isolating a virtual machine that has an Azure Defender alert raised against it, blocking the account of a user in Azure AD when their activity indicates the account has been compromised, or taking a malicious IP address from an incident in Azure Sentinel and writing a block rule back to the firewall to stop traffic from that IP address.
Tip Alerting and Remediation
Although they can be configured independently of each other, alerting and remediation can—and usually should be—contained in one Playbook.
Enrichment This is where supplementary data is used to “enrich” raw logs and results. This can be done as an alert, when an incident is triggered, or during an investigation. For example, after an incident has been raised, a SOC analyst could run an enrichment Playbook to check if the IP address entities in the incident match third-party threat intel feeds (for example, VirusTotal).
Let’s look at how to create a simple email alert Playbook in Azure Sentinel:
Navigate to the Azure portal by opening https://portal.azure.com.
In the Search bar, type Sentinel, and under Services, click Azure Sentinel. The Azure Sentinel Workspace page appears.
Select the workspace you want to use. The Azure Sentinel | Overview page appears.
Click Automation. The Automation page appears, as shown in Figure 3-59.
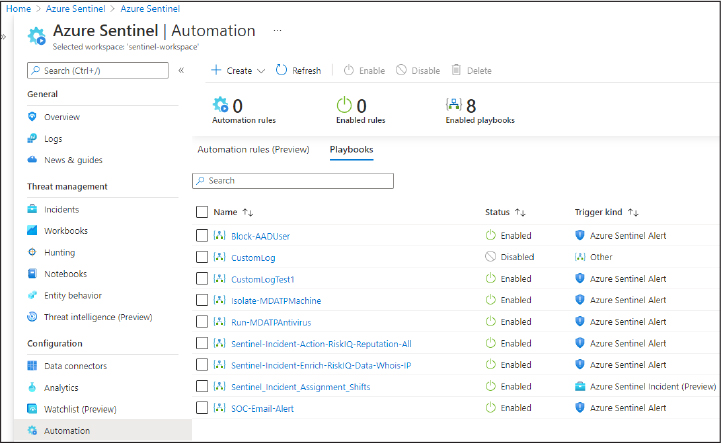
FIGURE 3-59 Reviewing the Automation page
Click Create > Add New Playbook. The Create A Logic App page appears, as shown in Figure 3-60.

FIGURE 3-60 Completing the details of a Logic App
Fill out the Subscription, Resource Group, Region, and Name of the Playbook and click Review + Create, as shown previously in Figure 3-60.
When your template has validated, click Create.
Open the blank Playbook you have created; you will be given the option to choose from various predefined templates. This time, we will select Blank Logic App. The Logic Apps Designer page appears.
We can now search for a trigger to kick-off the Playbook in the Logic App Connector gallery. In Figure 3-61, you can see that we are searching for an Azure Sentinel trigger.
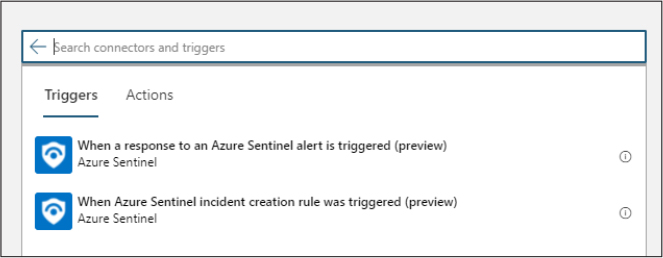
FIGURE 3-61 Searching for an Azure Sentinel trigger in the Logic App Connector gallery
Select the When A Response To An Azure Sentinel Alert Is Triggered trigger.
Sign in to create a connection to your Azure Sentinel workspace from the Playbook, as shown in Figure 3-62. You can also use a service principal or managed identity if you would prefer.

FIGURE 3-62 Signing in to Azure Sentinel from the Logic App designer
For the next step in the Playbook, I’m going to select the Outlook.com connector and under Actions, I will choose Send An Email (V2). This is where we will configure the email to be sent when an alert is raised in Azure Sentinel (see Figure 3-63).

FIGURE 3-63 Selecting the send email action in the Logic Apps designer
Note Email Connectors
In this example, I have chosen Outlook.com because this is where the email account that I am using resides. As is the case with other types of Logic App connectors, there are multiple email connectors, such as Outlook 365 and Gmail. Choose the right connector for your needs!
Sign in to the Outlook account; the connector will allow you to configure the email that will be sent when the Playbook is triggered. Add the address(es) to which you want the email to be sent, the title of the email, and the body of the email. There are other optional parameters that you can choose to configure at this point. It is possible to add dynamic content from the alert, such as the name of the alert, the severity, a description, and so on that will be populated dynamically from the alert when the Playbook is triggered. This helps give SOC analysts a better idea of what is happening in the initial notification, as shown in Figure 3-64.

FIGURE 3-64 Configuring the details of the email to be sent when an alert is triggered
Click Save at the top-left of the Logic App Designer page.
Navigate to the Overview page of the Playbook.
Select Run Trigger > Run to test-run your Playbook, as shown in Figure 3-65. Look to the bottom-right of the page to see whether the Playbook ran successfully.

FIGURE 3-65 Manually running a Playbook to test it
Arguably, the most attractive aspect of a SOAR capability is the automation aspect. Rather than relying on a human resource to take actions, automation can do things quicker and more reliably. We already touched on this during the analytics rule section of this chapter, but let’s dive into how to configure analytics rules and incidents to trigger Playbooks.
Why do we want to attach Playbooks to an analytics rule? Quite simply, this is the quickest and easiest way to alert and/or respond to a threat that Azure Sentinel detects. By attaching a Playbook to an analytics rule, when that rule is triggered, the Playbook will automatically run and take the specified actions. Even before an SOC analyst goes to look at the incident or alert, the Playbook could have taken remedial action. Some SOCs who have a mature automation capability can use automation to entirely resolve incidents without human intervention. Microsoft’s own SOC tries to do this where possible. Of course, there will be incidents or attacks that have never been seen before and cannot be automated away, but this means that SOC analysts can be more efficient in the time they spend on investigations rather than repetitive tasks.
In this section, we will look at how you can customize analytics rules to optimize them. Let’s go back to the Analytics page and the analytics rule templates:
Navigate to the Azure portal by opening https://portal.azure.com.
In the Search bar, type Sentinel, and under Services, click Azure Sentinel. The Azure Sentinel Workspace page appears.
Select the workspace you want to use. The Azure Sentinel | Overview page appears.
Click Analytics. The Analytics page appears.
Select the rule you want to attach a Playbook to and click Edit at the bottom of the rule template summary .
You will be taken to the Analytics Rule Wizard. Select the Automated Response tab.
Under Alert Automation, you can select Playbooks that are configured to run when the rule is triggered (see Figure 3-66).

FIGURE 3-66 Attaching a Playbook to an analytics rule
On the Review And Create tab, click Save after the validation check.
Note Only Enabled Playbooks Appear
Only Playbooks that are enabled will show in the drop-down menu to be attached to an analytics rule.
Use Playbooks to remediate threats
As we discussed earlier in this section, one of the most powerful aspects of a SOAR capability is the ability to remediate threats automatically. Even with the best and smartest SOC analysts in the world, they will never be able to respond as quickly or efficiently to an incident as automation can, which means automation can reduce the potential impact of an incident. Using Playbooks to remediate threats also frees up SOC analysts’ time to concentrate on incidents that haven’t been seen before, cannot be remediated automatically, and therefore need human intervention.
Although this is not an exhaustive list, here are some examples of the kind of security incident remediation that are possible using Azure Logic Apps:
Blocking a user account in Azure AD to prevent an account that might have been compromised from being able to access resources in the IT environment
Writing a rule to a firewall to block an IP address from which malicious traffic is being sent
Isolating a virtual machine in Azure that might have been compromised to prevent further lateral movement
Taking a snapshot of an Azure virtual machine for evidence gathering purposes when the machine exhibits suspicious activity
Blocking a malicious IP address on an on-premises Exchange server to prevent further access to the server from that specific address if suspicious traffic and/or activity has been seen originating from there
It can be challenging to decide what remediation action might be appropriate—especially if automated remediation is something that hasn’t been part of your security operations previously—so it’s important to take a step back and work out your use cases. Consider your most-raised security incidents and any repetitive tasks that SOC analysts undertake to resolve those incidents. Could these be automated? Are there some actions that you’d always like to take no matter what the incident is? What automation an organization chooses to take can vary widely. For example, a highly risk averse organization might choose to immediately block any Azure AD user accounts that exhibit suspicious activity, but this will put an additional burden on the service desk, which will have to re-enable accounts, posibly reducing productivity. There is also the risk of an account being blocked as a false positive because no SIEM can get things right 100 percent of the time.
Exam Tip
If you’re stuck for remediation Playbook ideas, check out the Azure Sentinel GitHub repo for Playbooks. It has many free examples of Playbooks that have been made by the community and are templatized so you can easily deploy them in several clicks. Before your SC-200 exam, make sure you have deployed a few of these Playbook templates to your own demo environment and that are familiar with how they can be constructed. See https://github.com/Azure/Azure-Sentinel/tree/master/playbooks.
Use Playbooks to manage incidents
In this chapter, it’s already been mentioned several times that even the best and most efficient SOC analysts don’t always have enough time to fully investigate every alert and incident that comes into an SOC. SOC analysts commonly undertake repetitive, time-consuming tasks to close incidents, change statuses, assign out incidents to on-shift analysts, and so on.
Aside from remediation, Azure Sentinel’s SOAR capabilities can help to reduce the administrative overhead of dealing with incidents. In this section, we’ll detail some examples—not an exhaustive list—of how overhead on incident management can be reduced using automation:
Automatically assigning incidents to on-shift analysts Using the shifts feature in Teams, a Playbook can be used to decide which analyst is on-shift and available and automatically assign that ticket to that analyst. The Playbook can also send a notification to that analyst to let them know an incident has been assigned to them using a messaging system, email, and the like.
Automatically assigning incidents to an entity owner Similar to the previous example, a Playbook can be used to look up the owner of an entity (for example, a host) that is involved in an incident and assign the incident for them to investigate. As in the previous example, the Playbook can also send a notification to the asset owner to let them know an incident has been assigned to them using a messaging system, email, and so on.
Creating a ticket in a third-party ticketing system Many organizations utilize SaaS ticketing systems to manage their IT operations and can draw statistics and reporting from that system about the number of incidents, time to resolve, and so on. Although the incident system in Azure Sentinel is robust, it might make more sense for incidents to be managed in a third-party system (such as ServiceNow) to align with the wider organization’s IT operations and reporting. A Playbook can be used to create a ticket in a third-party system when an incident is triggered and populate all the details of the incident in that third-party system. This saves SOC analysts’ time and effort copying and pasting the details across from one system to another.
Syncing third-party incident system updates with Azure Sentinel incidents Related to the previous example, if a third-party system is being used to track and manage incidents, a Playbook can be used to sync the information between Azure Sentinel and the third-party ticketing system, so there is no time-consuming copying and pasting between two systems (Copying and pasting between systems is not a good use of SOC analyst time!)
Enrich incident details from third-party systems When an incident is raised, a Playbook can be used to enrich the details of the entities involved in an incident and post a comment to give the analyst additional context. This saves the SOC analyst time and effort to log in to another portal or system to look up these details manually. Typical examples of enrichment include looking up the asset owner of a host or checking if an IP address matches any threat intelligence feeds (such as VirusTotal).
Add a user/host/IP address to a Watchlist A Playbook can take entities from an incident and add them into a watchlist so that they can be flagged in other analytics rules that refer to the watchlist. This saves an SOC analyst from having to do this manually.
Use Playbooks across Microsoft Defender solutions
If you’re using other Microsoft Defender solutions, using Playbooks is an ideal way to create a conjoined response to security events and incidents across your Microsoft product suite. As one would expect, Azure Logic Apps provides many ways to do this with Logic App connectors. As a reminder, when we’re discussing Microsoft Defender solutions, we’re talking about:
Azure Defender
Azure Defender for IoT
Microsoft Defender for Endpoint
Microsoft Defender for Identity
Microsoft Defender for Office 365
As you can see in Figure 3-67, when you search for defender in the Logic Apps designer, there are already many built-in triggers and actions that you can select from.

FIGURE 3-67 Searching for Microsoft Defender triggers and actions
Let’s look through an example to demonstrate how simple this can be. Rather than starting from scratch, as we have done earlier in this section, I’m going to use a template from the Azure Sentinel GitHub repo:
Navigate to the Azure Sentinel GitHub repo page by opening https://github.com/Azure/Azure-Sentinel.
Click playbooks to be taken to the Playbooks section of the repo.
Select the Playbook that you want to deploy. For this example, I’ll be selecting Isolate-MDATPMachine, as seen in Figure 3-68.

FIGURE 3-68 Selecting a Playbook template to deploy in the Azure Sentinel GitHub repo
Click Deploy To Azure, and you will be taken to the Azure portal and the Custom Deployment Template.
Note ARM Templates
Playbook templates from the Azure Sentinel GitHub repo are all Azure Resource Manager (ARM) templates. You can read more about ARM templates at https://docs.microsoft.com/en-us/azure/azure-resource-manager/templates/.
As shown in Figure 3-69, you need to complete the parameters of the Playbook template so that it can be deployed. The exact parameters each template will ask for will depend on the Playbook contents, but you will always be asked for Subscription, Resource Group, Region, and Playbook Name.

FIGURE 3-69 Entering parameters into a Playbook template for deployment
Let the validation check complete and then click Create.
Wait for your template to deploy successfully. Once complete, you will see the message shown in Figure 3-70.

FIGURE 3-70 A completed template deployment
Navigate to Azure Sentinel in the Azure portal and open the Automation page. You should find that your newly deployed Playbook should now be listed under playbooks.
Note Authorizing the Connection
Playbook templates will deploy connections, but sometimes you will need to authorize the connection after deployment before the connection is made. This is expected behavior and does not mean the Playbook template is broken.
Open the Playbook and open the Logic App Designer.
Expand the steps of the Playbook, and you will see the triggers and actions have already been prepopulated and configured by the ARM template that we deployed, as shown in Figure 3-71.
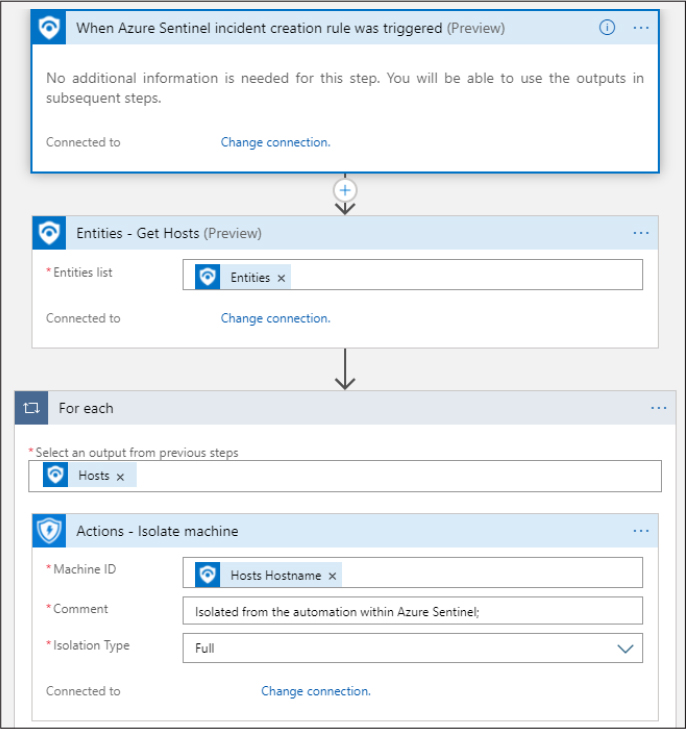
FIGURE 3-71 Checking a template deployment in Logic Apps designer
This Playbook is ready to go and can now be attached to an analytics rule, as we discussed earlier in this section.
Let’s walk through what this Playbook is doing:
When an incident creation rule is triggered, the Playbook will run.
Details about the host entities from the Azure Sentinel incident that has been raised are sent to Microsoft Defender for Endpoint.
Subsequently, those machines are isolated.
Far quicker than any human, Azure Sentinel and Microsoft Defender for Endpoint have worked together to isolate the hosts that are part of a security incident to reduce the “blast radius” or impact of an incident and—if these machines have been breached by an attacker—are stopping the attackers from being able to cause any more damage or from moving laterally in your IT environment.
Note Playbooks Across From-Scratch Solutions
Remember that you can make Playbooks that span across Microsoft Defender solutions from scratch, as described earlier in this section; it’s not only templates that can be utilized.
Skill 3-5: Manage Azure Sentinel incidents
If you’ve only seen one part of Azure Sentinel before you started studying for the SC-200 exam, the incident part is likely to have been it. Incidents are the first thing that comes to mind for most people when they think of what a SIEM does, and this is entirely understandable because incidents are where the action takes place. This is where an SOC analyst will investigate what is happening or what has happened in the IT environment to trigger an incident, verify whether the incident is a false-positive, understand the blast radius of the incident, and so on. The core function of an SOC (and the SOC analysts who work in that department) is to deal with security incidents.
This section of the chapter covers the skills necessary to investigate single- and multi-workspace incidents, triage and respond to Azure Sentinel incidents, and use User and Entity Behavior Analytics (UEBA) to detect threats according to the SC-200 exam outline.
Investigate incidents in Azure Sentinel
Investigating incidents is critical for an SOC analyst to understand the severity and scope of a potential security issue. The investigation graph in Azure Sentinel allows an SOC analyst to quickly and efficiently investigate and query alerts and entities in an incident, and Azure Sentinel assists by suggesting additional context-aware queries to be run.
Note Azure Security Insights
A fun fact: You might have noticed that when accessing Azure Sentinel in the Azure portal, the URL contains the name “Azure Security Insights.” You’ll also find it referenced in Azure Sentinel Azure AD permissions. This was what Azure Sentinel was called in Microsoft before it was given its official name. Why do I mention this here? Well, Azure Sentinel is always offering insights into security issues and suggesting further things that could be queried in the investigation graph, so this is a great section to bring this fact up!
First, let’s look at the Incidents page in Azure Sentinel that is shown in Figure 3-72.

FIGURE 3-72 Navigating the Incidents page in Azure Sentinel
The Incidents page that lists all the open incidents in Azure Sentinel is self-explanatory and contains details of each open incident such as the title, severity, created time, and the owner of the incident. An incident is a collection of alerts.
Note Securityincidents Table
The SecurityIncidents table contains details of all incidents that have occurred in your Azure Sentinel workspace—open or closed—and is commonly used for reporting SOC performance statistics, such as trends in the number of incidents raised over time, time to triage, and so on. Azure Sentinel only stores the details of incidents for as long as your workspace retention is set to, so remember to align your SecurityIncidents table retention period with your SOC reporting needs.
So we’ve selected our incident that we want to investigate; let’s dig into how we do this:
Navigate to the Azure portal by opening https://portal.azure.com.
In the Search bar, type Sentinel, and under Services, click Azure Sentinel. The Azure Sentinel Workspace page appears.
Select the workspace you want to use. The Azure Sentinel | Overview page appears.
Click Incidents. The Incidents overview page appears.
Select the incident you want to investigate and click View Full Details. The Incident page appears.
Click Investigate. You will be taken to the investigation graph. What you see on this page depends on the incident itself, but the structure of the interface is shown in Figure 3-73.

FIGURE 3-73 The incident investigation graph in Azure Sentinel
Figure 3-74 shows that alerts contained in the incident are denoted by a large circle containing an exclamation point. If you click the circle, a summary of the alert is shown on the left side of the investigation graph.

FIGURE 3-74 Drilling into an alert in the investigation graph
Figure 3-75 shows the entities that are related to the alert in question. They are linked in the investigation graph with lines. If you hover over an entity, Azure Sentinel will suggest further context-aware further queries that an SOC analyst might want to run to understand and investigate the incident further. In Figure 3-75, Azure Sentinel is suggesting that a number of different queries could be run against the account in question; let’s look at the Hosts The Account Failed To Log In To The Most query. If a user account has been compromised, understanding which hosts it has tried and failed to log in to can help an SOC analyst understand what other devices might be compromised and what kind of resources an attacker is looking to access in an organization’s environment.

FIGURE 3-75 Drilling into an alert in the investigation graph
Clicking the suggested query will display the results of that query in the investigation graph, too. Figure 3-76 shows that after running the Hosts The Account Failed To Log In To The Most query, additional entities are added to the investigation graph, and their relationship to the rest of the incident is displayed.
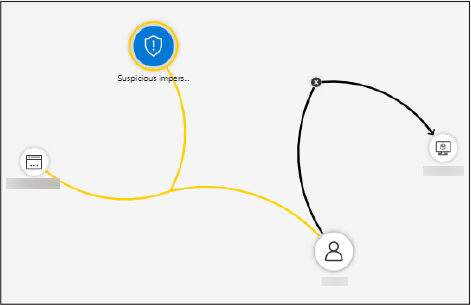
FIGURE 3-76 Additional host entities added to the investigation graph
These additional entities can also be queried further to dig even deeper into what is happening in an incident. This can help an SOC analyst get a full picture of what is happening. Theoretically, this querying of entities could go on ad infinitum, but an SOC analyst usually will need to dig only a few “layers” deep to perform an effective investigation.
Let’s review the additional investigation panels that can also be used for investigation:
Timeline The Timeline panel will order all alerts in date and time order so that an SOC analyst can understand the order in which events in the incident happened (see Figure 3-77).

FIGURE 3-77 The timeline panel in the investigation graph
Info The Info panel provides more in-depth information about the selected alert or entity.
Entities The Entities panel provides a summary of the entities being displayed in the investigation.
Insights The Insights panel (see Figure 3-78) shows other insights about an entity that Azure Sentinel’s built-in UEBA engine thinks is relevant and useful for an SOC analyst to know.
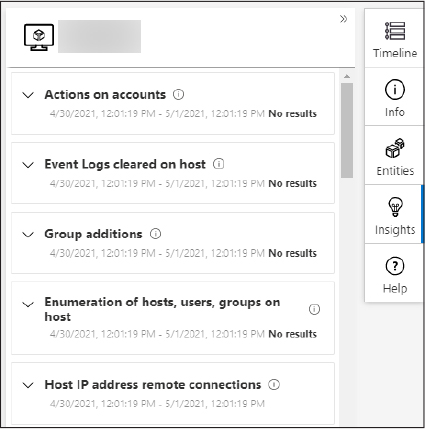
FIGURE 3-78 The insights panel in the investigation graph
Exam Tip
When preparing for the SC-200 exam, spend some time investigating incidents via the investigation graph. Incidents are highly contextual, and it isn’t possible to list or show all the possible insights and queries that Azure Sentinel might suggest.
Triage incidents in Azure Sentinel
Most of us are familiar with the concept of triage from a medical perspective, but how does that work in security operations? This is the dictionary definition of triage:
“The process of examining problems in order to decide which ones are the most serious and must be dealt with first.”
Therefore, it’s easy to see why triaging incidents is a critical activity for an SOC to decide how to prioritize which incidents to work on first.
How can we triage incidents in Azure Sentinel? There are several ways that this can be done, and a real-life SOC analyst would use a combination of these methods to maximize their triage effectiveness. It’s important to remember that triage won’t look the same for every organization: What one organization considers to be a high-severity incident might be another’s medium- or low-severity incident. SOC managers and analysts must work closely with their business stakeholders and technology risk professionals to align severity ratings with their security posture and risk tolerance.
When an incident is raised in Azure Sentinel, it can be triaged in several areas. Following is a chronological look at the lifecycle of an incident:
In an analytics rule As discussed earlier in this chapter, when you configure an analytics rule, you must set the initial severity. This initial severity rating will help an SOC analyst decide how to triage the incident.
In a watchlist If entities in the incident match a watchlist (for example, VIP users), an analytics rule can be configured to make the incident higher or lower severity.
How many alerts are part of the incident As shown earlier in this chapter, it’s possible to configure an analytics rule to collect alerts in a set time period to be collected into one incident. An incident that involves many alerts is likely to be set at a higher priority than one with fewer alerts.
Using TI matching Threat intelligence can be used to check if there are IOC (indicators of compromise) matches with any TI feeds that Azure Sentinel is ingesting. For example, if an IP address is raised in an incident, an analyst could run a Playbook to determine if this was a known-malicious IP and reference a third-party service such as Virus Total. If the IP was found to be a known-malicious IP, then the severity could be increased, and it could be prioritized.
Using enrichment from third-party sources Similar to the previous point, enrichment doesn’t just have to be about TI. Enrichment could be an inventory management system that stores the criticality of an asset. This means an incident raised against a single user desktop might only be classified as being a low-priority incident. However, an incident raised against an e-commerce company’s web servers could be critical to investigate and resolve, and thus, it might be considered to be a high-priority incident. Once again, this could be automated in either a Playbook that is run as the incident is triggered, or it could be a manually run Playbook during the course of an investigation.
Respond to incidents in Azure Sentinel
Now we’ve investigated and triaged an incident, we need to respond to resolve it. Azure Sentinel makes this easy with automation. In this section, we will look at how you can run Playbooks to resolve incidents, so we’re not talking about how we can trigger automation to happen when an incident is raised; instead, we’re talking about the next step.
Let’s work through an example incident:
Navigate to the Azure portal by opening https://portal.azure.com.
In the Search bar, type Sentinel, and under Services, click Azure Sentinel. The Azure Sentinel Workspace page appears.
Select the workspace you want to use. The Azure Sentinel | Overview page appears.
Click Incidents, which opens the Incidents overview page.
Select the incident you want to respond to and click View Full Details.
A list of all alerts that are part of an incident are shown on the Timeline tab (see Figure 3-79).
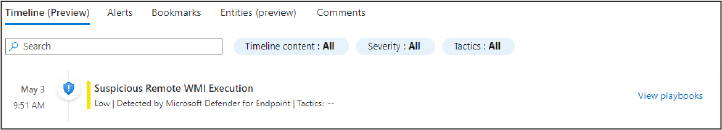
FIGURE 3-79 Viewing alerts on the Timeline tab
Click View Playbooks, and you will be taken to the Alert Playbooks page where all Playbooks that have been configured in the workspace will be listed. By clicking Run, you can trigger one or more Playbooks to run in the context of the selected alert (see Figure 3-80).
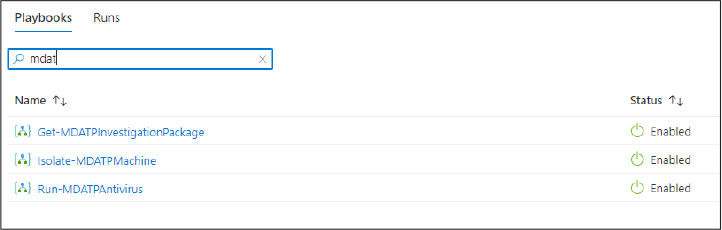
FIGURE 3-80 Selecting a Playbook to run against an alert in an incident
The SOC analyst who has been assigned the incident can then update the case notes as appropriate on the Comments tab of the incident’s page (see Figure 3-81).
FIGURE 3-81 Posting comments on the incident tab
Exam Tip
Remember, for your SC-200 exam, everything rolls up to Azure Sentinel, so this is where you should always be driving incident investigations toward triage and response from Azure Sentinel. If necessary, you might need to drill down into individual Microsoft security service portals.
Investigate multi-workspace incidents
When preparing for the SC-200 exam, it’s important to remember that there are two types of multi-workspace scenarios that you might be asked about in relation to Azure Sentinel:
Cross-tenant scenario Where multiple Azure tenancies each have Azure Sentinel workspaces that need to be centrally managed
Cross-workspace scenario Where there are multiple workspaces in one Azure tenancy that need to be centrally managed
At the beginning of this chapter, we discussed the considerations when designing Azure Sentinel workspaces and why some organizations might require more than one workspace in their deployment. Some customers might also choose to outsource the running of their SOC to a Managed Security Service Provider (MSSP) that will handle security operations on their behalf.
Aside from Azure Lighthouse, there are several Log Analytics and Azure Sentinel features that allow you to investigate incidents across workspaces in the same Azure tenant.
Cross-workspace analytics rules Analytics rules can be configured to search other workspaces when they are correlating logs. To enable this capability, we have to use the workspace and union KQL operators. Using the queries we used in the “Define incident creation logic”section earlier in this chapter, let’s see how we would need to update them to make them cross-workspace. This is the original query:
OfficeActivity
| where OfficeWorkload == "Exchange"
To make convert this to a cross-workspace query, it would become:
union
workspace('<workspaceA>'.OfficeActivity
| union workspace('<workspaceB>').OfficeActivity
| where OfficeWorkload == "Exchange"
Cross-workspace hunting queries Like cross-workspace analytics rules, the workspace and union KQL operators can be used in hunting queries to proactively detect threats and anomalies across multiple workspaces in an environment.
Cross-workspace workbooks The workspace and union KQL operators can also be used to display consolidated statistics and visualisations from different workspaces. This is particularly useful for centralized reporting for an SOC that uses more than one workspace.
Note Cross-Workspace Analytics Rules
There are a few things to be mindful of when using cross-workspace analytics rules. All the workspaces involved in the query must have Azure Sentinel installed. (You can’t do it with just a Log Analytics workspace.) You can search a maximum of 20 workspaces in one rule. The incidents and alerts raised by the cross-workspace analytics rule will only appear in the originating workspace from which the rule is being run.
Identify advanced threats with user and entity behavior analytics (UEBA)
Traditionally, user and entity behavior analytics (UEBA) was not incorporated into a SIEM solution. Instead, you would have to buy a third-party product or add-on to be able to get these insights. Having the power of UEBA built into Azure Sentinel—and have it as part of the same interface—allows SOC analysts to focus on a particular entity as part of their investigation. Also, Azure Sentinel’s UEBA can provide insights about an entity’s anomalous activities and behaviors. These insights are based on that entity’s previous behavior, and those behaviors are with the behavior of its peers (if a user) or similar endpoints (if a host). Figure 3-82 takes a look at the architecture of the UEBA feature.
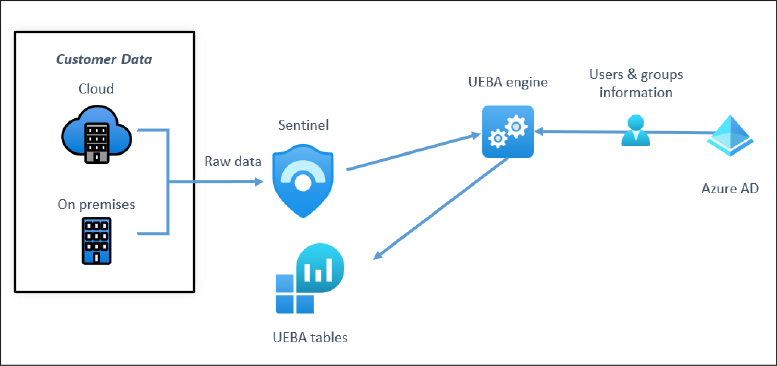
FIGURE 3-82 UEBA architecture overview
As you can see in Figure 3-82, Azure Sentinel’s UEBA engine takes in raw data sources—from both the cloud and on-premises—that has already been ingested into the workspace, and it then takes users and groups information from Azure AD, enriches it all, and then populates the dedicated UEBA tables in Log Analytics. You will find these UEBA tables in your workspace (listed under Azure Sentinel UEBA) after you have enabled this feature.
By default, UEBA is not enabled in Azure Sentinel, so let’s first look at how to enable it:
Navigate to the Azure portal by opening https://portal.azure.com.
In the Search bar, type Sentinel, and under Services, click Azure Sentinel. The Azure Sentinel Workspace page appears.
Select the workspace you want to use. The Azure Sentinel | Overview page appears.
Click Entity Behavior. The Entity Behavior page appears, as shown in Figure 3-83.
Click Configure UEBA.

FIGURE 3-83 The Entity Behavior page in Azure Sentinel
You will be taken to the Entity Behavior Analytics Settings page. Click Configure UEBA one more time, which will open the Entity Behavior Configuration page, as shown in Figure 3-84.
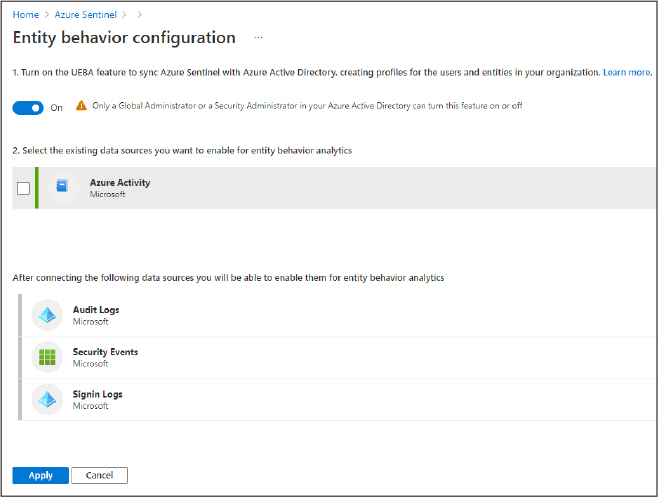
FIGURE 3-84 The Entity Behavior configuration page in Azure Sentinel
Select the data sources that you want to enable for UEBA. You can only enable data sources for UEBA that are already being ingested into your Azure Sentinel workspace.
Click Apply. You have now enabled UEBA for the data sources you selected in your Azure Sentinel workspace.
Note Additional Ingestion Charges
Be mindful that turning on UEBA will generate additional ingestion charges for your Azure Sentinel workspace because new UEBA tables are created, and data is stored in them for the feature to work.
Now let’s explore the entity pages that use the UEBA feature: Return to the Entity Behavior page, as shown in Figure 3-85.

FIGURE 3-85 The Entity Behavior page in Azure Sentinel
Tip Entity Behavior Page Population
In real life, after you have turned on UEBA, it can take an up to an hour for the Entity Behavior page to start being populated.
The top accounts and hosts by number of alerts will be shown. You can click them to be taken to that entity’s page, as shown in Figure 3-86.
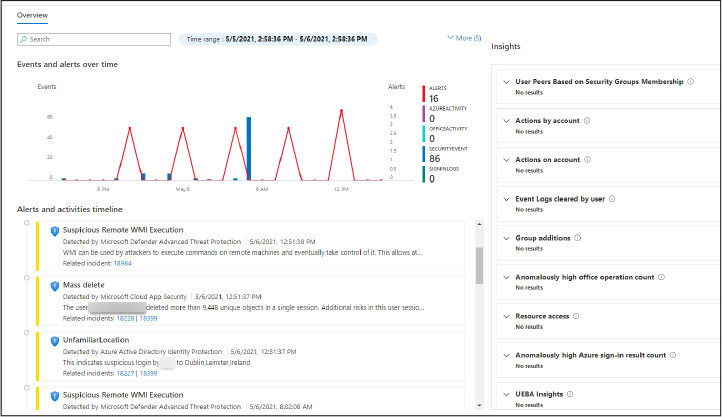
FIGURE 3-86 User entity page in Azure Sentinel UEBA
Both entity and host pages are similar, follow a theme that is familiar to other pages in Azure Sentinel, and have a focus on timeline and insights: The page will show all the alerts related to that entity in a timeline fashion. Insights about that entity are found on the left side of the page. Insights are based on the following data sources:
Syslog (Linux)
SecurityEvent (Windows)
AuditLogs (Azure AD)
SigninLogs (Azure AD)
OfficeActivity (Office 365)
BehaviorAnalytics (Azure Sentinel UEBA)
Heartbeat (Azure Monitor Agent)
CommonSecurityLog (Azure Sentinel)
Entity pages and UEBA functionality are designed to fit into a larger incident investigation and management piece when an SOC is using Azure Sentinel, and they highlight anomalous behaviors and help with triaging.
Exam Tip
For the SC-200 exam, make sure you understand what UEBA is and how it can be used to assist in investigations.
Skill 3-6: Use Azure Sentinel workbooks to analyze and interpret data
If you used Azure Sentinel during its initial public preview phase back in 2019, you might remember that the workbooks page in the user interface was simply called “dashboards.” While workbooks in Azure Sentinel do provide the basis for displaying data and information from the product in various formats that could be used as a dashboard, the reality is that workbooks are much, much more than that. They can be used for guided querying and assisting SOC analysts to focus their attention on the most critical incidents and events in their environments.
This section of the chapter covers the skills necessary to activate and customize Azure Sentinel workbook templates, create custom workbooks from scratch, configure advanced visualizations, analyze data using workbooks, and track incident and SOC metrics using the security operations efficiency workbook according to the SC-200 exam outline.
Activate and customize Azure Sentinel workbook templates
As s you spend more time getting familiar with Azure Sentinel, Microsoft has provided out-of-the-box templates for workbooks that you can add to your workspace and customize them with minimal time spent on overhead. Workbook templates typically exist for any built-in data source for which you can find a connector in the data connectors gallery. Remember, there are workbook templates that aren’t directly related to a single specific data source, so make sure that you look through the workbook template gallery carefully and activate any workbooks that are relevant to your environment.
Note Managing Azure Sentinel Workbooks
Azure Sentinel workbooks use Azure Monitor workbooks as their base, so if you’ve used those workbooks before, you will know how to manage Azure Sentinel workbooks.
Let’s look at how to activate a workbook template in your Azure Sentinel workspace:
Navigate to the Azure portal by opening https://portal.azure.com.
In the Search bar, type Sentinel, and under Services, click Azure Sentinel. The Azure Sentinel Workspace page appears.
Select the workspace you want to use. The Azure Sentinel | Overview page appears.
Click Workbooks. The Workbooks gallery appears, as shown in Figure 3-87.

FIGURE 3-87 Workbooks gallery in Azure Sentinel
Select the workbook you want to activate in your Azure Sentinel workspace, and the preview bar appears on the left side of the screen, as shown in Figure 3-88.
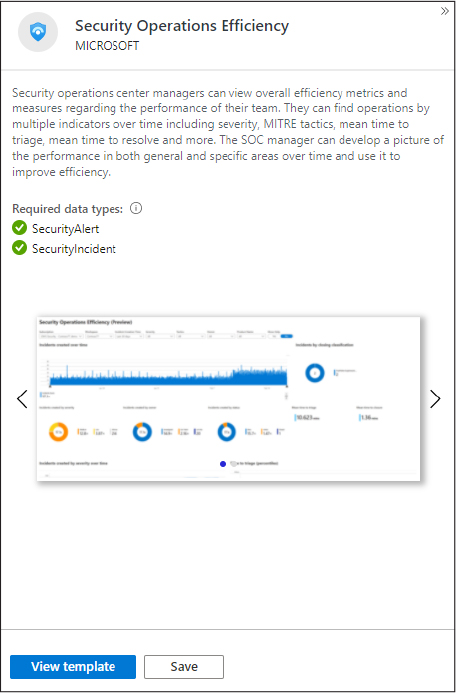
FIGURE 3-88 Workbook template summary
Click View Template. This will show you a preview of the workbook using the data in your workspace.
Note Required Data Types
A workbook template displays Required Data Types and will indicate if the logs required for the workbook to function properly are available in your workspace. Be prepared for a few errors if you activate the template and don’t have all the logs that the workbook uses!
Return to the workbooks gallery, and this time, select the workbook you want to activate and click Save.
You will be prompted select what location you want to save the workbook to, as shown in Figure 3-89.
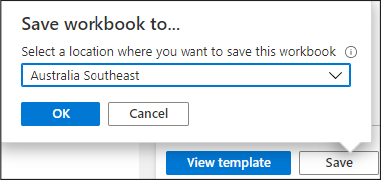
FIGURE 3-89 Saving a workbook in the workbooks gallery
Choose your desired location and click OK.
You will notice that the button options for that workbook have changed, and you now have the View Saved Workbook option, as shown in Figure 3-90.

FIGURE 3-90 A saved workbook in the workbooks gallery
Click View Saved Workbook.
You will be taken to your saved workbook template, which is populated with the data from your workspace, as shown in Figure 3-91.
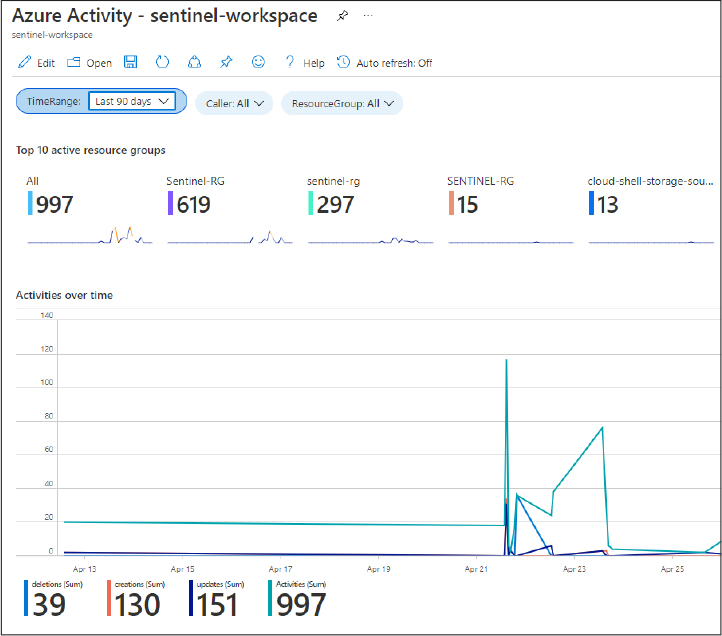
FIGURE 3-91 A saved workbook in Azure Sentinel
If required, you can now use the Edit button and customize this template.
Create custom workbooks
Although workbook templates cover many use cases and eventualities in Azure Sentinel, in a large, complex organization, it is likely that you might need to create a workbook for reporting specific items for your organization from scratch.
Exam Tip
It’s important that you know how to effectively create a useful, custom workbook for your SC-200 exam.
Let’s look at how to create a useful, custom workbook:
Navigate to the Azure portal by opening https://portal.azure.com.
In the Search bar, type Sentinel, and under Services, click Azure Sentinel. The Azure Sentinel Workspace page appears.
Select the workspace you want to use. The Azure Sentinel | Overview page appears.
Click Workbooks. The Workbooks Gallery appears.
Click Add Workbook. The New Workbook page appears, as shown in Figure 3-92.
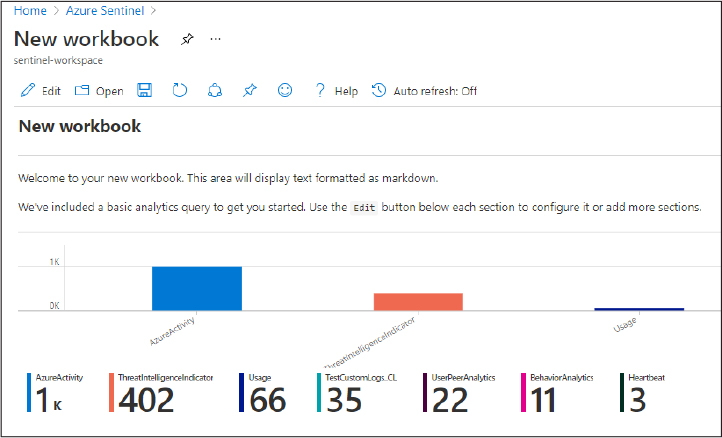
FIGURE 3-92 Opening a new custom workbook
Click Edit, and you will now be able to add items to your custom workbook, as shown in Figure 3-93.

FIGURE 3-93 Adding new items to a custom workbook
Let’s briefly explain the items in the Add column:
Add Text As this self-explanatory option implies, text can be added to your workbook to explain the purpose of the workbook or any additional explanation of the visualizations being shown. Text in workbooks is formatted as markdown.
Add Parameters This is where parameters that can be iterated throughout the workbook are defined as shown in Figure 3-94.
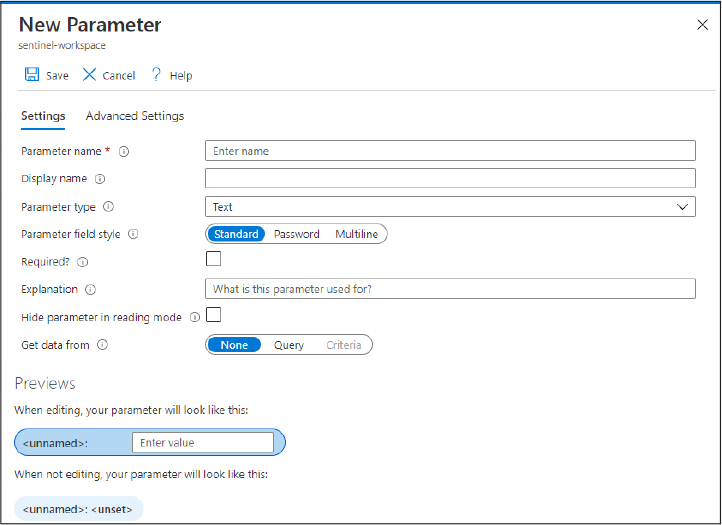
FIGURE 3-94 Adding parameters to a custom workbook
Add Links/Tabs This self-explanatory option allows you to add relevant links and tabs to your workbook.
Add Query Arguably, the most important aspect of customizing workbooks, this is where you can add KQL queries that will bring back data to the workbook to be displayed. If you’ve learned KQL for searching logs and writing analytics rules, you’ll have a good idea what is required here from a query language perspective. There are several different visualizations that you can choose to use, which can be set in the user interface or in the query itself using the render KQL operator shown in Figure 3-95.
Exam TipStudy some of the workbook templates and how they structure their KQL queries to help you understand how to construct KQL queries for visualizations in workbooks.

FIGURE 3-95 Choosing a visualization in a workbook query
Add Group This is where workbook items can be grouped logically to make management of the workbook easier.
When you’ve finished creating your custom workbook, click Save.
Choose where you want to save your custom workbook to, as shown in Figure 3-96.
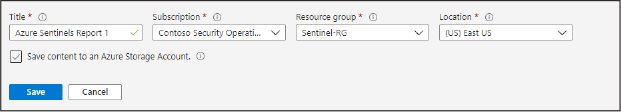
FIGURE 3-96 Saving a custom workbook
Configure advanced visualizations
There are many visualization options to choose from in Azure Sentinel when creating workbooks. Choosing the “correct” visualization for the data being displayed will be—to a large extent—a personal preference for those individuals creating the workbook and the organization’s preferences for how the data is to be displayed.
Having said this, certain query results don’t display well (or at all) in certain types of visualizations. In preparation for your SC-200 exam, make sure you are familiar with what does and doesn’t work in terms of the different visualization options and query results in Azure Sentinel. For example, queries that use the bin operator to summarize query results usually display best with a line or bar chart.
Exam Tip
The Visualizations Demo workbook template found in Azure Sentinel (see Figure 3-97) is a template specifically designed to showcase different types of workbook visualizations. Make sure that you use it to help your SC-200 studies!

FIGURE 3-97 The Visualizations Demo workbook template
Let’s look at some of the visualization options available for you to use in workbooks:
Charts Available chart types include line, bar, pie, and time. You can customize the chart’s height, width, color palette, legend, titles, and so on. Also, you can customize axis types and series colors using the chart settings. Figure 3-98 shows an example pie chart in a workbook:
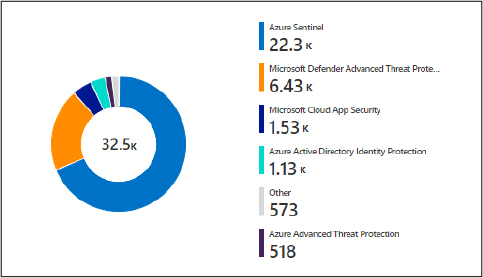
FIGURE 3-98 Pie chart in an Azure Sentinel workbook
Grids Grids display the results of a query not unlike the results seen in the Log Analytics query interface, so using KQL you can choose the columns that appear in the grid. Figure 3-99 shows an example grid in a workbook.
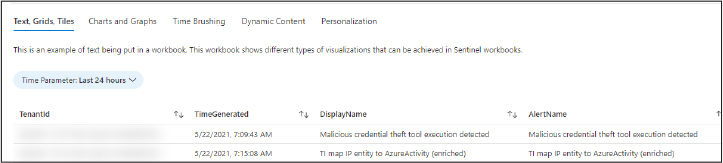
FIGURE 3-99 Example grid in an Azure Sentinel workbook
Tiles Tiles are a method of presenting summarized data in workbooks. Figure 3-100 shows an example of tiles in a workbook:

FIGURE 3-100 Example tile in an Azure Sentinel workbook
Graphs Graphs can show the relationships between entities in the logs they are analyzing. See Figure 3-101 for an example of a graph visualization:

FIGURE 3-101 Example graph in an Azure Sentinel workbook
View and analyze Azure Sentinel data using workbooks
So far in this part of the chapter, we have discussed how you can configure and create workbooks, but next we’ll focus on how to use workbooks in the context of an SOC analyst responding to or investigating incidents. How an SOC uses workbooks is, of course, highly contextual and will depend on the organization’s wider IT operations processes, so this section will look at how workbooks can be used by an SOC in a more general context and explore some of the main analytical concepts.
For this example, we’re going to be using one of the built-in workbook templates, the Azure AD Sign-In Logs workbook:
Navigate to the Azure portal by opening https://portal.azure.com.
In the Search bar, type Sentinel, and under Services, click Azure Sentinel. The Azure Sentinel Workspace page appears.
Select the workspace you want to use. The Azure Sentinel | Overview page appears.
Click Workbooks. The Workbooks gallery appears.
Click the Azure AD Sign-In Logs Workbook.
Click View Saved Workbook. The Sign-in Analysis Workbook appears, as shown in Figure 3-102.

FIGURE 3-102 Azure AD Sign-in Analysis workbook
Let’s look at this workbook from the perspective of an SOC analyst who wants to look for unusual activity in the Azure AD sign-in logs. As we can see in Figure 3-102, the number of sign-ins for each country is shown, as well as the trend for sign-ins from each country for the time range specified. The TimeRange is set to Last 7 Days.
Clicking in the Sign-Ins By Location box allows you to drill-in to more specific locations in the U.S., as shown in Figure 3-103.

FIGURE 3-103 Drilling into sign-in locations detail by country
We can see that both Redmond and Pflugerville are the most recorded locations for sign-ins in this workspace in the past 7 days and that there have been a couple of small spikes in sign-ins from these locations in the past week. (We can observe this by looking at the Trend column.)
Moving further down the workbook, the SOC analyst can analyze the number of successful versus unsuccessful sign-ins, as shown in Figure 3-104.

FIGURE 3-104 Checking the Troubleshooting Sign-Ins section
The workbook also shows the Summary Of Top Errors for the selected time period. Figure 3-104 shows that in this instance, the top sign-in error was Fresh Auth Token Is Needed. Have The User Re-Sign Using Fresh Credentials, followed by Invalid Username Or Password Or Invalid On-Premises Username Or Password. This information can assist an SOC analyst in understanding the baseline of the environment they manage, as well as help them look for anomalies.
The SOC analyst can choose to focus in on a specific user or change the time period that the workbook displays; this can be done via the parameters tabs—TimeRange, Apps, UserNamePrefix, and UserName—at the top of the workbook, as shown in Figure 3-105.
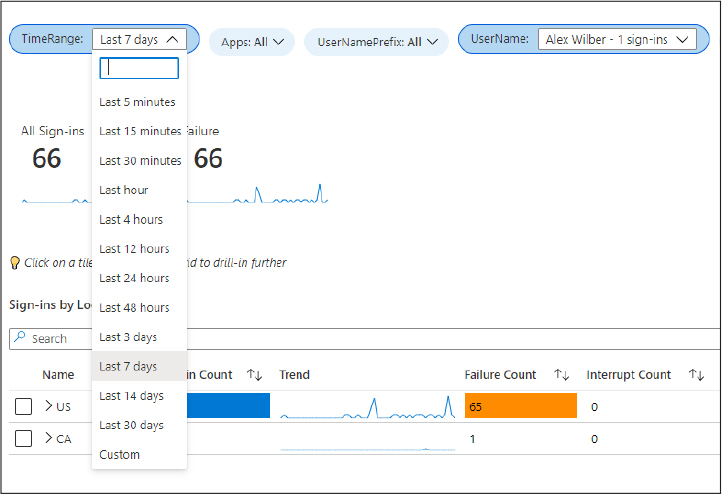
FIGURE 3-105 Changing the parameters of a workbook
Finally, it might be necessary to print a hard or soft copy of the workbook to give to management for reporting purposes. This can be done by clicking the ellipsis (three dots) to the right of the workbook’s title, as shown in Figure 3-106.
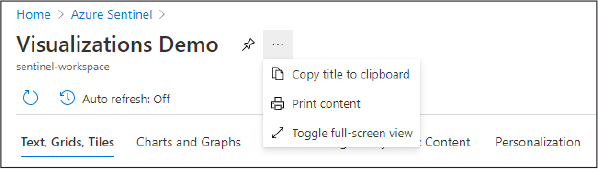
FIGURE 3-106 Printing a workbook in Azure Sentinel
Track incident metrics using the security operations efficiency workbook
Although all the Azure Sentinel workbook templates are very useful—they’ve all been written by experts in their field—they are often tied to a particular data source and will not be useful if you are not ingesting that data source into your Azure Sentinel workspace. However, the Security Operations Efficiency workbook is a workbook that uses the SecurityIncidents table to allow you to track key SOC metrics, such as the number of incidents raised, their severity, mean time to triage, and so on. Regardless of your organization’s security operations processes and the data sources you ingest, you will want to track key performance indicators (KPIs) of your SOC. (And even if you don’t, your management probably will!)
Exam Tip
For the SC-200 exam, it’s important that you’re familiar with the Security Operations Efficiency workbook and the metrics that it can provide for reporting on an SOC’s performance.
Let’s walk through this workbook to learn more about reporting:
Navigate to the Azure portal by opening https://portal.azure.com.
In the Search bar, type Sentinel, and under Services, click Azure Sentinel. The Azure Sentinel Workspace page appears.
Select the workspace you want to use. The Azure Sentinel | Overview page appears.
Click Workbooks. The Workbooks gallery appears.
Click the Security Operations Efficiency workbook. The Security Operations Efficiency workbook appears, as shown in Figure 3-107. Here, you can see various SOC operational metrics for reporting purposes. In Figure 3-107, we can see that there was a large spike in new incidents on about May 2 and that most incidents are being raised as high-severity incidents.

FIGURE 3-107 Security Operations Efficiency workbook
Scrolling further into the workbook, we can see two key SOC operational metrics. Mean Time To Triage and Mean Time To Closure are—along with the number of incidents and severity—very commonly used SOC reporting metrics. (The example in Figure 3-108 shows a very slow SOC team. Mean Time To Triage should be much less than one day in real life. Fortunately, this is not a real SOC!)

FIGURE 3-108 Mean Time To Triage and Mean Time To Closure
Exam Tip
Make sure that you are familiar with the typical metrics that SOC managers use for KPIs and how to display these in a workbook in Azure Sentinel. Most of this should be covered in the security operations efficiency workbook, but you should study the queries behind the workbook so that you understand how to query the SecurityIncidents table to obtain these metrics.
Skill 3-7: Hunt for threats using the Azure Sentinel portal
Hunting is the proactive side of threat detection in security operations. While much focus is put on the reactive side of detection (creating alerts and incidents in response to patterns of behavior being correlated across log sources), as an SOC increases in maturity, it should be moving toward proactive threat hunting and looking for potentially suspicious activity before it triggers a detection rule.
This section of the chapter covers the skills necessary to create custom hunting queries; manually run hunting queries; monitor using Livestream; perform hunting using notebooks; track query results with bookmarks; use those bookmarks in investigations; and convert a hunting query into an analytics rule.
Create custom hunting queries
If you’re reading this chapter from start to finish, you probably already know what this topic is going to start with: Microsoft includes many Sentinel hunting queries that you can use right out of the box that have been written by security experts. Before you take the time and effort to write a custom query, do look through the built-in hunting queries to see if they will meet your requirements. Hunting queries don’t have templates. The out-of-the-box queries exist in your hunting queries list, and you can’t edit them like you are able to with analytics rules and workbooks. If you want to edit an out of the box hunting rule, you will need to re-create the whole rule with your edited KQL query.
Tip Hunting Queries Versus Analytics Rules
If you’re unsure about the differences between a hunting query and an analytics rule, use the out-of-the-box hunting query templates to give you an idea. Typically, hunting queries are looking for a single or limited series of events that might be an indicator of a security issue, but in isolation, they would not necessarily be sufficient to raise an incident immediately.
Let’s look at how to create a custom hunting rule in Azure Sentinel:
Navigate to the Azure portal by opening https://portal.azure.com.
In the Search bar, type Sentinel, and under Services, click Azure Sentinel. The Azure Sentinel Workspace page appears.
Select the workspace you want to use. The Azure Sentinel | Overview page appears.
Click Hunting. The Hunting page appears, as shown in Figure 3-109.

FIGURE 3-109 The Hunting page in Azure Sentinel
Click New Query. The Create Custom Query page appears, as shown in Figure 3-110.

FIGURE 3-110 Create Custom Query
Following is the KQL of the query shown in Figure 3-110:
SecurityEvent
| where ParentProcessName contains "powershell.exe"
On the Create Custom Query page, you can define the Name, Description, Custom Query, Entity Mapping, and MITRE Tactics for your hunting query.
Note Avoid References to Time Ranges
Unlike an analytics rule, hunting query logic should not include any reference to time ranges because this prevents Azure Sentinel from showing you the change in query results over time to create a baseline for monitoring.
Click Create.
You will be returned to the Hunting page, and if you search for your custom hunting query by name, it should now appear in your hunting Queries list, as shown in Figure 3-111.
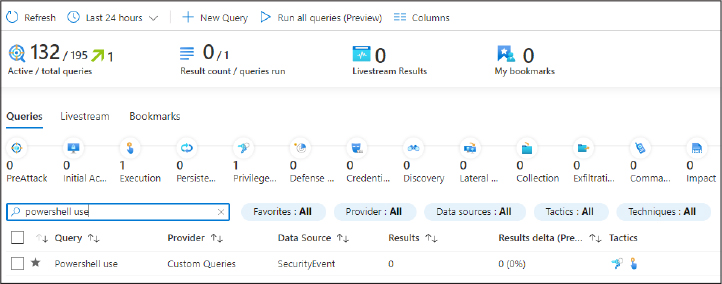
FIGURE 3-111 Searching for a custom hunting query
Run hunting queries manually
Hunting queries will almost always be run manually in Azure Sentinel, which we will explore in this topic:
Navigate to the Azure portal by opening https://portal.azure.com.
In the Search bar, type Sentinel, and under Services, click Azure Sentinel. The Azure Sentinel Workspace page appears.
Select the workspace you want to use. The Azure Sentinel | Overview page appears.
Click Hunting, which opens the Hunting page.
Select the query that you want to run manually. The Hunting Query Preview pane appears, as shown in Figure 3-112.
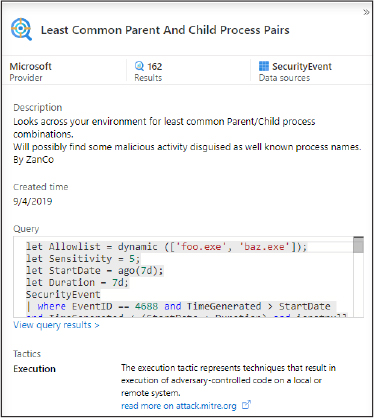
FIGURE 3-112 The Hunting Query Preview pane
Click Run Query. The hunting query will be run, and the Results column will be populated with the number of results that query has returned, as shown in Figure 3-113.
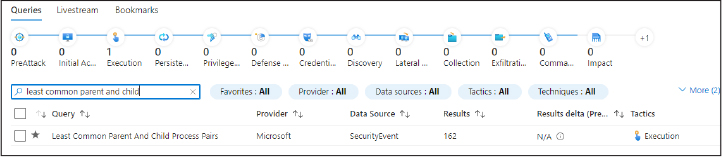
FIGURE 3-113 Checking the number of results a hunting query has returned
To see the hunting query results in more detail, click View Results in the Hunting Query Preview pane, and you will be taken to the Log Analytics page to see the raw results of the query.
To run multiple hunting queries at the same time, select the queries to be run on the Hunting page using the check boxes next to each query, as shown in Figure 3-114.

FIGURE 3-114 Selecting multiple hunting queries to be run
Click Run Selected Queries.
The selected queries will run, and the results will be displayed in the Results column in the same way they are shown when you run a single query.
Monitor hunting queries by using Livestream
Livestream is a way of running hunting queries continuously—every 30 seconds—and it will let you know if there are any new results matching the query. This is a great way to monitor for any baseline changes in your environment that can be indicative of a security issue but without raising any unnecessary false-positive incidents. Livestreams can also be useful for testing new queries, and it is also possible to “promote” a Livestream query to an analytics rule or just straight into an investigation.
Let’s look at how to use a Livestream in Azure Sentinel:
Navigate to the Azure portal by opening https://portal.azure.com.
In the Search bar, type Sentinel, and under Services, click Azure Sentinel. The Azure Sentinel Workspace page appears.
Select the workspace you want to use. The Azure Sentinel | Overview page appears.
Click Hunting, which opens the Hunting page.
Click the Livestream tab, which opens the Livestream tab on the Hunting page, as shown in Figure 3-115.
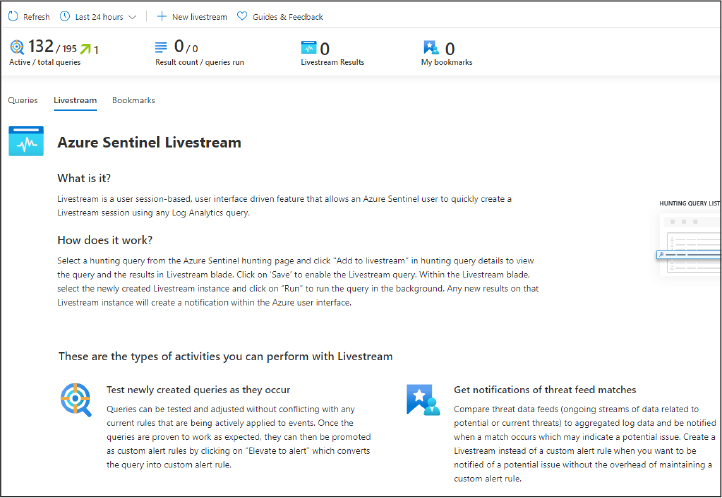
FIGURE 3-115 The Livestream page
The Livestream tab is not prepopulated with queries, so if this is your first time using the feature, it will be empty. To add a Livestream query, click New Livestream.
The Livestream page appears, as shown in Figure 3-116, using this the KQL:
SecurityEvent
| where EventID == 4625

FIGURE 3-116 The Livestream page
Give your Livestream a Name and enter the KQL for the Livestream in the Query field. Remember, as for other hunting queries, you should not specify time periods in Livestream query logic because this prevents Azure Sentinel from detecting changes over time.
Click Save.
Click Play to start the Livestream.
Tip Be Patient!
If you are expecting immediate results with your livestream query, be patient! It can take up to 30 seconds for the Livestream to start and for results to be visible.
The Livestream will start running. Any results from the query will be displayed below on the Livestream page, as shown in Figure 3-117.
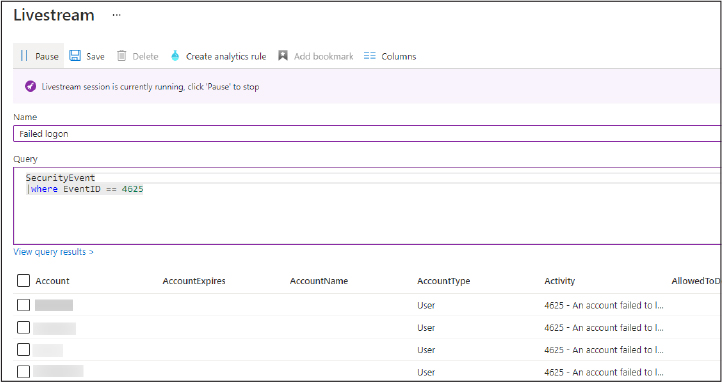
FIGURE 3-117 The Livestream page with query results
The Livestream results will be refreshed every 30 seconds.
You can pause the Livestream using the Pause button at the top of the Livestream page.
Return to the Livestream tab on the Hunting page, as shown in Figure 3-118.
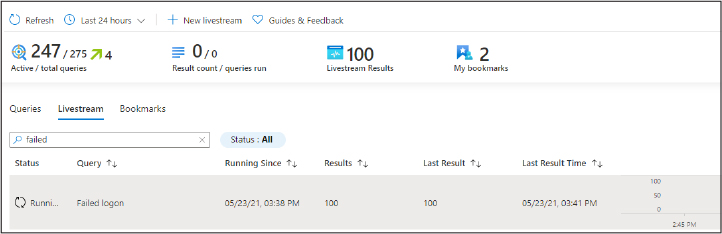
FIGURE 3-118 The Livestream tab with saved Livestreams
The saved Livestream is now visible on the tab, and you can also see whether the Livestream is currently running by looking at the Status column.
You can pause and play livestreams from this page using the Livestream preview pane on the right side of the page, as shown in Figure 3-119.
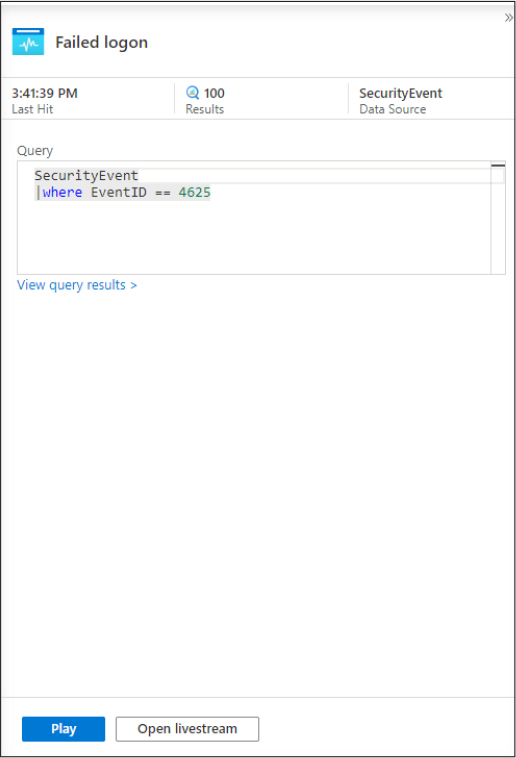
FIGURE 3-119 The Livestream preview pane with the Play button visible
Click Pause or Play in this pane. (This button toggles between Play and Pause.)
Track query results with bookmarks
An SOC analyst might look through hundreds of thousands of logs during a shift, and the human brain can only process and remember a limited number of details. This is where bookmarks come in handy. They are a tool in Azure Sentinel that allows you to save specific records from a query result that an SOC analyst can revisit if they need to. Bookmarks can be attached to incidents to assist with investigation, and as with most things in Azure Sentinel, they also are stored in their own table—the HuntingBookmark table—and they can be searched through using KQL.
Let’s look at how to create a bookmark in Azure Sentinel:
Navigate to the Azure portal by opening https://portal.azure.com.
In the Search bar, type Sentinel, and under Services, click Azure Sentinel. The Azure Sentinel Workspace page appears.
Select the workspace you want to use. The Azure Sentinel | Overview page appears.
Click Hunting, which opens the Hunting page.
Select a hunting query to run. The Hunting Query Preview pane appears on the right side of the screen, as shown in Figure 3-120.
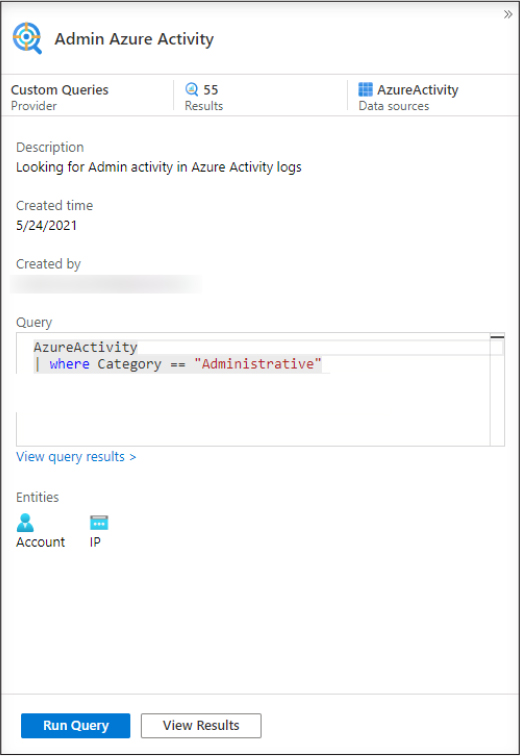
FIGURE 3-120 The Hunting Query Preview pane in Azure Sentinel
Click View Query Results or View Results. (Both take you to the Logs page.)
You will be taken to the Logs page, where you can view the results of the hunting query, as shown in Figure 3-121. The KQL of the query is as follows:
AzureActivity
| where Category == "Administrative"

FIGURE 3-121 Viewing hunting query results on the Logs page
Select the record you want to bookmark by selecting that record and clicking Add Bookmark. The Add Bookmark pane appears, as shown in Figure 3-122.
You can enter details about the record you are saving as a bookmark, including the Name, Entity Mapping, Tags, and Notes to remind yourself or other SOC personnel what is important or noteworthy about this bookmark. When you’ve finished, click Create.
Note Bookmarks in Investigation Graph
To view a bookmark in the investigation graph, you need to map at least one entity in the bookmark.

FIGURE 3-122 The Add Bookmark pane
To view your saved bookmarks, navigate to the Hunting page and click the Bookmarks tab, as shown in Figure 3-123.
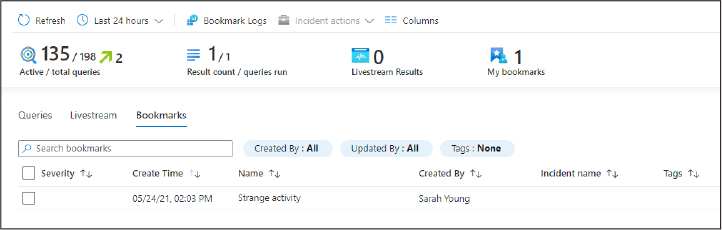
FIGURE 3-123 The Bookmarks tab
You can also view saved bookmarks by navigating to the Bookmark Logs page and searching the
HuntingBookmarktable, as shown in Figure 3-124. The query being run is as follows:HuntingBookmark | take 10
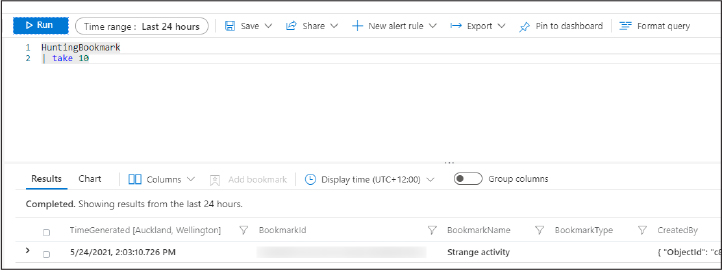
FIGURE 3-124 Searching saved bookmarks in the
HuntingBookmarktable
Use hunting bookmarks for data investigations
Bookmarking certain records can be useful in isolation, but to get the full value of the bookmarks feature in Azure Sentinel, you need to use them to assist in investigations. There are several ways that you can use bookmarks to enhance your threat hunting when using Azure Sentinel.
Adding bookmarks to a new or existing incident
Navigate to the Azure portal by opening https://portal.azure.com.
In the Search bar, type Sentinel, and under Services, click Azure Sentinel. The Azure Sentinel Workspace page appears.
Select the workspace you want to use. The Azure Sentinel | Overview page appears.
Click Hunting. The Hunting page appears.
Click the Bookmarks tab, as shown previously in Figure 3-123.
Select the bookmark and click Incident Actions, as shown in Figure 3-125.
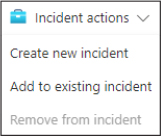
FIGURE 3-125 The Incident Actions button
You can select either:
Create New Incident When this option is selected, the Promoting Bookmark To An Incident pane appears, as shown in Figure 3-126. From here, you can add a Description to the incident, select the Severity of the incident, add tags, and assign to an analyst. Once this information is added, clicking Create creates the incident.

FIGURE 3-126 The Promoting Bookmark To An Incident pane
Add To Existing Incident When this option is chosen, the Promoting Bookmark To An Existing Incident pane appears, as shown in Figure 3-127, where you can select the incident to which you want to attach the bookmark. Click Add when you are ready.
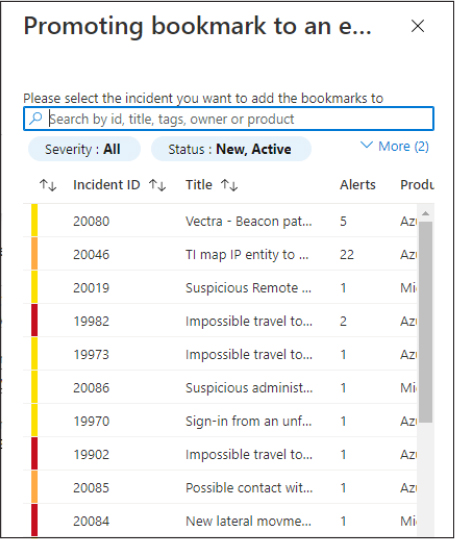
FIGURE 3-127 The Promoting Bookmark To An Existing Incident pane
To check an incident’s attached bookmarks, navigate to the Incidents page in Azure Sentinel.
Select the incident you want to check bookmarks for and click View Full Details. The Incident Overview page appears.
Click the Bookmarks tab, as shown in Figure 3-128, to check the bookmarks attached to the incident.
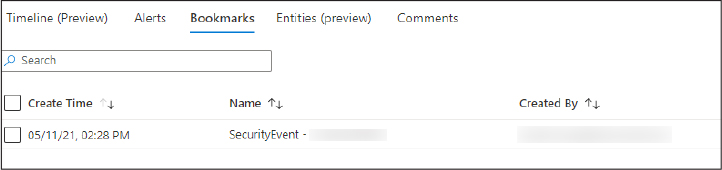
FIGURE 3-128 Checking an incident’s attached bookmarks
Exploring bookmarks in the investigation graph
The investigation graph can be used to explore a bookmark and the entities contained within it.
Navigate to the Azure portal by opening https://portal.azure.com.
In the Search bar, type Sentinel, and under Services, click Azure Sentinel. The Azure Sentinel Workspace page appears.
Select the workspace you want to use. The Azure Sentinel | Overview page appears.
Click Hunting, and the Hunting page appears.
Click the Bookmarks tab, as shown in Figure 3-129.

FIGURE 3-129 The Bookmarks tab
Select the bookmark you want to explore and click Investigate in the Bookmark preview pane. The Investigation graph appears, as shown in Figure 3-130.
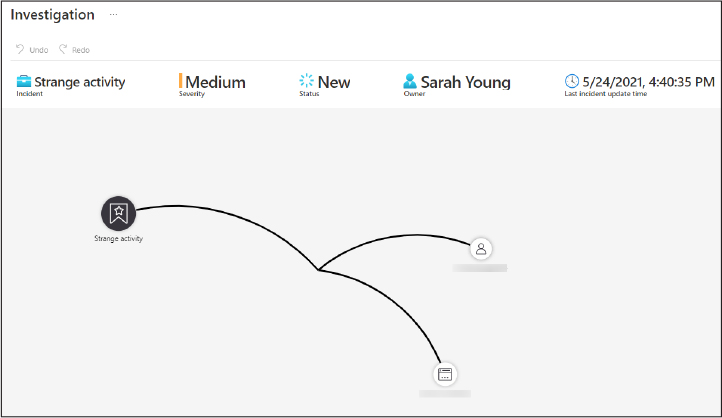
FIGURE 3-130 Investigating a bookmark
You can now use the investigation graph to explore the entities in the bookmark, just as you can use the investigation graph to explore an incident. If you need more information on how to use the investigation graph, refer to Skill 3-5, “Manage Azure Sentinel incidents.”
Convert a hunting query to an analytics rule
We’ve spoken earlier in this section about how hunting is a proactive activity in security operations. But what if—during that proactive hunting activity—an SOC analyst finds an issue that needs to be escalated into an incident? This can be done quickly and easily on the Azure Sentinel hunting page either through a Livestream or direct from a hunting query.
Convert a Livestream to an analytics rule
Navigate to the Azure portal by opening https://portal.azure.com.
In the Search bar, type Sentinel, and under Services, click Azure Sentinel. The Azure Sentinel Workspace page appears.
Select the workspace you want to use. The Azure Sentinel | Overview page appears.
Click Hunting, and the Hunting page appears.
Click the Livestream tab, and the Livestream tab on the Hunting page appears, as shown in Figure 3-131.

FIGURE 3-131 The Livestream tab
Select the Livestream you want to convert to an analytics rule.
Click Open Livestream at the bottom-right side of the page. The Livestream page appears, as shown in Figure 3-132. The KQL of this query is as follows:
SecurityEvent
| where EventID == 4625
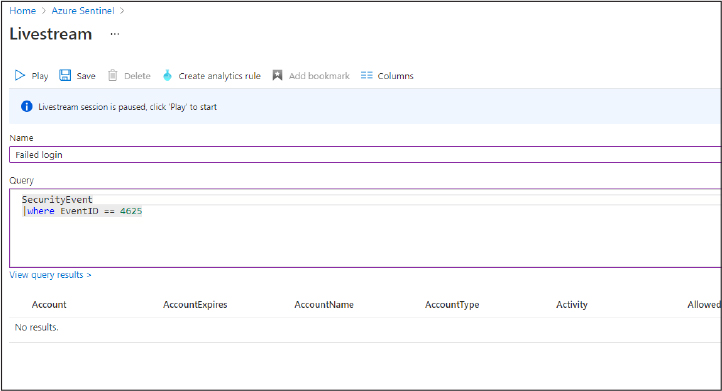
FIGURE 3-132 The Livestream page
Click Create Analytics Rule. The Analytics Rule Wizard appears, as shown in Figure 3-133.

FIGURE 3-133 The Analytics Rule Wizard
You can now fill in the details of the analytics rule as you would for any other rule that you would create in Azure Sentinel.
Note Title and Query Logic
The Livestream title and query logic will be prepopulated in the wizard.
Convert a hunting query to an analytics rule
Navigate to the Azure portal by opening https://portal.azure.com.
In the Search bar, type Sentinel, and under Services, click Azure Sentinel. The Azure Sentinel Workspace page appears.
Select the workspace you want to use. The Azure Sentinel | Overview page appears.
Click Hunting. The Hunting page appears.
Select the hunting query you want to convert to an analytics rule.
Click View Query Results or View Results (both do the same thing) in the Hunting Query Preview pane. You will be taken to the Logs page, as shown in Figure 3-134. The KQL of the query is as follows:
AzureActivity
| where Category == "Administrative"
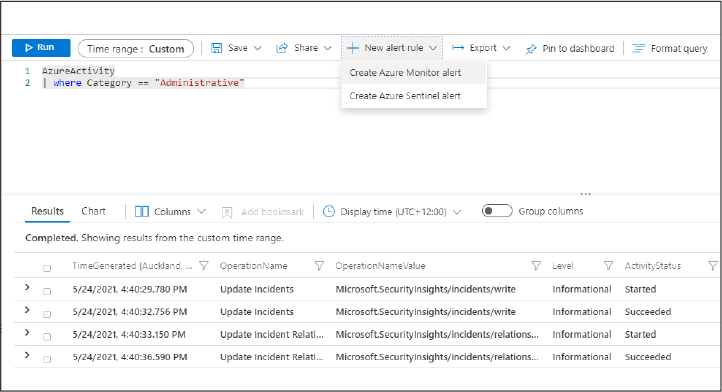
FIGURE 3-134 The Logs page
Click New Alert Rule > Create Azure Sentinel Alert.
The Analytics Rule Wizard appears, as shown in Figure 3-135. The KQL in the query is:
AzureActivity
| where Category == "Administrative"

FIGURE 3-135 The Analytics Rule Wizard
You can now fill in the details of the analytics rule as you would for any other rule that you would create in Azure Sentinel.
Note Hunting Query Logic
The hunting query logic will be prepopulated in the wizard.
Perform advanced hunting with notebooks
The Jupyter Project is an open-source project that was developed to assist data science computing across many programming languages. A Jupyter notebook is an open-source web application that allows you to create and share documents that contain live code, equations, visualizations, and more. Because security operations can essentially be thought of as a security-focused data science—in other words, looking for patterns and anomalies in data—Jupyter notebooks are very well suited to assisting SOC analysts to interpret data.
In Azure Sentinel, Jupyter notebooks run on the Azure Notebooks platform, which is directly connected to the Azure Sentinel user interface. Notebooks allow an SOC analyst to conduct investigations and hunting using a huge collection of programming libraries for machine learning, visualization, and data analysis. Microsoft has developed a library called Kqlmagic that allows you to take queries from Azure Sentinel and run them inside of a notebook. As the library name suggests, queries are still run using the KQL language.
As with the rest of Azure Sentinel, Microsoft have created notebook templates that can be used in production as they are, but they also give you some inspiration to make your own. Let’s go through how to start using notebooks:
Navigate to the Azure portal by opening https://portal.azure.com.
In the Search bar, type Sentinel, and under Services, click Azure Sentinel. The Azure Sentinel Workspace page appears.
Select the workspace you want to use. The Azure Sentinel | Overview page appears.
Click Notebooks, and the Notebooks page appears, as shown in Figure 3-136.

FIGURE 3-136 The Notebooks page
If you haven’t created an Azure Machine Learning Workspace yet, you’ll need to do this by clicking Create New AML Workspace. You will be taken to the Machine Learning page, as shown in Figure 3-137.
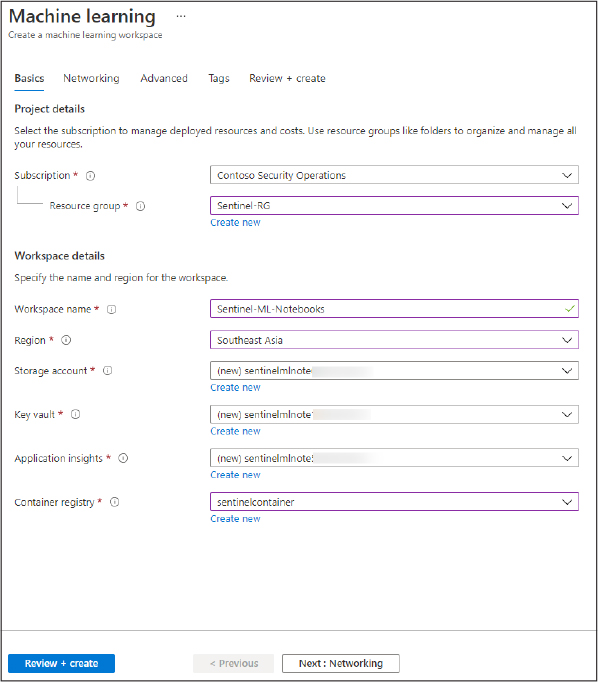
FIGURE 3-137 The Machine Learning page
Complete the details of the deployment, which include Subscription, Resource Group, Workspace Name, Region, and so on. When you’ve finished, click Create.
Return to the Notebooks page in Azure Sentinel, select the notebook that you want to launch, and select Save Notebook.
You will be asked which Azure Machine Learning (AML) workspace you want to save the notebook to, as shown in Figure 3-138.

FIGURE 3-138 Saving a notebook template to an AML workspace
Click OK, and the notebook template will be saved to your AML workspace.
After the notebook has been saved, the Launch Notebook button will appear on the notebook preview pane, as shown in Figure 3-139.

FIGURE 3-139 Launch notebook button appears on the notebook preview pane after the notebook has been saved.
Click Launch Notebook. Your notebook will open in the AML interface, as shown in Figure 3-140.
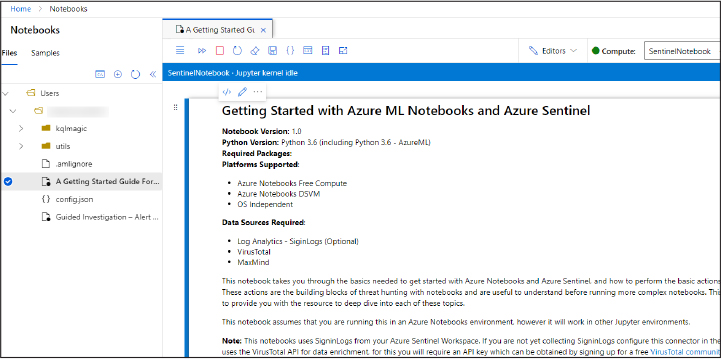
FIGURE 3-140 A notebook opened in the AML interface
If this is the first time you’ve used your AML interface, you’ll also need to configure some compute to power your notebook before you can start running it.
At the top-right of the screen, you will see a + sign that displayes New Compute when you hover your mouse over it. Click the + and you will be taken to the Create Compute Instance page shown in Figure 3-141.
FIGURE 3-141 Creating compute to run a notebook with
Select the VM you want to use for notebook compute, complete the Compute Name details, and click Create.
You can now launch a compute instance to run your notebook by selecting the compute instance and clicking the Start Compute triangle-shaped button, as shown in Figure 3-142.

FIGURE 3-142 Choosing a compute instance to run a notebook with
You can now work through the notebook and execute the code in each cell by clicking the Run Cell button, as shown in Figure 3-143.

FIGURE 3-143 Executing code in a notebook cell
Thought experiment
In this thought experiment, demonstrate your skills and knowledge of the topics covered in this chapter. You can find answers to this thought experiment in the next section.
Security operations at Contoso Ltd.
You are the SOC manager for Contoso Ltd., a large global organization with offices and operations in several jurisdictions. The organization runs a hybrid environment with both on-premises and cloud IT infrastructure that needs to be monitored for any security breaches. Contoso Ltd. uses Azure Sentinel as its SIEM solution.
As a part of your duties for Contoso Ltd., you run a large follow-the-sun SOC across several countries with hundreds of staff: Tier 1 analysts run the initial triage and basic incident resolution; Tier 2 analysts handle incidents escalated to them from Tier 1; and Tier 3 analysts are the most experienced analysts who take on the most complex cases that Tiers 1 and 2 haven’t been able to resolve. Sometimes, this involves the need for Tier 2 analysts to change the configuration of Azure Sentinel.
Looking at your SOC metrics, you can see that both the mean time to triage and mean time to closure of the Contoso SOC is longer than you expected and that SOC analysts aren’t able to respond and close incidents as fast as your upper-management expects them to. Upon speaking to the SOC analysts, they tell you that they don’t get notified when a new incident is raised, and they have to manually check the incidents page to see if new incidents have occurred since they last checked. You want to configure more automation into your SOC processes to notify the SOC analysts when a new incident has been triggered.
With this information in mind, answer the following questions:
1. How can you ensure that Tier 1 and Tier 2 SOC analysts cannot change the data sources that are connected to Azure Sentinel and that only Tier 3 analysts have access to do this?
2. How can you monitor the mean time to triage and mean time in Azure Sentinel?
3. How can you ensure that an alert notification is sent to the SOC team when an incident is triggered?
Thought experiment answers
This section contains the solution to the thought experiment. Each answer explains why the answer choice is correct.
1. You should assign the correct built-in Azure AD roles for Azure Sentinel. In this example, the Tier 1 and Tier 2 SOC analysts who do not need access to change Sentinel settings should be assigned the Azure Sentinel Responder role, where they can manage incidents and review data. Tier 3 analysts should be assigned the Azure Sentinel Contributor role, which allows them to edit settings in Azure Sentinel.
2. Mean time to triage and mean time to closure are calculated in the Security Operations Efficiency workbook in Azure Sentinel. This workbook uses the data found in the SecurityIncidents table to make its calculations.
3. You should configure a Playbook that sends an alert to the SOC team to inform them that a new incident has been raised in Azure Sentinel. This notification could be via email, Teams, and so on. Configure it so that it aligns with the team’s operational processes.
Chapter Summary
Azure Sentinel is both a SIEM and SOAR product.
Azure Sentinel has out-of-the-box templates for almost every configurable part of the product. Make sure that you utilize these first before you create something new from scratch.
Azure Sentinel can support a single workspace, multiple workspaces in one Azure tenancy, and multiple workspaces cross tenancy implementation models.
Data sources are critical for a successful security operations procedure in an organization. Too much data is costly, but too little data can leave blind spots.
Data sources have three main methods of ingestion in Azure Sentinel: built-in connector, CEF/syslog collection, and custom connectors.
Azure Sentinel can support both the ingestion and matching of TI for enrichment of incidents, hunting, and analytics rules.
Analytics rules can be configured as a schedule queries or Microsoft security analytics rules.
KQL is the query language used for all logic definitions in Azure Sentinel.
Azure Logic Apps provides automation capabilities for Azure Sentinel.
Automation has three main uses in Azure Sentinel: alerting, remediation, and enrichment.
Workbooks are the method by which data can be visualized in Azure Sentinel.
Hunting is the proactive side of threat hunting and can be performed with queries, with livestreams, or in notebooks.