We've reached the last piece of the architecture puzzle. We've investigated the database and the set of physical files that constitute a database. In covering the memory used by Oracle, we've looked at one half of an instance. The last remaining architectural issue to cover is the set of processes that constitute the other half of the instance.
Each process in Oracle will perform a particular task or set of tasks, and each will have internal memory (PGA memory) allocated by it to perform its job. An Oracle instance has three broad classes of processes:
Server processes: These perform work based on a client's request. We have already looked at dedicated and shared servers to some degree. These are the server processes.
Background processes: These are the processes that start up with the database and perform various maintenance tasks, such as writing blocks to disk, maintaining the online redo log, cleaning up aborted processes, maintaining Automatic Workload Repository (AWR) and so on.
Slave processes: These are similar to background processes, but they are processes that perform extra work on behalf of either a background or a server process.
Some of these processes, such as the database block writer (DBWn) and the log writer (LGWR), have cropped up already, but here we'll take a closer look at the function of each, and what each does and why.
Note
When I use the term process in this chapter, consider it to be synonymous with the term thread on operating systems where Oracle is implemented with threads (such as Windows). In the context of this chapter, I use the term process to cover both processes and threads. If you are using an implementation of Oracle that is multiprocess, such as you see on UNIX, the term process is totally appropriate. If you are using a single-process implementation of Oracle, such as you see on Windows, the term process will actually mean thread within the Oracle process. So, for example, when I talk about the DBWn process, the equivalent on Windows is the DBWn thread within the Oracle process.
Server processes are those that perform work on behalf of a client session. They are the processes that ultimately receive and act on the SQL statements our applications send to the database.
In Chapter 2, "Architecture Overview," we briefly touched on the two main connection types to Oracle, namely the following:
Dedicated server: There is a dedicated process on the server for your connection. There is a one-to-one mapping between a connection to the database and a server process or thread.
Shared server: Many sessions share a pool of server processes spawned and managed by the Oracle instance. Your connection is to a database dispatcher, not to a dedicated server process created just for your connection.
Note
It is important to understand the difference between a connection and a session in Oracle terminology. A connection is just a physical path between a client process and an Oracle instance (e.g., a network connection between you and the instance). A session, on the other hand, is a logical entity in the database, where a client process can execute SQL and so on. Many independent sessions can be associated with a single connection, and these sessions can even exist independently of a connection. We will discuss this further shortly.
Both dedicated and shared server processes have the same job: they process all of the SQL you give to them. When you submit a SELECT * FROM EMP query to the database, an Oracle dedicated/shared server process parses the query and places it into the shared pool (or finds it in the shared pool already, hopefully). This process comes up with the query plan, if necessary, and executes the query plan, perhaps finding the necessary data in the buffer cache or reading the data from disk into the buffer cache.
These server processes are the workhorse processes. Often, you will find these processes to be the highest consumers of CPU time on your system, as they are the ones that do your sorting, your summing, your joining—pretty much everything.
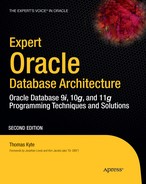
In dedicated server mode, there will be a one-to-one mapping between a client connection and a server process (or thread, as the case may be). If you have 100 dedicated server connections on a UNIX machine, there will be 100 processes executing on their behalf. Graphically, it looks as shown in Figure 5-1.
Your client application will have Oracle libraries linked into it. These libraries provide the APIs you need in order to talk to the database. These APIs know how to submit a query to the database and process the cursor that is returned. They know how to bundle your requests into network calls that the dedicated server will know how to unbundle. This piece of software is called Oracle Net, although in prior releases you might have known it as SQL*Net or Net8. This is the networking software/protocol that Oracle employs to allow for client/server processing (even in an n-tier architecture, there is a client/server program lurking). Oracle employs this same architecture even if Oracle Net is not technically involved in the picture. That is, even when the client and server are on the same machine this two-process (also known as two-task) architecture is still employed. This architecture provides two benefits:
Remote execution: It is very natural for the client application to be executing on a machine other than the database itself.
Address space isolation: The server process has read-write access to the SGA. An errant pointer in a client process could easily corrupt data structures in the SGA if the client process and server process were physically linked together.
In Chapter 2, "Architecture Overview," we saw how these dedicated servers are spawned or created by the Oracle listener process. I won't cover that process again; rather, we'll quickly look at what happens when the listener isn't involved. The mechanism is much the same as it was with the listener, but instead of the listener creating the dedicated server via a fork()/exec() in UNIX or an interprocess communication (IPC) call in Windows, the client process itself creates it.
Note
There are many variants of the fork() and exec() calls, such as vfork() and execve(). The call used by Oracle may vary by operating system and implementation, but the net effect is the same. fork() creates a new process that is a clone of the parent process; on UNIX, this is the only way to create a new process. exec() loads a new program image over the existing program image in memory, thus starting a new program. So, SQL*Plus can fork (copy itself) and then exec the Oracle binary, the dedicated server, overlaying the copy of itself with this new program.
We can see this parent/child process creation clearly on UNIX when we run the client and server on the same machine:
$ sqlplus /

SQL*Plus: Release 11.2.0.1.0 Production on Sun Jan 24 07:28:13 2010

Copyright (c) 1982, 2009, Oracle.  All rights reserved.


Connected to:
Oracle Database 11g Enterprise Edition Release 11.2.0.1.0 - Production
With the Partitioning, OLAP, Data Mining and Real Application Testing options

ops$tkyte%ORA11GR2> select a.spid dedicated_server,
  2             b.process clientpid
  3    from v$process a, v$session b
  4   where a.addr = b.paddr
  5     and b.sid = (select sid from v$mystat where rownum=1)
  6  /

DEDICATED_SERVER         CLIENTPID
------------------------ ------------------------
19168                    19167

ops$tkyte%ORA11GR2>
ops$tkyte%ORA11GR2> !/bin/ps -fp 19168 19167
UID        PID  PPID  C STIME TTY      STAT   TIME CMD
tkyte    19167 19166  0 07:30 pts/2    Ss+    0:00 /home/ora11gr2/app/.../bin/sqlplus
ora11gr2 19168 19167  0 07:30 ?        Ss     0:00 oracleorcl (DESCRIPTION=(LOCAL=...
Here, I used a query to discover the process ID (PID) associated with my dedicated server (the SPID from V$PROCESS is the operating system PID of the process that was being used during the execution of that query). The output of /bin/ps -fp includes the parent process id (PPID) and shows the dedicated server process, 19168, is the child of my SQL*Plus process: process id 19167.
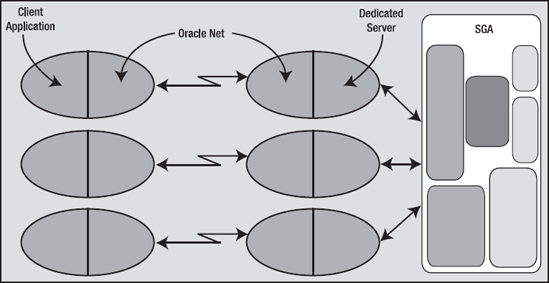
Let's now take a look at the shared server process in more detail. This type of connection mandates the use of Oracle Net even if the client and server are on the same machine—you cannot use shared server without using the Oracle TNS listener. As described earlier, the client application will connect to the Oracle TNS listener and will be redirected or handed off to a dispatcher. The dispatcher acts as the conduit between the client application and the shared server process. Figure 5-2 is a diagram of the architecture of a shared server connection to the database.
Here, we can see that the client applications, with the Oracle libraries linked in, will be physically connected to a dispatcher process. We may have many dispatchers configured for any given instance, but it is not uncommon to have just one dispatcher for many hundreds—even thousands—of users. The dispatcher is simply responsible for receiving inbound requests from the client applications and putting them into a request queue in the SGA. The first available shared server process from the pool of pre-created shared server processes will pick up the request from the queue and attach the UGA of the associated session (the boxes labeled "S" in Figure 5-2). The shared server will process that request and place any output from it into the response queue. The dispatcher constantly monitors the response queue for results and transmits them back to the client application. As far as the client is concerned, it can't really tell if it is connected via a dedicated server or a shared connection—they appear to be the same. Only at the database level is the difference apparent.
Database Resident Connection Pooling (DRCP) is an optional, new method of connecting to the database and establishing a session. It is designed as a more efficient method of connection pooling for application interfaces that do not support efficient connection pooling natively-such as PHP, a general purpose web scripting language. DRCP is a mixture of dedicated server and shared server concepts. It inherits from shared server the concept of server process pooling, only the processes being pooled will be dedicated servers not shared servers; it inherits from the dedicated server the concept of-well-being dedicated.
In a shared server connection, the shared server process is shared among many sessions and a single session will tend to use many shared servers. With DRCP, this is not true; the dedicated server process that is selected from the pool will become dedicated to the client process for the life of its session. In shared server, if I execute three statements against the database in my session, there is a good chance that the three statements will be executed by three different shared server processes. Using DRCP, those same three statements would be executed by the dedicated server assigned to me from the pool-that dedicated server would be mine until my session releases it back to the pool. So DRCP has the pooling capabilities of shared server and the performance characteristics of dedicated server. We'll explore performance of dedicated versus shared server more below.)
It surprises many people to discover that a connection is not synonymous with a session. In most people's eyes they are the same, but the reality is they do not have to be. A connection may have zero, one, or more sessions established on it. Each session is separate and independent, even though they all share the same physical connection to the database. A commit in one session does not affect any other session on that connection. In fact, each session using that connection could use different user identities!
In Oracle, a connection is simply a physical circuit between your client process and the database instance—a network connection, most commonly. The connection may be to a dedicated server process or to a dispatcher. As previously stated, a connection may have zero or more sessions, meaning that a connection may exist with no corresponding sessions. Additionally, a session may or may not have a connection. Using advanced Oracle Net features such as connection pooling, a physical connection may be dropped by a client, leaving the session intact (but idle). When the client wants to perform some operation in that session, it would reestablish the physical connection. Let's define these terms in more detail:
Connection: A connection is a physical path from a client to an Oracle instance. A connection is established either over a network or over an IPC mechanism. A connection is typically between a client process and either a dedicated server or a dispatcher. However, using Oracle's Connection Manager (CMAN), a connection may be between a client and CMAN, and CMAN and the database. Coverage of CMAN is beyond the scope of this book, but Oracle Net Services Administrator's Guide (freely available from
http://otn.oracle.com) covers it in some detail.Session: A session is a logical entity that exists in the instance. It is your session state, or a collection of data structures in memory that represents your unique session. It is what would come first to most people's minds when thinking of a database connection. It is your session on the server, where you execute SQL, commit transactions, and run stored procedures.
We can use SQL*Plus to see connections and sessions in action, and also to recognize that it could be a very common thing indeed for a connection to have more than one session. We'll simply use the AUTOTRACE command and discover that we have two sessions! Over a single connection, using a single process, we'll establish two sessions. Here is the first:
ops$tkyte%ORA11GR2> select username, sid, serial#, server, paddr, status
  2    from v$session
  3   where username = USER
  4  /

USERNAME         SID    SERIAL# SERVER    PADDR    STATUS
--------- ---------- ---------- --------- -------- --------
OPS$TKYTE         49        225 DEDICATED 32BC2B84 ACTIVE
Now, that shows right now that we have one session: a single dedicated server-connected session. The PADDR column is the address of our sole dedicated server process. Next, we turn on AUTOTRACE to see the statistics of statements we execute in SQL*Plus:
ops$tkyte%ORA11GR2> set autotrace on statistics
ops$tkyte%ORA11GR2> select username, sid, serial#, server, paddr, status
  2    from v$session
  3   where username = USER
  4  /

USERNAME         SID    SERIAL# SERVER    PADDR    STATUS
--------- ---------- ---------- --------- -------- --------
OPS$TKYTE         30       5476 DEDICATED 32BC2B84 INACTIVE
OPS$TKYTE         49        225 DEDICATED 32BC2B84 ACTIVE


Statistics
----------------------------------------------------------
          0  recursive calls
          0  db block gets
          0  consistent gets
          0  physical reads
          0  redo size
        831  bytes sent via SQL*Net to client
        419  bytes received via SQL*Net from client
          2  SQL*Net roundtrips to/from client
          0  sorts (memory)
          0  sorts (disk)
          2  rows processed

ops$tkyte%ORA11GR2> set autotrace off
In doing so, we now have two sessions, but both are using the same single dedicated server process, as evidenced by them both having the same PADDR value. We can confirm in the operating system that no new processes were created and that we are using a single process—a single connection—for both sessions. Note that one of the sessions (the original session) is ACTIVE. That makes sense: it is running the query to show this information, so of course it is active. But that INACTIVE session—what is that one for? That is the AUTOTRACE session. Its job is to watch our real session and report on what it does.
When we enable AUTOTRACE in SQL*Plus, SQL*Plus will perform the following actions when we execute DML operations (INSERT, UPDATE, DELETE, SELECT, and MERGE):
It will create a new session using the current connection, if the secondary session does not already exist.
It will ask this new session to query the
V$SESSTATview to remember the initial statistics values for the session in which we will run the DML. This is very similar to the function thewatch_stat.sqlscript performed for us in Chapter 4, "Memory Structures."It will run the DML operation in the original session.
Upon completion of that DML statement, SQL*Plus will request the other session to query
V$SESSTATagain and produce the report displayed previously showing the difference in the statistics for the session that executed the DML.
If you turn off AUTOTRACE, SQL*Plus will terminate this additional session and you will no longer see it in V$SESSION. Why does SQL*Plus do this trick? The answer is fairly straightforward. SQL*Plus does it for the same reason that we used a second SQL*Plus session in Chapter 4, "Memory Structures," to monitor memory and temporary space usage: if we had used a single session to monitor memory usage, we would have been using memory to do the monitoring. By observing the statistics in a single session, we necessarily would change those statistics. If SQL*Plus used a single session to report on the number of I/Os performed, how many bytes were transferred over the network, and how many sorts happened, then the queries used to find these details would be adding to the statistics themselves. They could be sorting, performing I/O, transferring data over the network (one would assume they would!), and so on. Hence, we need to use another session to measure correctly.
So far, we've seen a connection with one or two sessions. Now we'd like to use SQL*Plus to see a connection with no session. That one is pretty easy. In the same SQL*Plus window used in the previous example, simply type the misleadingly named command, DISCONNECT:
ops$tkyte%ORA11GR2> disconnect
Disconnected from Oracle Database 11g Enterprise Edition Release 11.2.0.1.0 - Production
With the Partitioning, OLAP, Data Mining and Real Application Testing options
Technically, that command should be called DESTROY_ALL_SESSIONS instead of DISCONNECT, since we haven't really disconnected physically.
Note
The true disconnect in SQL*Plus is "exit," as you would have to exit to completely destroy the connection.
We have, however, closed all of our sessions. If we open another session using some other user account and query (replacing OPS$TKYTE with your account name, of course):
$ sqlplus / as sysdba
SQL*Plus: Release 11.2.0.1.0 Production on Wed May 12 14:08:16 2010
Connected to:
Oracle Database 11g Enterprise Edition Release 11.2.0.1.0 - Production
With the Partitioning, OLAP, Data Mining and Real Application Testing options

sys%ORA11GR2> select * from v$session where username = 'OPS$TKYTE';
no rows selected
We can see that we have no sessions—but we still have a process, a physical connection (using the previous ADDR value):
sys%ORA11GR2> select username, program
  2    from v$process
  3  where addr = hextoraw( '32BC2B84' );

USERNAME        PROGRAM
--------------- ------------------------------------------------
tkyte           [email protected] (TNS V1-V3)
So, here we have a connection with no sessions associated with it. We can use the also misnamed SQL*Plus CONNECT command to create a new session in this existing process (the CONNECT command might be better named CREATE_SESSION). Using the SQL*Plus instance we disconnected in, we'll execute the following:
ops$tkyte%ORA11GR2> connect /
Connected.
ops$tkyte%ORA11GR2> select username, sid, serial#, server, paddr, status
  2  from v$session
  3  where username = USER;

USERNAME         SID    SERIAL# SERVER    PADDR    STATUS
--------- ---------- ---------- --------- -------- --------
OPS$TKYTE         37        404 DEDICATED 32BC2B84 ACTIVE
Notice that we have the same PADDR as before, so we are using the same physical connection, but we have (potentially) a different SID. I say potentially because we could get assigned the same SID—it just depends on whether other people logged in while we were logged out and whether the original SID we had was available.
Note
On Windows or other thread-based operating systems, you might see different results-the process address may change since you are connected to a threaded process, not just a single purpose process as you would on Unix.
So far, these tests were performed using a dedicated server connection, so the PADDR was the process address of our dedicated server process. What happens if we use a shared server?
Note
To connect via shared server, your database instance would have to have been started with the necessary setup. Coverage of how to configure a shared server is beyond the scope of this book but is covered in detail in the Oracle Net Services Administrator's Guide.
Let's log in using shared server and in that session query:
ops$tkyte%ORA11GR2> select a.username, a.sid, a.serial#, a.server,
  2         a.paddr, a.status, b.program
  3    from v$session a left join v$process b
  4      on (a.paddr = b.addr)
  5   where a.username = 'OPS$TKYTE'
  6  /

USERNAME  SID SERIAL# SERVER    PADDR    STATUS   PROGRAM
--------- --- ------- --------- -------- -------- -----------------------------------
OPS$TKYTE  49     239 SHARED    32BC20AC ACTIVE   [email protected] (S000)
Our shared server connection is associated with a process—the PADDR is there and we can join to V$PROCESS to pick up the name of this process. In this case, we see it is a shared server, as identified by the text S000.
However, if we use another SQL*Plus window to query this same bit of information, while leaving our shared server session idle, we see something like this:
sys%ORA11GR2> select a.username, a.sid, a.serial#, a.server,
  2         a.paddr, a.status, b.program
  3    from v$session a left join v$process b
  4      on (a.paddr = b.addr)
  5   where a.username = 'OPS$TKYTE'
  6  /

USERNAME   SID SERIAL# SERVER    PADDR    STATUS   PROGRAM
--------- ---- ------- --------- -------- -------- ------------------------------------
OPS$TKYTE   49     239 NONE      32BC15D4 INACTIVE [email protected] (D000)
Notice that our PADDR is different and the name of the process we are associated with has also changed. Our idle shared server connection is now associated with a dispatcher, D000. Hence we have yet another method for observing multiple sessions pointing to a single process. A dispatcher could have hundreds, or even thousands, of sessions pointing to it.
An interesting attribute of shared server connections is that the shared server process we use can change from call to call. If I were the only one using this system (as I am for these tests), running that query over and over as OPS$TKYTE would tend to produce the same PADDR of 32BC20AC over and over. However, if I were to open up more shared server connections and start to use those shared server connections in other sessions, then I might notice that the shared server I use varies.
Consider this example. I'll query my current session information, showing the shared server I'm using. Then in another shared server session, I'll perform a long-running operation (i.e., I'll monopolize that shared server). When I ask the database what shared server I'm using again, I'll (in my current session) most likely see a different one (if the original one is off servicing the other session). In the following example, the code in bold represents a second SQL*Plus session that was connected via shared server:
ops$tkyte%ORA11GR2> select a.username, a.sid, a.serial#, a.server,
  2         a.paddr, a.status, b.program
  3    from v$session a left join v$process b
  4      on (a.paddr = b.addr)
  5   where a.username = 'OPS$TKYTE'
  6  /
USERNAME SID SERIAL# SERVER PADDR STATUS PROGRAM --------- ---- ------- --------- -------- -------- ----------------------------------- OPS$TKYTE 49 241 SHARED 32BC20AC ACTIVE [email protected] (S000)scott%ORA11GR2> connect scott/tiger@orcl_ssConnected.scott%ORA11GR2> exec dbms_lock.sleep(20);PL/SQL procedure successfully completed.ops$tkyte%ORA11GR2> select a.username, a.sid, a.serial#, a.server, 2 a.paddr, a.status, b.program 3 from v$session a left join v$process b 4 on (a.paddr = b.addr) 5 where a.username = 'OPS$TKYTE' 6 / USERNAME SID SERIAL# SERVER PADDR STATUS PROGRAM --------- ---- ------- --------- -------- -------- ----------------------------------- OPS$TKYTE 49 241 SHARED 32BC8D1C ACTIVE [email protected] (S001)
Note
You need to use an account that has execute privileges on the DBMS_LOCK package. I granted my demo account SCOTT execute privileges on the DBMS_LOCK package to accomplish this: sys%ORA11GR2> grant execute on dbms_lock to scott;
Notice that the first time I queried, I was using S000 as the shared server. Then, in another session, I executed a long-running statement that monopolized the shared server, which just happened to be S000 this time. The first non-busy shared server is the one that gets assigned to do the work, and in this case no one else was asking to use the S000 shared server, so the DBMS_LOCK command took it. When I queried again in the first SQL*Plus session, I got assigned to another shared server process, S001, since the S000 shared server was busy.
It is interesting to note that the parse of a query (returns no rows yet) could be processed by shared server S000, the fetch of the first row by S001, the fetch of the second row by S002, and the closing of the cursor by S003. That is, an individual statement might be processed bit by bit by many shared servers.
So, what we have seen in this section is that a connection—a physical pathway from a client to a database instance—may have zero, one, or more sessions established on it. We have seen one use case of that when using SQL*Plus's AUTOTRACE facility. Many other tools employ this ability as well. For example, Oracle Forms uses multiple sessions on a single connection to implement its debugging facilities. The n-tier proxy authentication feature of Oracle, used to provide end-to-end identification of users from the browser to the database, makes heavy use of the concept of a single connection with multiple sessions, but each session would use a potentially different user account. We have seen that sessions can use many processes over time, especially in a shared server environment. Also, if we are using connection pooling with Oracle Net, then our session might not be associated with any process at all; the client would drop the connection after an idle time and reestablish it transparently upon detecting activity.
In short, there is a many-to-many relationship between connections and sessions. However, the most common case, the one most of us see day to day, is a one-to-one relationship between a dedicated server and a single session.
Before we examine the rest of the processes, let's discuss why there are three main connection modes and when one might be more appropriate than the other.
As noted previously, in dedicated server mode there is a one-to-one mapping between client connection and server process. This is by far the most common method of connection to the Oracle database for all SQL-based applications. It is the simplest to set up and provides the easiest way to establish connections. It requires little to no configuration.
Since there is a one-to-one mapping, you do not have to be concerned that a long-running transaction will block other transactions. Those other transactions will simply proceed via their own dedicated processes. Therefore, it is the only mode you should consider using in a non-OLTP environment where you may have long-running transactions. Dedicated server is the recommended configuration for Oracle, and it scales rather nicely. As long as your server has sufficient hardware (CPU and RAM) to service the number of dedicated server processes your system needs, dedicated server may be used for thousands of concurrent connections.
Certain operations must be done in a dedicated server mode, such as database startup and shutdown, so every database will have either both or just a dedicated server set up.
Shared server setup and configuration, while not difficult, involves an extra step beyond dedicated server setup. The main difference between the two is not, however, in their setup; it is in their mode of operation. With dedicated server, there is a one-to-one mapping between client connections and server processes. With shared server, there is a many-to-one relationship: many clients to a shared server.
As its name implies, shared server is a shared resource, whereas a dedicated server is not. When using a shared resource, you must be careful to not monopolize it for long periods of time. As you saw previously, use of a simple DBMS_LOCK.SLEEP(20) in one session would monopolize a shared server process for 20 seconds. Monopolization of these shared server resources can lead to a system that appears to hang.
Figure 5-2 depicts two shared servers. If I have three clients and all of them attempt to run a 45-second process more or less at the same time, two of them will get their response in 45 seconds and the third will get its response in 90 seconds. This is rule number one for shared server: make sure your transactions are short in duration. They can be frequent, but they should be short (as characterized by OLTP systems). If they are not short, you will get what appears to be a total system slowdown due to shared resources being monopolized by a few processes. In extreme cases, if all of the shared servers are busy, the system will appear to hang for all users except the lucky few who are monopolizing the shared servers.
Another interesting situation that you may observe when using shared server is that of an artificial deadlock. With shared server, a number of server processes are being shared by a potentially large community of users. Consider a situation where you have five shared servers and one hundred user sessions established. At most, five of those user sessions can be active at any point in time. Suppose one of these user sessions updates a row and does not commit. While that user sits there and ponders his or her modification, five other user sessions try to lock that same row. They will, of course, become blocked and will patiently wait for that row to become available. Now the user session that holds the lock on this row attempts to commit its transaction (hence releasing the lock on the row). That user session will find that all of the shared servers are being monopolized by the five waiting sessions. We have an artificial deadlock situation here: the holder of the lock will never get a shared server to permit the commit, unless one of the waiting sessions gives up its shared server. But, unless the waiting sessions are waiting for the lock with a timeout, they will never give up their shared server (you could, of course, have an administrator kill their session via a dedicated server to release this logjam).
For these reasons, shared server is only appropriate for an OLTP system characterized by short, frequent transactions. In an OLTP system, transactions are executed in milliseconds; nothing ever takes more than a fraction of a second. Shared server is highly inappropriate for a data warehouse. Here, you might execute a query that takes one, two, five, or more minutes. Under shared server, this would be deadly. If you have a system that is 90 percent OLTP and 10 percent "not quite OLTP," then you can mix and match dedicated servers and shared server on the same instance. In this fashion, you can reduce the number of server processes on the machine dramatically for the OLTP users, and make it so that the "not quite OLTP" users do not monopolize their shared servers. In addition, the DBA can use the built-in Resource Manager to further control resource utilization.
Of course, a big reason to use shared server is when you have no choice. Many advanced connection features require the use of shared server. If you want to use Oracle Net connection pooling, you must use shared server. If you want to use database link concentration between databases, then you must use shared server for those connections.
Note
If you are already using a connection pooling feature in your application (e.g., you are using the J2EE connection pool), and you have sized your connection pool appropriately, using shared server will only be a performance inhibitor. You already sized your connection pool to cater for the number of concurrent connections that you will get at any point in time; you want each of those connections to be a direct dedicated server connection. Otherwise, you just have a connection pooling feature connecting to yet another connection pooling feature.
What are the benefits of shared server, bearing in mind that you have to be somewhat careful about the transaction types you let use it? Shared server does three things: it reduces the number of operating system processes/threads, it artificially limits the degree of concurrency, and it reduces the memory needed on the system. Let's discuss these points in more detail.
On a system with thousands of users, the operating system may quickly become overwhelmed in trying to manage thousands of processes. In a typical system, only a fraction of the thousands of users are concurrently active at any point in time. For example, I've worked on systems with 5,000 concurrent users. At any one point in time, at most 50 were active. This system would work effectively with 50 shared server processes, reducing the number of processes the operating system has to manage by two orders of magnitude (100 times). The operating system can now, to a large degree, avoid context switching.
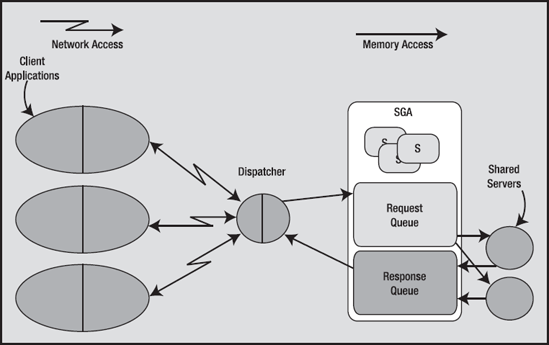
Speaking as a person who has been involved in many benchmarks, the benefits of this seem obvious. When running benchmarks, people frequently ask to run as many users as possible until the system breaks. One of the outputs of these benchmarks is always a chart that shows the number of concurrent users versus the number of transactions (see Figure 5-3).
Initially, as you add concurrent users, the number of transactions increases. At some point, however, adding additional users does not increase the number of transactions you can perform per second; the graph tends to flatten off. The throughput has peaked and now response time starts to increase. In other words, you are doing the same number of transactions per second, but the end users are observing slower response times. As you continue adding users, you will find that the throughput will actually start to decline. The concurrent user count before this drop-off is the maximum degree of concurrency you want to allow on the system. Beyond this point, the system becomes flooded and queues begin forming to perform work. Much like a backup at a tollbooth, the system can no longer keep up. Not only does response time rise dramatically at this point, but throughput from the system may fall, too, as the overhead of simply context switching and sharing resources between too many consumers takes additional resources itself. If we limit the maximum concurrency to the point right before this drop, we can sustain maximum throughput and minimize the increase in response time for most users. Shared server allows us to limit the maximum degree of concurrency on our system to this number.
An analogy for this process could be a simple door. The width of the door and the width of people limit the maximum people per minute throughput. At low load, there is no problem; however, as more people approach, some forced waiting occurs (CPU time slice). If a lot of people want to get through the door, we get the fallback effect—there are so many people saying "after you" and so many false starts that the throughput falls. Everybody gets delayed getting through. Using a queue means the throughput increases, some people get through the door almost as fast as if there was no queue, while others (the ones put at the end of the queue) experience the greatest delay and might fret that "this was a bad idea." But when you measure how fast everybody (including the last person) gets through the door, the queued model (shared server) performs better than a free-for-all approach (even with polite people; but conjure up the image of the doors opening when a store has a large sale, with everybody pushing very hard to get through).
This is one of the most highly touted reasons for using shared server: it reduces the amount of required memory. It does, but not as significantly as you might think, especially given the new automatic PGA memory management discussed in Chapter 4, "Memory Structures," where work areas are allocated to a process, used, and released—and their size varies based on the concurrent workload. So, this was a fact that was truer in older releases of Oracle but is not as meaningful today. Also, remember that when you use shared server, the UGA is located in the SGA. This means that when switching over to shared server, you must be able to accurately determine your expected UGA memory needs and allocate appropriately in the SGA via the LARGE_POOL_SIZE parameter. The SGA requirements for the shared server configuration are typically very large. This memory must typically be preallocated and thus can only be used by the database instance.
Note
It is true that with a resizable SGA, you may grow and shrink this memory over time, but for the most part, it will be owned by the database instance and will not be usable by other processes.
Contrast this with dedicated server, where anyone can use any memory not allocated to the SGA. If the SGA is much larger due to the UGA being located in it, where does the memory savings come from? It comes from having that many fewer PGAs allocated. Each dedicated/shared server has a PGA. This is process information. It is sort areas, hash areas, and other process-related structures. It is this memory need that you are removing from the system by using shared server. If you go from using 5,000 dedicated servers to 100 shared servers, it is the cumulative sizes of the 4,900 PGAs (excluding their UGAs) you no longer need that you are saving with shared server.
So, what about DRCP, the new 11g feature? It has many of the benefits of shared server such as reduced processes (we are pooling), possible memory savings without the drawbacks. There is no chance of artificial deadlock; for example, the session that holds the lock on the resource in the example above would have its own dedicated server dedicated to it from the pool, and that session would be able to release the lock eventually. It doesn't have the multi-threading capability of shared server; when a client process gets a dedicated server from the pool, it owns that process until that client process releases it. Therefore, it is best suited for client applications that frequently connect, do some relatively short process, and disconnect-over and over and over again; in short, for client processes that have an API that do not have an efficient connection pool of their own.
Unless your system is overloaded, or you need to use a shared server for a specific feature, a dedicated server will probably serve you best. A dedicated server is simple to set up (in fact, there is no setup!) and makes tuning easier.
Note
With shared server connections, a session's trace information (SQL_TRACE=TRUE output) may be spread across many individual trace files; thus, reconstructing what that session has done is more difficult. With the advent of the DBMS_MONITOR package in Oracle Database 10g and above, much of the difficulty has been removed, but it still complicates matters.
If you have a very large user community and know that you will be deploying with shared server, I would urge you to develop and test with shared server. It will increase your likelihood of failure if you develop under just a dedicated server and never test on shared server. Stress the system, benchmark it, and make sure that your application is well behaved under shared server. That is, make sure it does not monopolize shared servers for too long. If you find that it does so during development, it is much easier to fix at that stage than during deployment. You can use features such as the Advanced Queuing (AQ) to turn a long-running process into an apparently short one, but you have to design that into your application. These sorts of things are best done when you are developing. Also, historically, there have been differences between the feature set available to shared server connections versus dedicated server connections. We already discussed the lack of automatic PGA memory management in Oracle 9i, for example, but also in the past, things as basic as a hash join between two tables were not available in shared server connections. (Hash joins are available in the current 9i and above releases with shared server!)
The Oracle instance is made up of two things: the SGA and a set of background processes. The background processes perform the mundane maintenance tasks needed to keep the database running. For example, there is a process that maintains the block buffer cache for us, writing blocks out to the data files as needed. Another process is responsible for copying an online redo log file to an archive destination as it fills up. Yet another process is responsible for cleaning up after aborted processes, and so on. Each of these processes is pretty focused on its job, but works in concert with all of the others. For example, when the process responsible for writing to the log files fills one log and goes to the next, it will notify the process responsible for archiving that full log file that there is work to be done.
There is a V$ view you can use to see all of the possible Oracle background processes and determine which ones are in use in your system currently:
ops$tkyte%ORA11GR2> select paddr, name, description
  2    from v$bgprocess
  3   order by paddr desc
  4  /

PADDR    NAME DESCRIPTION
-------- ---- ----------------------------------------------------------------
32BC8D1C VKRM Virtual sKeduler for Resource Manager
32BC8244 SMCO Space Manager Process
32BC4C0C CJQ0 Job Queue Coordinator
32BC365C QMNC AQ Coordinator
...
00       ACFS ACFS CSS
00       XDMG cell automation manager
00       XDWK cell automation worker actions

295 rows selected.
Rows in this view with a PADDR other than 00 are processes (threads) configured and running on your system.
There are two classes of background processes: those that have a focused job to do (as just described) and those that do a variety of other jobs (i.e., utility processes). For example, there is a utility background process for the internal job queues accessible via the DBMS_JOB/DBMS_SCHEDULER packages. This process monitors the job queues and runs whatever is inside them. In many respects, it resembles a dedicated server process, but without a client connection. Let's examine each of these background processes, starting with the ones that have a focused job, and then look into the utility processes.
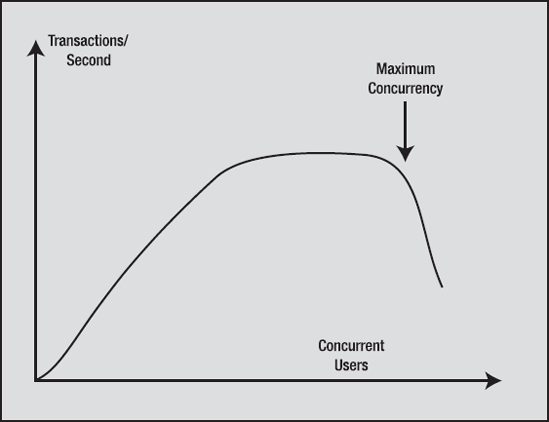
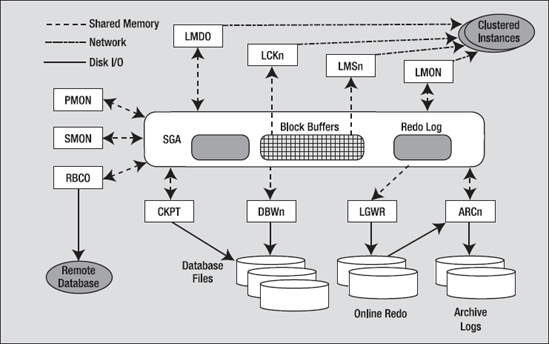
The number, names, and types of focused background processes varies by release. Figure 5-4 depicts a typical set of Oracle background processes that have a focused purpose:
For example, in Oracle Database 11g Release 2, a database started using a minimum number of init.ora parameters
ops$tkyte%ORA11GR2> !cat /tmp/pfile *.compatible='11.2.0.0.0' *.control_files='/home/ora11gr2/app/ora11gr2/oradata/orcl/control01.ctl','/home/ora11gr2/app/ora11gr2/flash_recovery_area/orcl/control02.ctl' *.db_block_size=8192 *.db_name='orcl' *.memory_target=314572800 *.undo_tablespace='UNDOTBS1'
would have about 17 background processes started up
ops$tkyte%ORA11GR2> select paddr, name, description
  2    from v$bgprocess
  3   where paddr <> '00'
  4   order by paddr desc
  5  /

PADDR    NAME DESCRIPTION
-------- ---- ----------------------------------------------------------------
32AF0E64 CJQ0 Job Queue Coordinator
32AEF8B4 QMNC AQ Coordinator
32AEE304 MMNL Manageability Monitor Process 2
32AED82C MMON Manageability Monitor Process
32AECD54 RECO distributed recovery
32AEC27C SMON System Monitor Process
32AEB7A4 CKPT checkpoint
32AEACCC LGWR Redo etc.
32AEA1F4 DBW0 db writer process 0
32AE971C MMAN Memory Manager
32AE8C44 DIA0 diagnosibility process 0
32AE816C PSP0 process spawner 0
32AE7694 DBRM DataBase Resource Manager
32AE6BBC DIAG diagnosibility process
32AE60E4 GEN0 generic0
32AE560C VKTM Virtual Keeper of TiMe process
32AE4B34 PMON process cleanup

17 rows selected.
Using the same init.ora, only replacing memory_target with sga_target and pga_aggregate_target, in Oracle Database 10g Release 2, you might only see 12:
ops$tkyte %ORA10GR2> select paddr, name, description
  2    from v$bgprocess
  3   where paddr <> '00'
  4   order by paddr desc
  5  /

PADDR    NAME DESCRIPTION
-------- ---- ----------------------------------------------------------------
23D27AC4 CJQ0 Job Queue Coordinator
23D27508 QMNC AQ Coordinator
23D26990 MMNL Manageability Monitor Process 2
23D263D4 MMON Manageability Monitor Process
23D25E18 RECO distributed recovery
23D2585C SMON System Monitor Process
23D252A0 CKPT checkpoint
23D24CE4 LGWR Redo etc.
23D24728 DBW0 db writer process 0
23D2416C MMAN Memory Manager
23D23BB0 PSP0 process spawner 0
23D235F4 PMON process cleanup

12 rows selected.
Note that you may not see all of these processes when you start your instance, but the majority of them will be present. You will only see ARCn (the archiver) if you are in ARCHIVELOG mode and have enabled automatic archiving. You will only see the LMD0, LCKn, LMON, and LMSn (more details on those processes shortly) processes if you are running Oracle RAC, a configuration of Oracle that allows many instances on different machines in a cluster to mount and open the same physical database.
So, Figure 5-4 depicts roughly what you might see if you started an Oracle instance, and mounted and opened a database. On an operating system where Oracle implements a multi-process architecture, such as on a Linux system, you can physically see these processes. After starting the instance, I observed the following:
$ ps -aef | grep ora_...._$ORACLE_SID | grep -v grep
ora11gr2 21646     1  0 09:04 ?        00:00:00 ora_pmon_orcl
ora11gr2 21648     1  0 09:04 ?        00:00:00 ora_vktm_orcl
ora11gr2 21652     1  0 09:04 ?        00:00:00 ora_gen0_orcl
ora11gr2 21654     1  0 09:04 ?        00:00:00 ora_diag_orcl
ora11gr2 21656     1  0 09:04 ?        00:00:00 ora_dbrm_orcl
ora11gr2 21658     1  0 09:04 ?        00:00:00 ora_psp0_orcl
ora11gr2 21660     1  0 09:04 ?        00:00:00 ora_dia0_orcl
ora11gr2 21662     1  0 09:04 ?        00:00:00 ora_mman_orcl
ora11gr2 21664     1  0 09:04 ?        00:00:00 ora_dbw0_orcl
ora11gr2 21666     1  0 09:04 ?        00:00:00 ora_lgwr_orcl
ora11gr2 21668     1  0 09:04 ?        00:00:00 ora_ckpt_orcl
ora11gr2 21670     1  0 09:04 ?        00:00:00 ora_smon_orcl
ora11gr2 21672     1  0 09:04 ?        00:00:00 ora_reco_orcl
ora11gr2 21674     1  0 09:04 ?        00:00:00 ora_mmon_orcl
ora11gr2 21676     1  0 09:04 ?        00:00:00 ora_mmnl_orcl
ora11gr2 21678     1  0 09:04 ?        00:00:00 ora_d000_orcl
ora11gr2 21680     1  0 09:04 ?        00:00:00 ora_s000_orcl
ora11gr2 21698     1  0 09:05 ?        00:00:00 ora_qmnc_orcl
ora11gr2 21712     1  0 09:05 ?        00:00:00 ora_cjq0_orcl
ora11gr2 21722     1  0 09:05 ?        00:00:00 ora_q000_orcl
ora11gr2 21724     1  0 09:05 ?        00:00:00 ora_q001_orcl
ora11gr2 21819     1  0 09:10 ?        00:00:00 ora_smco_orcl
ora11gr2 21834     1  0 09:10 ?        00:00:00 ora_w000_orcl
ora11gr2 22005     1  0 09:18 ?        00:00:00 ora_q002_orcl
ora11gr2 22056     1  0 09:20 ?        00:00:00 ora_j000_orcl
ora11gr2 22058     1  0 09:20 ?        00:00:00 ora_j001_orcl
ora11gr2 22074     1  0 09:21 ?        00:00:00 ora_m000_orcl
It is interesting to note the naming convention used by these processes. The process name starts with ora_. It is followed by four characters representing the actual name of the process, which are followed by _orcl. As it happens, my ORACLE_SID (site identifier) is orcl. On UNIX, this makes it very easy to identify the Oracle background processes and associate them with a particular instance (on Windows, there is no easy way to do this, as the backgrounds are threads in a larger, single process). What is perhaps most interesting, but not readily apparent from the preceding code, is that they are all really the same exact binary executable program—there is not a separate executable for each "program." Search as hard as you like, but you will not find the ora_pmon_orcl binary executable on disk anywhere. You will not find ora_lgwr_orcl or ora_reco_orcl. These processes are all really oracle (that's the name of the binary executable that is run). They just alias themselves upon startup to make it easier to identify which process is which. This enables a great deal of object code to be efficiently shared on the UNIX platform. On Windows, this is not nearly as interesting, as they are just threads within the process, so of course they are one big binary.
Let's now take a look at the function performed by each major process of interest, starting with the primary Oracle background processes. For a complete listing of the possible background processes and a short synopsis of the function they perform, I will direct you to the appendix of the Oracle Server Reference Manual available freely on http://otn.oracle.com/.
This process is responsible for cleaning up after abnormally terminated connections. For example, if your dedicated server "fails" or is killed for some reason, PMON is the process responsible for fixing (recovering or undoing work) and releasing your resources. PMON will initiate the rollback of uncommitted work, release locks, and free SGA resources allocated to the failed process.
In addition to cleaning up after aborted connections, PMON is responsible for monitoring the other Oracle background processes and restarting them if necessary (and if possible). If a shared server or a dispatcher fails (crashes), PMON will step in and restart another one (after cleaning up for the failed process). PMON will watch all of the Oracle processes and either restart them or terminate the instance as appropriate. For example, it is appropriate to fail the instance in the event the database log writer process, LGWR, fails. This is a serious error, and the safest path of action is to terminate the instance immediately and let normal recovery fix the data. (Note that this is a rare occurrence and should be reported to Oracle Support immediately.)
The other thing PMON does for the instance is to register it with the Oracle TNS listener. When an instance starts up, the PMON process polls the well-known port address, unless directed otherwise, to see whether or not a listener is up and running. The well-known/default port used by Oracle is 1521. Now, what happens if the listener is started on some different port? In this case, the mechanism is the same, except that the listener address needs to be explicitly specified by the LOCAL_LISTENER parameter setting. If the listener is running when the database instance is started, PMON communicates with the listener and passes to it relevant parameters, such as the service name and load metrics of the instance. If the listener was not started, PMON will periodically attempt to contact it to register itself.
SMON is the process that gets to do all of the system-level jobs. Whereas PMON was interested in individual processes, SMON takes a system-level perspective of things and is a sort of garbage collector for the database. Some of the jobs it does include the following:
Cleans up temporary space: With the advent of true temporary tablespaces, the chore of cleaning up temporary space has lessened, but it has not gone away. For example, when building an index, the extents allocated for the index during the creation are marked as
TEMPORARY. If theCREATE INDEXsession is aborted for some reason,SMONis responsible for cleaning them up. Other operations create temporary extents thatSMONwould be responsible for as well.Coalesces free space: If you are using dictionary-managed tablespaces,
SMONis responsible for taking extents that are free in a tablespace and contiguous with respect to each other and coalescing them into one larger free extent. This occurs only on dictionary-managed tablespaces with a default storage clause that haspctincreaseset to a nonzero value.Recovers transactions active against unavailable files: This is similar to its role during database startup. Here,
SMONrecovers failed transactions that were skipped during instance/crash recovery due to a file(s) not being available to recover. For example, the file may have been on a disk that was unavailable or not mounted. When the file does become available,SMONwill recover it.Performs instance recovery of a failed node in RAC: In an Oracle RAC configuration, when a database instance in the cluster fails (e.g., the machine the instance was executing on fails), some other node in the cluster will open that failed instance's redo log files and perform a recovery of all data for that failed instance.
Cleans up
OBJ$:OBJ$is a low-level data dictionary table that contains an entry for almost every object (table, index, trigger, view, and so on) in the database. Many times, there are entries in here that represent deleted objects, or objects that represent "not there" objects, used in Oracle's dependency mechanism.SMONis the process that removes these rows that are no longer needed.Shrinks undo segments:
SMONwill perform the automatic shrinking of a rollback segment to its optimal size, if it is set.Offlines rollback segments: It is possible for the DBA to offline, or make unavailable, a rollback segment that has active transactions. It may be possible that active transactions are using this offlined rollback segment. In this case, the rollback is not really offlined; it is marked as "pending offline." In the background,
SMONwill periodically try to truly take it offline, until it succeeds.
That should give you a flavor of what SMON does. It does many other things, such as flush the monitoring statistics that show up in the DBA_TAB_MONITORING view, flush the SCN to timestamp mapping information found in the SMON_SCN_TIME table, and so on. The SMON process can accumulate quite a lot of CPU over time, and this should be considered normal. SMON periodically wakes up (or is woken up by the other background processes) to perform these housekeeping chores.
RECO has a very focused job: it recovers transactions that are left in a prepared state because of a crash or loss of connection during a two-phase commit (2PC). A 2PC is a distributed protocol that allows for a modification that affects many disparate databases to be committed atomically. It attempts to close the window for distributed failure as much as possible before committing. In a 2PC between N databases, one of the databases—typically (but not always) the one the client logged into initially—will be the coordinator. This one site will ask the other N-1 sites if they are ready to commit. In effect, this one site will go to the N-1 sites and ask them to be prepared to commit. Each of the N-1 sites reports back its prepared state as YES or NO. If any one of the sites votes NO, the entire transaction is rolled back. If all sites vote YES, then the site coordinator broadcasts a message to make the commit permanent on each of the N-1 sites.
Say a site votes YES and is prepared to commit, but before it gets the directive from the coordinator to actually commit, the network fails or some other error occurs, then the transaction becomes an in-doubt distributed transaction. The 2PC tries to limit the window of time in which this can occur, but cannot remove it. If there is a failure right then and there, the transaction will become the responsibility of RECO. RECO will try to contact the coordinator of the transaction to discover its outcome. Until it does that, the transaction will remain in its uncommitted state. When the transaction coordinator can be reached again, RECO will either commit the transaction or roll it back.
It should be noted that if the outage is to persist for an extended period of time, and you have some outstanding transactions, you can commit/roll them back manually. You might want to do this since an in-doubt distributed transaction can cause writers to block readers—this is the one time this can happen in Oracle. Your DBA could call the DBA of the other database and ask her to query the status of those in-doubt transactions. Your DBA can then commit or roll them back, relieving RECO of this task.
The checkpoint process doesn't, as its name implies, do a checkpoint (checkpoints were discussed in Chapter 3, "Files," in the section on redo logs)—that's mostly the job of DBWn. It simply assists with the checkpointing process by updating the file headers of the data files. It used to be that CKPT was an optional process, but starting with version 8.0 of the database, it is always started, so if you do a ps on UNIX, you'll always see it there. The job of updating data files' headers with checkpoint information used to belong to the LGWR; however, as the number of files increased along with the size of a database over time, this additional task for LGWR became too much of a burden. If LGWR had to update dozens, or hundreds, or even thousands, of files, there would be a good chance sessions waiting to commit these transactions would have to wait far too long. CKPT removes this responsibility from LGWR.
The database block writer (DBWn) is the background process responsible for writing dirty blocks to disk. DBWn will write dirty blocks from the buffer cache, usually to make more room in the cache (to free buffers for reads of other data) or to advance a checkpoint (to move forward the position in an online redo log file from which Oracle would have to start reading, to recover the instance in the event of failure). As we discussed in Chapter 3, "Files," when Oracle switches log files, a checkpoint is signaled. Oracle needs to advance the checkpoint so that it no longer needs the online redo log file it just filled up. If it hasn't been able to do that by the time we need to reuse that redo log file, we get the "checkpoint not complete" message and we must wait.
Note
Advancing log files is only one of many ways for checkpoint activity to occur. There are incremental checkpoints controlled by parameters such as FAST_START_MTTR_TARGET and other triggers that cause dirty blocks to be flushed to disk.
As you can see, the performance of DBWn can be crucial. If it does not write out blocks fast enough to free buffers (buffers that can be reused to cache some other blocks) for us, we will see both the number and duration of waits on Free Buffer Waits and Write Complete Waits start to grow.
We can configure more than one DBWn; in fact, we can configure up to 36 (DBW0 . . . DBW9, DBWa . . . DBWz). Most systems run with one database block writer, but larger, multi-CPU systems can make use of more than one. This is generally done to distribute the workload of keeping a large block buffer cache in the SGA clean, flushing the dirtied (modified) blocks to disk.
Optimally, the DBWn uses asynchronous I/O to write blocks to disk. With asynchronous I/O, DBWn gathers up a batch of blocks to be written and gives them to the operating system. DBWn does not wait for the operating system to actually write the blocks out; rather, it goes back and collects the next batch to be written. As the operating system completes the writes, it asynchronously notifies DBWn that it completed the writes. This allows DBWn to work much faster than if it had to do everything serially. We'll see later in the "Slave Processes" section how we can use I/O slaves to simulate asynchronous I/O on platforms or configurations that do not support it.
I would like to make one final point about DBWn. It will, almost by definition, write out blocks scattered all over disk—DBWn does lots of scattered writes. When you do an update, you'll be modifying index blocks that are stored here and there, and data blocks that are also randomly distributed on disk. LGWR, on the other hand, does lots of sequential writes to the redo log. This is an important distinction and one of the reasons that Oracle has a redo log and the LGWR process as well as the DBWn process. Scattered writes are significantly slower than sequential writes. By having the SGA buffer dirty blocks and the LGWR process do large sequential writes that can re-create these dirty buffers, we achieve an increase in performance. The fact that DBWn does its slow job in the background while LGWR does its faster job while the user waits gives us better overall performance. This is true even though Oracle may technically be doing more I/O than it needs to (writes to the log and to the data file); the writes to the online redo log could in theory be skipped if, during a commit, Oracle physically wrote the modified blocks out to disk instead. In practice, it does not happen this way. LGWR writes the redo information to the online redo logs for every transaction, and DBWn flushes the database blocks to disk in the background.
The LGWR process is responsible for flushing to disk the contents of the redo log buffer located in the SGA. It does this when one of the following is true:
Every three seconds
Whenever a commit is issued by any transaction
When the redo log buffer is one-third full or contains 1MB of buffered data
For these reasons, having an enormous (hundreds/thousands of megabytes) redo log buffer is not practical; Oracle will never be able to use it all since it pretty much continuously flushes it. The logs are written to with sequential writes as compared to the scattered I/O DBWn must perform. Doing large batch writes like this is much more efficient than doing many scattered writes to various parts of a file. This is one of the main reasons for having a LGWR and redo logs in the first place. The efficiency in just writing out the changed bytes using sequential I/O outweighs the additional I/O incurred. Oracle could just write database blocks directly to disk when you commit, but that would entail a lot of scattered I/O of full blocks, and this would be significantly slower than letting LGWR write the changes out sequentially.
The job of the ARCn process is to copy an online redo log file to another location when LGWR fills it up. These archived redo log files can then be used to perform media recovery. Whereas online redo log is used to fix the data files in the event of a power failure (when the instance is terminated), archived redo logs are used to fix data files in the event of a hard disk failure. If we lose the disk drive containing the data file, /d01/oradata/ora11g/system.dbf, we can go to our backups from last week, restore that old copy of the file, and ask the database to apply all of the archived and online redo logs generated since that backup took place. This will catch up that file with the rest of the data files in our database, and we can continue processing with no loss of data.
ARCn typically copies online redo log files to at least two other locations (redundancy being a key to not losing data!). These other locations may be disks on the local machine or, more appropriately, at least one will be located on another machine altogether, in the event of a catastrophic failure. In many cases, these archived redo log files are copied by some other process to some tertiary storage device, such as tape. They may also be sent to another machine to be applied to a standby database, a failover option offered by Oracle. We'll discuss the processes involved in that shortly.
In past releases, the DIAG process was used exclusively in a RAC environment. As of Oracle Database 11g, with the new ADR (Advanced Diagnostic Repository), it is responsible for monitoring the overall health of the instance, and it captures information needed in the processing of instance failures. This applies to both single instance configurations as well as multi-instance RAC configurations.
This process is new in Oracle Database 11g Release 1 and above. It is the key component of the new flashback data archive capability-the ability to query data "as of" long periods of time ago (for example, to query data in a table as it appeared one year ago, five years ago, and so on). This long term historical query capability is achieved by maintaining a history of the row changes made to every row in a table over time. This history, in turn, is maintained by the FBDA process in the background. This process functions by working soon after a transaction commits. The FBDA process will read the UNDO generated by that transaction and roll back the changes made by the transaction. It will then record these rolled back (the original values) rows in the flashback data archive for us.
This process implements the resource plans that may be configured for a database instance. It sets the resource plans in place and performs various operations related to enforcing/implementing those resource plans. The resource manager allows the administrators of a database to have fine grained control over the resources used by the database instance, by applications accessing the database, or by individual users accessing the database.
This process provides, as expected by its name, a general task execution thread for the database. The main goal of this process is to offload potentially blocking processing (processing that would cause a process to stop while it occurs) from some other process and perform it in the background. For example, if the main ASM process needs to perform some blocking file operation, but that operation could safely be done in the background (ASM can safely continue processing before the operation completes), then the ASM process may request the GEN0 process to perform this operation and let GEN0 notify it upon completion. It is similar in nature to the slave processes described further below.
Depending on the features of Oracle you are using, other focused processes may be visible. Some are listed here with a brief description of their function.
Note
Appendix F of the Server Reference Manual, available on http://otn.oracle.com/, has a complete listing of the background processes and their functions.
Most of the processes described previously are nonnegotiable—you will have them if you have an Oracle instance running. (ARCn is technically optional but is, in my opinion, mandatory for all production databases!) The following processes are optional and will appear only if you make use of the specific feature. The following processes are unique to a database instance using ASM, as discussed in Chapter 3, "Files":
Automatic Storage Management Background (
ASMB)process: TheASMBprocess runs in a database instance that is making use of ASM. It is responsible for communicating to the ASM instance that is managing the storage, providing updated statistics to the ASM instance, and providing a heartbeat to the ASM instance, letting it know that it is still alive and functioning.ReBALance (
RBAL) process: TheRBALprocess also runs in a database instance that is making use of ASM. It is responsible for processing a rebalance request (a redistribution request) as disks are added/removed to and from an ASM disk group.
The following processes are found in an Oracle RAC instance. RAC is a configuration of Oracle whereby multiple instances, each running on a separate node (typically a separate physical computer) in a cluster, may mount and open a single database. It gives you the ability to have more than one instance accessing, in a full read-write fashion, a single set of database files. The primary goals of RAC are twofold:
High availability: With Oracle RAC, if one node/computer in the cluster fails due to a software, hardware, or human error, the other nodes may continue to function. The database will be accessible via the other nodes. You might lose some computing power, but you won't lose access to the database.
Scalability: Instead of buying larger and larger machines to handle an increasing workload (known as vertical scaling), RAC allows you to add resources in the form of more machines in the cluster (known as horizontal scaling). Instead of trading your 4 CPU machine in for one that can grow to 8 or 16 CPUs, RAC gives you the option of adding another relatively inexpensive 4 CPU machine (or more than one).
The following processes are unique to a RAC environment. You will not see them otherwise.
Lock monitor (
LMON) process: TheLMONprocess monitors all instances in a cluster to detect the failure of an instance. It then facilitates the recovery of the global locks held by the failed instance. It is also responsible for reconfiguring locks and other resources when instances leave or are added to the cluster (as they fail and come back online, or as new instances are added to the cluster in real time).Lock manager daemon (
LMD0) process: TheLMDprocess handles lock manager service requests for the global cache service (keeping the block buffers consistent between instances). It works primarily as a broker sending requests for resources to a queue that is handled by theLMSnprocesses. TheLMDhandles global deadlock detection/resolution and monitors for lock timeouts in the global environment.Lock manager server (
LMSn) process: As noted earlier, in a RAC environment, each instance of Oracle is running on a different machine in a cluster, and they all access, in a read-write fashion, the same exact set of database files. To achieve this, the SGA block buffer caches must be kept consistent with respect to each other. This is one of the main goals of theLMSnprocess. In earlier releases of Oracle Parallel Server (OPS) this was accomplished via a ping. That is, if a node in the cluster needed a read-consistent view of a block that was locked in exclusive mode by another node, the exchange of data was done via a disk flush (the block was pinged). This was a very expensive operation just to read data. Now, with theLMSn, this exchange is done via very fast cache-to-cache exchange over the clusters' high-speed connection. You may have up to tenLMSnprocesses per instance.Lock (
LCK0) process: This process is very similar in functionality to theLMDprocess described earlier, but it handles requests for all global resources other than database block buffers.
The following are common background processes seen with most single instance or RAC instances:
Process Spawner (
PSP0) Process: This process is responsible for spawning (starting/creating) the various background processes. It is the process that creates new processes/threads for the Oracle Instance. It does most of its work during instance startup.Virtual Keeper of Time (
VKTM) Process: Implements a consistent, fine-grained clock for the Oracle instance. It is responsible for providing both wall clock time (human readable) as well as an extremely high resolution timer (not necessarily built using wall clock time, more of a ticker that increments for very small units of time) used to measure durations and intervals.Space Management Coordinator (
SMCO) Process: This process is part of the manageability infrastructure. It coordinates the proactive space management features of the database such as the processes that discover space that could be reclaimed and the processes that perform the reclamation.
These background processes are totally optional, based on your need for them. They provide facilities not necessary to run the database day to day, unless you are using them yourself, such as the job queues, or are making use of a feature that uses them, such as the new Oracle 10g diagnostic capabilities.
These processes will be visible in UNIX as any other background process would be. If you do a ps, you will see them. In my ps listing from the beginning of the focused background processes section (reproduced in part here), you can see that I have
Job queues configured. The
CJQ0process is the job queue coordinator.Oracle AQ configured, as evidenced by the
Q000(AQ queue process) andQMNC(AQ monitor process).Automatic memory management enabled, as evidenced by the Memory Manager (
MMAN) process.Oracle manageability/diagnostic features enabled, as evidenced by the Manageability Monitor (
MMON) and Manageability Monitor Light (MMNL) processes.
Let's take a look at the various processes you might see depending on the features you are using.
In the first 7.0 release, Oracle provided replication in the form of a database object known as a snapshot. Job queues were the internal mechanism by which these snapshots were refreshed, or made current.
A job queue process monitored a job table that told it when it needed to refresh various snapshots in the system. In Oracle 7.1, Oracle Corporation exposed this facility for all to use via a database package called DBMS_JOB. So a process that was solely the domain of the snapshot in 7.0 became the "job queue" in 7.1 and later versions. Over time, the parameters for controlling the behavior of the job queue (how frequently it should be checked and how many queue processes there should be) changed in name from SNAPSHOT_REFRESH_INTERVAL and SNAPSHOT_REFRESH_PROCESSES to JOB_QUEUE_INTERVAL and JOB_QUEUE_PROCESSES. In current releases only the JOB_QUEUE_PROCESSES parameter is exposed as a user-tunable setting.
You may have up to 1,000 job queue processes. Their names will be J000 . . . J999. These processes are used heavily in replication as part of the materialized view refresh process. Streams-based replication (new with Oracle9i Release 2) uses AQ for replication and therefore does not use the job queue processes. Developers also frequently use the job queues in order to schedule one-off (background) jobs or recurring jobs such as sending an e-mail in the background or processing a long-running batch process in the background. By doing some work in the background, you can make a long task seem to take much less time to an impatient end user (he feels like it went faster, even though it might not be done yet). This is similar to what Oracle does with LGWR and DBWn processes; they do much of their work in the background, so you don't have to wait for them to complete all tasks in real time.
The Jnnn, where nnn represents a number, processes are very much like a shared server, but with aspects of a dedicated server. They are shared in the sense that they process one job after the other, but they manage memory more like a dedicated server would (their UGA memory is in the PGA, not the SGA). Each job queue process will run exactly one job at a time, one after the other, to completion. That is why we may need multiple processes if we wish to run jobs at the same time. There is no threading or preempting of a job. Once a job is running, it will run to completion (or failure).
You will notice that the Jnnn processes come and go over time. That is, if you configure up to 1,000 of them, you will not see 1,000 of them start up with the database. Rather, a sole process, the Job Queue Coordinator (CJQ0) will start up, and as it sees jobs that need to be run in the job queue table, it will start the Jnnn processes. As the Jnnn processes complete their work and discover no new jobs to process, they will start to exit, to go away. So, if you schedule most of your jobs to run at 2:00 AM when no one is around, you might well never actually see these Jnnn processes.
The QMNC process is to the AQ tables what the CJQ0 process is to the job table. It monitors the advanced queues and alerts waiting message dequeuers that a message has become available. QMNC and Qnnn are also responsible for queue propagation—that is, the ability of a message that was enqueued (added) in one database to be moved to a queue in another database for dequeueing.
The Qnnn process are to the QMNC process what the Jnnn processes are to the CJQ0 process. They are notified by the QMNC process of work that needs to be performed, and they process the work.
The QMNC and Qnnn processes are optional background processes. The parameter AQ_TM_PROCESSES specifies creation of up to ten of these processes named Q000 . . . Q009, and a single QMNC process. Unlike the Jnnn processes used by the job queues, the Qnnn processes are persistent. If you set AQ_TM_PROCESSES to 10, you will see ten Qnnn processes and the QMNC process at database startup and for the entire life of the instance.
The EMNC process is part of the AQ architecture. It is used to notify queue subscribers of messages they would be interested in. This notification is performed asynchronously. There are Oracle Call Interface (OCI) functions available to register a callback for message notification. The callback is a function in the OCI program that will be invoked automatically whenever a message of interest is available in the queue. The EMNn background process is used to notify the subscriber. The EMNC process is started automatically when the first notification is issued for the instance. The application may then issue an explicit message_receive(dequeue) to retrieve the message.
This process is new with Oracle 10g and above and is used by the automatic SGA sizing feature. The MMAN process coordinates the sizing and resizing of the shared memory components (the default buffer pool, the shared pool, the Java pool, and the large pool).
These processes are used to populate the Automatic Workload Repository (AWR), a new feature in Oracle 10g. The MMNL process flushes statistics from the SGA to database tables on a scheduled basis. The MMON process is used to auto-detect database performance issues and implement the new self-tuning features. The Mnnn processes are similar to the Jnnn or Qnnn processes for the job queues; the MMON process will request these slave processes to perform work on its behalf. The Mnnn processes are transient in nature—they will come and go as needed.
This is a new optional process of the Oracle 10g database. The CTWR process is responsible for maintaining the new change tracking file, as described in Chapter 3.
This process, another new optional process of the Oracle 10g database, is responsible for maintaining the before images of blocks in the Flash Recovery Area (described in Chapter 3) used with the FLASHBACK DATABASE command.
Data Pump was a new feature added in Oracle 10g Release 1 of the database. It was designed as a complete rewrite of the legacy export/import processes. Data Pump runs entirely in the server and the API to it is via PL/SQL. Since Data Pump runs in the server, support for performing the various Data Pump operations were added. The Data Pump master (DMnn) collects all inputs from client processes (it is the process that receives the API inputs) and then coordinates the worker processes (the DWnn) which perform the real work-the DMnn processes do the actual processing of the metadata and data.
So, is that the complete list? No, there are others. For example, Oracle Data Guard has a set of processes associated with it to facilitate the shipping of redo information from one database to another and apply it (see the Data Guard Concepts and Administration Guide from Oracle for details). There are Streams apply and capture processes as well. However, the preceding list covers most of the common background processes you |will encounter.
Now we are ready to look at the last class of Oracle processes: the slave processes. There are two types of slave processes with Oracle, I/O slaves and parallel query slaves.
I/O slaves are used to emulate asynchronous I/O for systems or devices that do not support it. For example, tape devices (which are notoriously slow) do not support asynchronous I/O. By using I/O slaves, we can mimic for tape drives what the operating system normally provides for disk drives. Just as with true asynchronous I/O, the process writing to the device batches a large amount of data and hands it off to be written. When the data is successfully written, the writer (our I/O slave this time, not the operating system) signals the original invoker, who removes this batch of data from its list of data that needs to be written. In this fashion, we can achieve a much higher throughput, since the I/O slaves are the ones waiting for the slow device, while their caller is off doing other important work getting the data together for the next write.
I/O slaves are used in a couple of places in Oracle. DBWn and LGWR can make use of them to simulate asynchronous I/O, and RMAN will make use of them when writing to tape.
Two parameters control the use of I/O slaves:
BACKUP_TAPE_IO_SLAVES: This parameter specifies whether I/O slaves are used by RMAN to back up, copy, or restore data to tape. Since this parameter is designed around tape devices, and tape devices may be accessed by only one process at any time, this parameter is a Boolean, and not the number of slaves to use, as you might expect. RMAN will start up as many slaves as necessary for the number of physical devices being used. WhenBACKUP_TAPE_IO_SLAVES = TRUE, an I/O slave process is used to write to or read from a tape device. If this parameter isFALSE(the default), then I/O slaves are not used for backups. Instead, the dedicated server process engaged in the backup will access the tape device.DBWR_IO_SLAVES: This parameter specifies the number of I/O slaves used by theDBW0process. TheDBW0process and its slaves always perform the writing to disk of dirty blocks in the buffer cache. By default, the value is 0 and I/O slaves are not used. Note that if you set this parameter to a nonzero value,LGWRandARCHwill use their own I/O slaves as well, up to four I/O slaves forLGWRandARCHwill be permitted.
The DBWR I/O slaves appear with the name I1nn, and the LGWR I/O slaves appear with the name I2nn.
Oracle 7.1.6 introduced the parallel query capability into the database. This is the capability to take a SQL statement such as a SELECT, CREATE TABLE, CREATE INDEX, UPDATE, and so on and create an execution plan that consists of many execution plans that can be done simultaneously. The outputs of each of these plans are merged together into one larger result. The goal is to do an operation in a fraction of the time it would take if you did it serially. For example, say you have a really large table spread across ten different files. You have 16 CPUs at your disposal, and you need to execute an ad hoc query on this table. It might be advantageous to break the query plan into 32 little pieces and really make use of that machine, as opposed to just using one process to read and process all of that data serially.
When using parallel query, you will see processes named Pnnn—these are the parallel query execution servers themselves. During the processing of a parallel statement, your server process will be known as the Parallel Query Coordinator. Its name won't change at the operating system level, but as you read documentation on parallel query, when you see references to the coordinator process, know that it is simply your original server process.
We've covered the files used by Oracle, from the lowly but important parameter file to data files, redo log files, and so on. We've taken a look inside the memory structures used by Oracle, both in the server processes and the SGA. We've seen how different server configurations, such as shared server versus dedicated server mode for connections, will have a dramatic impact on how memory is used by the system. Lastly, we looked at the processes (or threads, depending on the operating system) that enable Oracle to do what it does. Now we are ready to look at the implementation of some other features of Oracle, such as locking, concurrency controls, and transactions.