
In this chapter, we'll look at Oracle's three major memory structures:
System Global Area (SGA): This is a large, shared memory segment that virtually all Oracle processes will access at one point or another.
Process Global Area (PGA): This is memory that is private to a single process or thread; it is not accessible from other processes/threads.
User Global Area (UGA): This is memory associated with your session. It is located either in the SGA or the PGA, depending whether you are connected to the database using a shared server (it will be in the SGA), or a dedicated server (it will be in the PGA).
Note
In earlier releases of Oracle, shared server was referred to as Multi-Threaded Server or MTS. In this book, we will always use the term shared server.
When we discuss memory management in Oracle, we have two methods to investigate. The first is manual memory management, whereby is responsible for sizing absolutely everything relating to how Oracle uses memory, from the amount of memory Oracle uses to sort data in memory, to the amount of memory it uses to cache database blocks in the buffer cache. We'll also examine automatic memory management, in which the DBA sets only a few (as few as one) initialization parameters and the database itself figures out the most appropriate usage of memory. When talking about automatic memory management, we actually have two levels of management to explore. In the first level, the DBA sets two parameters—to size the SGA and PGA memory regions. In the second level, available only in Oracle 11g and above, the DBA sets just one parameter—the MEMORY_TARGET parameter—to allow the database to determine how to size all of the memory regions. We'll attack both methods by first discussing PGA and UGA memory management, first manual and then automatic. We'll then move onto the SGA, again looking at both manual and then automatic memory management. We'll close with a look at how to manage memory using just a single parameter to control both the SGA and PGA regions.
The PGA is a process-specific piece of memory. In other words, it is memory specific to a single operating system process or thread. This memory is not accessible by any other process or thread in the system. It is typically allocated via either of the C runtime calls malloc() or memmap(), and it may grow (or even shrink) at runtime. The PGA is never allocated in Oracle's SGA; it is always allocated locally by the process or thread—the P in PGA stands for process or program; it is not shared.
The UGA is, in effect, your session's state. It is memory that your session must always be able to get to. The location of the UGA is wholly dependent on how you connect to Oracle. If you connect via a shared server, the UGA must be stored in a memory structure that every shared server process has access to—and that's the SGA. In this way, your session can use any one of the shared servers, since any of them can read and write your session's data. On the other hand, if you are using a dedicated server connection, there's no need for universal access to your session state, and the UGA becomes virtually synonymous with the PGA; it will, in fact, be contained in the PGA of your dedicated server. When you look at the system statistics, you'll find the UGA reported in the PGA in dedicated server mode (the PGA will be greater than or equal to the UGA memory used; the PGA memory size will include the UGA size as well).
So, the PGA contains process memory and may include the UGA. The other areas of PGA memory are generally used for in-memory sorting, bitmap merging, and hashing. It would be safe to say that, besides the UGA memory, these are the largest contributors by far to the PGA.
Starting with Oracle9i Release 1 and above, there are two ways to manage this other non-UGA memory in the PGA:
Manual PGA memory management, where you tell Oracle how much memory it can use to sort and hash any time it needs to sort or hash in a specific process.
Automatic PGA memory management, where you tell Oracle how much memory it should attempt to use system wide.
Starting in Oracle 11g Release 1, automatic PGA memory management can be implemented using one of two techniques:
By setting the
PGA_AGGREGATE_TARGETinitialization parameter and telling Oracle how much PGA memory to attempt to use.By setting the
MEMORY_TARGETinitialization parameter and telling Oracle how much total memory the database instance should use for both the SGA and the PGA; the PGA size will be figured out by the database itself from this parameter.
The manner in which memory is allocated and used differs greatly in each case, so we'll discuss each in turn.
Note
It should be noted that in Oracle9i, when using a shared server connection, you can use only manual PGA memory management. This restriction was lifted with Oracle 10g Release 1 (and above). In that release, you can use either automatic or manual PGA memory management with shared server connections.
PGA memory management modes are controlled by the database initialization parameter WORKAREA_SIZE_POLICY and may be altered at the session level. This initialization parameter defaults to AUTO, for automatic PGA memory management when possible in Oracle9i Release 2 and above. In Oracle9i Release 1, the default setting was MANUAL.
In the sections that follow, we'll take a look at each approach.
In manual PGA memory management, the parameters that have the largest impact on the size of your PGA, outside of the memory allocated by your session for PL/SQL tables and other variables, are:
SORT_AREA_SIZE: The total amount of RAM that will be used to sort information before swapping out to disk.SORT_AREA_RETAINED_SIZE: The amount of memory that will be used to hold sorted data after the sort is complete. That is, ifSORT_AREA_SIZEis 512KB andSORT_AREA_RETAINED_SIZEis 256KB, your server process would use up to 512KB of memory to sort data during the initial processing of the query. When the sort was complete, the sorting area would "shrink" down to 256KB, and any sorted data that did not fit in that 256KB would be written out to the temporary tablespace.HASH_AREA_SIZE: The amount of memory your server process can use to store hash tables in memory. These structures are used during a hash join, typically when joining a large set with another set. The smaller of the two sets would be hashed into memory and anything that didn't fit in the hash area region of memory would be stored in the temporary tablespace by the join key.
These parameters control the amount of space Oracle will use to sort or hash data before writing (swapping) it to disk, and how much of that memory segment will be retained after the sort is done. The SORT_AREA_SIZE-SORT_AREA_RETAINED_SIZE calculated value is generally allocated out of your PGA, and the SORT_AREA_RETAINED_SIZE value will be in your UGA. You can discover your current use of PGA and UGA memory and monitor its size by querying special Oracle V$ views, also referred to as dynamic performance views.
For example, let's run a small test whereby in one session we'll sort lots of data and, from a second session, we'll monitor the UGA/PGA memory use in that first session. To do this in a predictable manner, we'll make a copy of the ALL_OBJECTS table, with about 72,000 rows in this case, without any indexes (so we know a sort has to happen when we use ORDER BY on this table):
ops$tkyte%ORA11GR2> create table t as select * from all_objects;
Table created.

ops$tkyte%ORA11GR2> exec dbms_stats.gather_table_stats( user, 'T' );
PL/SQL procedure successfully completed.
To remove any side effects from the initial hard parsing of queries, we'll run the following script three times, but for now ignore its output. We'll run the script again in a fresh session so as to see the effects on memory usage in a controlled environment. We'll use the sort area sizes of 64KB, 1MB, and 1GB in turn, so save this script as run_query.sql:
connect /
set serveroutput off
set echo on
column sid new_val SID
select sid from v$mystat where rownum = 1;
alter session set workarea_size_policy=manual;
alter session set sort_area_size = &1;
prompt run @reset_stat &SID and @watch_stat in another session here!
pause
set termout off
select * from t order by 1, 2, 3, 4;
set termout on
prompt run @watch_stat in another session here!
Pause
@run_query 65536
@run_query 1048576
@run_query 1073741820
Just ignore the output for now; we are just warming up the shared pool and getting everything "even."
Note
When we process SQL in the database, we must first parse the SQL statement. There are two types of parses. The first is a hard parse, which is what happens the first time a query is parsed by the database instance and includes query plan generation and optimization. The second is a soft parse, which can skip many of the steps a hard parse must do. We hard parsed the previous queries so as to not measure the work performed by that operation in the following section.
I suggest logging out of that SQL*Plus session and logging back in before continuing, in order to get a consistent environment, or one in which no work has been done yet. Now, we will want to be able to measure the session memory of the session running the big ORDER BY queries from a second separate session. If we used the same session, our query to see how much memory we are using for sorting might itself influence the very numbers we are looking at. To measure the memory from this second session, we'll use a small SQL*Plus script I developed for this. It is actually a pair of scripts; you'll be told when to run them by the run_query.sql script. The one that resets a small table and sets a SQL*Plus variable to the SID we want to watch is called reset_stat.sql:
drop table sess_stats;

create table sess_stats
( name varchar2(64), value number, diff number );

variable sid number
exec :sid := &1
Note
Before using this script (or any script, for that matter), make sure you understand what the script does. This script drops and re-creates a table called SESS_STATS. If your schema already has such a table, you'll probably want to use a different name!
The other script is called watch_stat.sql, and for this case study, it uses the MERGE SQL statement so we can initially INSERT the statistic values for a session and then later come back and update them—without needing a separate INSERT/UPDATE script:
merge into sess_stats using ( select a.name, b.value from v$statname a, v$sesstat b where a.statistic# = b.statistic# and b.sid = :sidand (a.name like '%ga %'or a.name like '%direct temp%')) curr_stats on (sess_stats.name = curr_stats.name) when matched then update set diff = curr_stats.value - sess_stats.value, value = curr_stats.value when not matched then insert ( name, value, diff ) values ( curr_stats.name, curr_stats.value, null ) / select name, case when name like '%ga %' then round(value/1024,0) else value end kbytes_writes, case when name like '%ga %' then round(diff /1024,0) else value end diff_kbytes_writes from sess_stats order by name;
I emphasize the phrase "for this case study" because of the lines in bold—the names of the statistics we're interested in looking at change from example to example. In this particular case, we're interested in anything with ga in it (pga and uga), or anything with direct temp, which in Oracle 10g and above will show us the direct reads and writes against temporary space (how much I/O we did reading and writing to temp).
Note
In Oracle9i, direct I/O to temporary space was not labeled as such, so we used a WHERE clause that included (and a.name like '%ga %' or a.name like '%physical % direct%') in it.
When this watch_stat.sql script is run from the SQL*Plus command line, we'll see a listing of the PGA and UGA memory statistics for the session, as well as temporary I/O. Now, if you run the script "@run_query 65536" in a session, you'll see output like this:
ops$tkyte%ORA11GR2> @run_query 65536
ops$tkyte%ORA11GR2> connect /
Connected.
ops$tkyte%ORA11GR2> set serveroutput off
ops$tkyte%ORA11GR2> set echo on
ops$tkyte%ORA11GR2> column sid new_val SID
ops$tkyte%ORA11GR2> select sid from v$mystat where rownum = 1;

       SID
----------
       133

ops$tkyte%ORA11GR2> alter session set workarea_size_policy=manual;

Session altered.

ops$tkyte%ORA11GR2> alter session set sort_area_size = &1;
old   1: alter session set sort_area_size = &1
new   1: alter session set sort_area_size = 65536

Session altered.

ops$tkyte%ORA11GR2> prompt run @reset_stat &SID and @watch_stat in another session here!
run @reset_stat        133 and @watch_stat in another session here!
ops$tkyte%ORA11GR2> pause
We can see the SID of this new session (133), and we've set our PGA memory management to manual and our SORT_AREA_SIZE to 65,536 (64KB). Now the script tells us to run the two other scripts in another session, so we'll do that:
ops$tkyte%ORA11GR2> @reset_stat 133
Table dropped.

Table created.

PL/SQL procedure successfully completed.

ops$tkyte%ORA11GR2> @watch_stat

6 rows merged.


NAME                                          KBYTES_WRITES DIFF_KBYTES_WRITES
--------------------------------------------- ------------- ------------------
physical reads direct temporary tablespace                0                  0
physical writes direct temporary tablespace               0                  0
session pga memory                                      673
session pga memory max                                  673
session uga memory                                      300
session uga memory max                                  300

6 rows selected.
Note
The watch_stat script must be run in the same session as the reset_stat script; reset_stat sets the :sid bind variable necessary for the MERGE statement. Alternatively, you can execute exec :sid := <sid>, where <sid> is the SID you observe in your testing.
So, before we begin we can see that we have about 300KB of data in the UGA and 673KB of data in the PGA. The first question is, "How much memory are we using between the PGA and UGA?" That is, are we using 300KB + 673KB of memory, or are we using some other amount? This is a trick question, and one that you can't answer unless you know whether the monitored session with SID 133 was connected to the database via a dedicated server or a shared server—and even then it might be hard to figure out. In dedicated server mode, the UGA is totally contained within the PGA, in which case we would be consuming 673KB of memory in our process or thread. In shared server mode, the UGA is allocated from the SGA, and the PGA is in the shared server. So, in shared server mode, by the time we get the last row from the preceding query, the shared server process may be in use by someone else. That PGA isn't "ours" anymore, so technically we are using 300KB of memory (except when we are actually running the query, at which point we are using 973KB of memory between the combined PGA and UGA). In this case, I used a dedicated server (it would be impossible to do the test accurately otherwise) and we are using a grand total of 673KB of memory in the combined PGA and UGA. So, let's now run the first big query in session 133, which is using manual PGA memory management in dedicated server mode. We just have to go back to that session where we ran run_query.sql and hit enter to start the query running:
Note
Since we haven't set a SORT_AREA_RETAINED_SIZE, its reported value will be zero, but its used value will match SORT_AREA_SIZE.
ops$tkyte%ORA11GR2> set termout off
ops$tkyte%ORA11GR2> prompt run @watch_stat in another session here!
run @watch_stat in another session here!
ops$tkyte%ORA11GR2> pause
The point where you see set termout off is the point where the large query is executing, we told SQL*plus to run the query but not print on the screen (it would take a while for over 70,000 lines to be printed). Now if we run our watch_stat.sql script again in the second session, we'll see something like the following:
ops$tkyte%ORA11GR2> @watch_stat

6 rows merged.


NAME                                          KBYTES_WRITES DIFF_KBYTES_WRITES
--------------------------------------------- ------------- ------------------
physical reads direct temporary tablespace             3120               3120
physical writes direct temporary tablespace            3120               3120
session pga memory                                      737                 64
session pga memory max                                  801                128
session uga memory                                      364                 64
session uga memory max                                  364                 64
6 rows selected.
Notice this time that the session xxx memory and session xxx memory max values don't match. The session xxx memory value represents how much memory we are using right now. The session xxx memory max value represents the peak value we used at some time during our session while processing the query.
Note
In these examples, I wouldn't expect that you'd see exactly the same numbers I've printed here. The amount of memory used is affected by many things, such as Oracle version, the operating system and its features and capabilities, the amount of data placed into the table T, and so on. You should expect variations in memory amounts, but the overall picture will be the same.
As you can see, our memory usage went up—we've done some sorting of data. Our UGA increased from 300KB to 364KB (64KB) during the processing of our query. To perform our query and the sorting, Oracle allocated a sort area for our session. Additionally, the PGA memory went from 673KB to 737KB. Also, we can see that we did 3,120 writes and reads to and from temp (since the data we sorted could not have fit into 64KB, our SORT_AREA_SIZE).
By the time we finish our query and exhaust the resultset, we can see that our PGA has shrunk somewhat (note that in Oracle8i and before, you wouldn't expect to see the PGA shrink back at all; this is a new feature with Oracle9i and later).
Let's retry that operation but play around with the size of our SORT_AREA_SIZE by increasing it to 1MB. We'll log out of the session we're monitoring and log back in, following the directions to increase our SORT_AREA_SIZE to 1MB. Remember that in the other session we are monitoring from, you must run the reset_stat.sql script to start over. As the beginning numbers are consistent (the output of the first watch_stat.sql should be the same in a new session), I don't display them here—only the final results:
NAME                                          KBYTES_WRITES DIFF_KBYTES_WRITES
--------------------------------------------- ------------- ------------------
physical reads direct temporary tablespace             1057               1057
physical writes direct temporary tablespace            1057               1057
session pga memory                                      609                −64
session pga memory max                                 2017               1344
session uga memory                                      300                  0
session uga memory max                                 1329               1029

6 rows selected.
As you can see, our PGA has grown considerably this time during the processing of our query. It temporarily grew by about 1,300KB (a little more than 1MB, our SORT_AREA_SIZE), but the amount of physical I/O we had to do to sort this data dropped considerably as well (use more memory, swap to disk less often). We may have avoided a multipass sort as well, a condition that happens when there are so many little sets of sorted data to merge together that Oracle ends up writing the data to temp more than once. Now, let's go to an extreme here and use a 1GB SORT_AREA_SIZE:
NAME                                          KBYTES_WRITES DIFF_KBYTES_WRITES
--------------------------------------------- ------------- ------------------
physical reads direct temporary tablespace                0                  0
physical writes direct temporary tablespace               0                  0
session pga memory                                      609                −64
session pga memory max                                 9825               9152
session uga memory                                      300                  0
session uga memory max                                 9449               9149

6 rows selected.
We can observe that even though we allowed for up to 1GB of memory to the SORT_AREA_SIZE, we really only used about 9MB. This shows that the SORT_AREA_SIZE setting is an upper bound, not the default and only allocation size. Notice also that we did only one sort again, but this time it was entirely in memory; there was no temporary space on disk used, as evidenced by the lack of physical I/O.
If you run this same test on various versions of Oracle, or perhaps even on different operating systems, you might see different behavior, and I would expect that your numbers in all cases would be a little different from mine. But the general behavior should be the same. In other words, as you increase the permitted sort area size and perform large sorts, the amount of memory used by your session will increase. You might notice the PGA memory going up and down, or it might remain constant over time, as just shown. For example, if you were to execute the previous test in Oracle8i, I'm sure you'd notice that PGA memory does not shrink back in size (i.e., the SESSION PGA MEMORY equals the SESSION PGA MEMORY MAX in all cases). This is to be expected, as the PGA is managed as a heap in 8i releases and is created via malloc()-ed memory. In 9hi and above, new methods attach and release work areas as needed using operating system-specific memory allocation calls.
Here are the important things to remember about using the *_AREA_SIZE parameters:
These parameters control the maximum amount of memory used by a
SORT, HASH, or BITMAP MERGEoperation.A single query may have many operations taking place that use this memory, and multiple sort/hash areas could be created. Remember that you may have many cursors opened simultaneously, each with its own
SORT_AREA_RETAINEDneeds. So, if you set the sort area size to 10MB, you could use 10, 100, 1,000 or more megabytes of RAM in your session. These settings are not session limits; rather, they are limits on a single operation, and your session could have many sorts in a single query or many queries open that require a sort.The memory for these areas is allocated on an "as needed" basis. If you set the sort area size to 1GB as we did, it doesn't mean you'll allocate 1GB of RAM. It only means that you've given the Oracle process the permission to allocate that much memory for a sort/hash operation.
Starting with Oracle9i Release 1, a new way to manage PGA memory was introduced that avoids using the SORT_AREA_SIZE, BITMAP_MERGE_AREA_SIZE, and HASH_AREA_SIZE parameters. It was introduced to address a few issues:
Ease of use: Much confusion surrounded how to set the proper
*_AREA_SIZEparameters. There was also much confusion over how those parameters actually worked and how memory was allocated.Manual allocation was a "one-size-fits-all" method: Typically, as the number of users running similar applications against a database went up, the amount of memory used for sorting and hashing went up linearly as well. If 10 concurrent users with a sort area size of 1MB used 10MB of memory, 100 concurrent users would probably use 100MB, 1,000 would probably use 1000MB, and so on. Unless the DBA was sitting at the console continually adjusting the sort/hash area size settings, everyone would pretty much use the same values all day long. Consider the previous example, where you saw for yourself how the physical I/O to temp decreased as the amount of RAM we allowed ourselves to use went up. If you run that example for yourself, you will almost certainly see a decrease in response time as the amount of RAM available for sorting increases. Manual allocation fixes the amount of memory to be used for sorting at a more or less constant number, regardless of how much memory is actually available. Automatic memory management allows us to use the memory when it is available; it dynamically adjusts the amount of memory we use based on the workload.
Memory control: As a result of the previous point, it was hard, if not impossible, to keep the Oracle instance inside a "box" memory-wise. You couldn't control the amount of memory the instance was going to use, as you had no real control over the number of simultaneous sorts and hashes taking place. It was far too easy to attempt to use more real memory (actual physical free memory) than was available on the machine.
Enter automatic PGA memory management. Here, you first simply set up and size the SGA. The SGA is a fixed-size piece of memory so you can very accurately see how big it is, and that will be its total size (unless and until you change it). You then tell Oracle, "This is how much memory you should try to limit yourself to across all work areas" (a new umbrella term for the sorting and hashing areas you use). Now, you could in theory take a machine with 2GB of physical memory and allocate 768MB of memory to the SGA and 768MB of memory to the PGA, leaving 512MB of memory for the OS and other processes. I say "in theory" because it doesn't work exactly that cleanly, but it's close. Before I discuss why that's true, let's take a look at how to set up automatic PGA memory management and turn it on.
The process of setting this up involves deciding on the proper values for two instance initialization parameters:
WORKAREA_SIZE_POLICY: This parameter may be set to eitherMANUAL, which will use the sort area and hash area size parameters to control the amount of memory allocated, orAUTO, in which case the amount of memory allocated will vary based on the current workload in the database. The default and recommended value isAUTO.PGA_AGGREGATE_TARGET: This parameter controls how much memory the instance should allocate, in total, for all work areas used to sort or hash data. Its default value varies by version and may be set by various tools such as the DBCA. In general, if you are using automatic PGA memory management, you should explicitly set this parameter.
Note
In Oracle 11g Release 1 and above, instead of setting the PGA_AGGREGATE_TARGET, you can set the MEMORY_TARGET parameter. When the database uses the MEMORY_TARGET parameter, it decides how much memory to allocate to the SGA and PGA respectively. It may also decide to reallocate these memory amounts while the database is up and running. This fact, however, doesn't affect how automatic PGA memory management (described below) works; rather it just decides the setting for the PGA_AGGREGATE_TARGET.
So, assuming that WORKAREA_SIZE_POLICY is set to AUTO and PGA_AGGREGATE_TARGET has a nonzero value, you will be using the new (as of Oracle 9i) automatic PGA memory management. You can "turn it on" in your session via the ALTER SESSION command or at the system level via the ALTER SYSTEM command.
Note
Bear in mind the previous caveat that in Oracle9i, shared server connections will not use automatic memory management; rather, they will use the SORT_AREA_SIZE and HASH_AREA_SIZE parameters to decide how much RAM to allocate for various operations. In Oracle 10g and up, automatic PGA memory management is available to both connection types. It is important to properly set the SORT_AREA_SIZE and HASH_AREA_SIZE parameters when using shared server connections with Oracle9i.
So, the entire goal of automatic PGA memory management is to maximize the use of RAM while at the same time not using more RAM than you want. Under manual memory management, this was a virtually impossible goal to achieve. If you set SORT_AREA_SIZE to 10MB, when one user was performing a sort operation that user would use up to 10MB for the sort work area. If 100 users were doing the same, they would use up to 1,000MB of memory. If you had 500MB of free memory, the single user performing a sort by himself could have used much more memory, and the 100 users should have used much less. That is what automatic PGA memory management was designed to do. Under a light workload, memory usage could be maximized as the load increases on the system, and as more users perform sort or hash operations, the amount of memory allocated to them would decrease—to reach the goal of using all available RAM, but not attempting to use more than physically exists.
Questions that come up frequently are "How is this memory allocated?" and "What will be the amount of RAM used by my session?" These are hard questions to answer for the simple reason that the algorithms for serving out memory under the automatic scheme are not documented and can and will change from release to release. When using things that begin with "A"—for automatic—you lose a degree of control, as the underlying algorithms decide what to do and how to control things.
We can make some observations based on information from MetaLink note 147806.1:
The
PGA_AGGREGATE_TARGETis a goal of an upper limit. It is not a value that is pre-allocated when the database is started up. You can observe this by setting thePGA_AGGREGATE_TARGETto a value much higher than the amount of physical memory you have available on your server. You will not see any large allocation of memory as a result.A serial (nonparallel query) session will use a small percentage of the
PGA_AGGREGATE_TARGET, typically about 5 percent or less. So, if you've set thePGA_AGGREGATE_TARGETto 100MB, you'd expect to use no more than about 5MB per work area (e.g., the sort or hash work area). You may well have multiple work areas in your session for multiple queries, or more than one sort or hash operation in a single query, but each work area will be about 5 percent or less of thePGA_AGGREGATE_TARGET. Note that this 5 percent is not a hard and fast rule; things change over time, the automatic algorithms can and will change in the database.As the workload on your server goes up (more concurrent queries, concurrent users), the amount of PGA memory allocated to your work areas will go down. The database will try to keep the sum of all PGA allocations under the threshold set by
PGA_AGGREGATE_TARGET. This is analogous to having a DBA sit at a console all day, setting theSORT_AREA_SIZEandHASH_AREA_SIZEparameters based on the amount of work being performed in the database. We will directly observe this behavior shortly in a test.A parallel query may use up to about 30 percent of the
PGA_AGGREGATE_TARGET, with each parallel process getting its slice of that 30 percent. That is, each parallel process would be able to use about 0.3 *PGA_AGGREGATE_TARGET/ (number of parallel processes).
OK, so how can we observe the different work area sizes being allocated to our session? By applying the same technique we used earlier in the manual memory management section to observe the memory used by our session and the amount of I/O to temp we performed. I performed the following test on a Red Hat Advanced Server 4.0 Linux machine using Oracle 11.2.0.1 and dedicated server connections. This was a two-CPU Dell PowerEdge with hyperthreading enabled, so it was as if there were four CPUs available. We begin by creating a table to hold the metrics we'd like to monitor:
create table sess_stats
as
select name, value, 0 active
  from
(
select a.name, b.value
  from v$statname a, v$sesstat b
 where a.statistic# = b.statistic#
   and b.sid = (select sid from v$mystat where rownum=1)
   and (a.name like '%ga %'
        or a.name like '%direct temp%')
 union all
select 'total: ' || a.name, sum(b.value)
  from v$statname a, v$sesstat b, v$session c
 where a.statistic# = b.statistic#
   and (a.name like '%ga %'
        or a.name like '%direct temp%')
   and b.sid = c.sid
   and c.username is not null
 group by 'total: ' || a.name
);
The columns in this table we'll be using for the metrics represent:
NAME: the name of the statistic we are gathering (PGAandUGAinformation fromV$SESSTATfor the current session, plus all of the memory information for the database instance as well as temporary tablespace writes).VALUE: the value of the given metric.ACTIVE: the number of other sessions doing work in the database. Before we start, we assume an "idle" database; we are the only user session right now, hence the value of zero.
I then ran the following SQL*Plus script in an interactive session. The table T had been created beforehand (above) with about 70,000 rows in it.
connect /
set echo on
declare
    l_first_time boolean default true;
begin
    for x in ( select * from t order by 1, 2, 3, 4 )
    loop
        if ( l_first_time )
        then
            insert into sess_stats
            ( name, value, active )
            select name, value,
                  (select count(*)
                     from v$session
                    where status = 'ACTIVE'
                      and username is not null)
              from
            (
            select a.name, b.value
              from v$statname a, v$sesstat b
             where a.statistic# = b.statistic#
               and b.sid = (select sid from v$mystat where rownum=1)
               and (a.name like '%ga %'
                    or a.name like '%direct temp%')
             union all
            select 'total: ' || a.name, sum(b.value)
              from v$statname a, v$sesstat b, v$session c
             where a.statistic# = b.statistic#
               and (a.name like '%ga %'
                    or a.name like '%direct temp%')
               and b.sid = c.sid
               and c.username is not null
             group by 'total: ' || a.name
            );
            l_first_time := false;
        end if;
    end loop;
end;
/
commit;
This script sorts the big table T using PGA automatic memory management. Then, for that session, it captures all of the PGA/UGA memory settings as well as sort-to-disk activity. In addition, the UNION ALL adds system-level metrics about the same (total PGA memory, total UGA memory and so on). I ran that script against a database started with the following initialization settings:
*.compatible='11.2.0.0.0'
*.control_files='/home/ora11gr2/app/ora11gr2/oradata/orcl/control01.ctl','/home/ora11gr2/app/ora11gr2/flash_recovery_area/orcl/control02.ctl'
*.db_block_size=8192
*.db_name='orcl'
*.db_recovery_file_dest='/home/ora11gr2/app/ora11gr2/flash_recovery_area'
*.db_recovery_file_dest_size=4039114752
*.diagnostic_dest='/home/ora11gr2/app/ora11gr2'
*.pga_aggregate_target=256m
*.sga_target=256m
*.open_cursors=300
*.processes=600
*.remote_login_passwordfile='EXCLUSIVE'
*.resource_limit=TRUE
*.undo_tablespace='UNDOTBS1'
These settings show I was using automatic PGA memory management with a PGA_AGGREGATE_TARGET of 256MB, meaning I wanted Oracle to use up to about 256MB of PGA memory for sorting.
I set up another script to be run in other sessions to generate a large sorting load on the machine. This script loops and uses a built-in package, DBMS_ALERT, to see if it should continue processing. If it should, it runs the same big query, sorting the entire T table. When the simulation finished, a session could signal all of the sorting processes, the load generators, to "stop" and exit. Here's the script used to perform the sort:
declare
    l_msg   long;
    l_status number;
begin
    dbms_alert.register( 'WAITING' );
    for i in 1 .. 999999 loop
        dbms_application_info.set_client_info( i );
        dbms_alert.waitone( 'WAITING', l_msg, l_status, 0 );
        exit when l_status = 0;
        for x in ( select * from t order by 1, 2, 3, 4 )
        loop
            null;
        end loop;
    end loop;
end;
/
Exit
and here's the script to stop these processes from running:
begin
    dbms_alert.signal( 'WAITING', '' );
    commit;
end;
To observe the differing amounts of RAM allocated to the session I was measuring, I initially ran the SELECT in isolation—as the only session. I captured the statistics and saved them into the SESS_STATS table, along with the count of active sessions. Then I added 25 sessions to the system (i.e., I ran the preceding benchmark script with the for i in 1 .. 999999 loop in 25 new sessions). I waited a short period of time—one minute for the system to adjust to this new load—and then I created a new session and ran the single sort query from above, capturing of the metrics the first time through the loop. I did this repeatedly, for up to 500 concurrent users.
It should be noted that I asked the database instance to do an impossible thing here. As mentioned previously, based on the first time we ran watch_stat.sql, each connection to Oracle—before even doing a single sort—consumed a little more than .5MB of RAM. At 500 users, we would be very close to the PGA_AGGREGATE_TARGET setting just by having them all logged in, let alone actually doing any work! This drives home the point that the PGA_AGGREGATE_TARGET is just that: a target, not a directive. We can and will exceed this value for various reasons.
Now we are ready to report on the finding; for reasons of space, we'll stop the output at 250 users—since the data starts to get quite repetitive:
ops$tkyte%ORA11GR2> column active format 999
ops$tkyte%ORA11GR2> column pga format 999.9
ops$tkyte%ORA11GR2> column "tot PGA" format 999.9
ops$tkyte%ORA11GR2> column pga_diff format 999.99
ops$tkyte%ORA11GR2> column "temp write" format 9,999
ops$tkyte%ORA11GR2> column "tot writes temp" format 99,999,999
ops$tkyte%ORA11GR2> column writes_diff format 9,999,999
ops$tkyte%ORA11GR2> select active,
  2         pga,
  3         "tot PGA",
  4         "tot PGA"-lag( "tot PGA" ) over (order by active) pga_diff,
  5         "temp write",
  6         "tot writes temp",
  7         "tot writes temp"-lag( "tot writes temp" ) over (order by active) writes_diff
  8    from (
  9  select *
 10    from (
 11  select active,
 12         name,
 13         case when name like '%ga mem%' then round(value/1024/1024,1) else value end val
 14    from sess_stats
 15   where active < 275
 16         )
 17   pivot ( max(val) for name in  (
 18              'session pga memory' as "PGA",
 19              'total: session pga memory' as "tot PGA",
 20              'physical writes direct temporary tablespace' as "temp write",
 21              'total: physical writes direct temporary tablespace' as "tot writes temp"
 22              ) )
 23         )
 24   order by active
 25  /

ACTIVE    PGA tot PGA PGA_DIFF temp write tot writes temp WRITES_DIFF
------ ------ ------- -------- ---------- --------------- -----------
     0    2.0     6.2                   0           6,658
     1   11.4    15.6     9.40          0           6,658           0
    26    9.7   103.0    87.40          0         115,179     108,521
    51    1.2   164.3    61.30      1,055         345,960     230,781
    76    2.8   196.2    31.90      1,057         588,922     242,962
   102    1.2   177.8   −18.40      1,715         727,835     138,913
   127    1.1   171.3    −6.50      3,699       1,206,949     479,114
   151    1.0   191.9    20.60      5,724       1,864,445     657,496
   177    1.0   216.9    25.00      6,677       2,736,554     872,109
   201    1.0   255.7    38.80      6,686       3,994,030   1,257,476
   227    1.0   286.9    31.20      6,683       5,723,449   1,729,419
   253    1.0   304.0    17.10      6,669       7,992,572   2,269,123

10 rows selected.
Before we analyze the results, let's look at the query I used for reporting. My query uses a new Oracle Database 11g Release 1 and above feature called pivot to pivot a resultset. Here's an alternate way to write lines 11 through 22 of that SQL query that would work in 10g Release 2 and before:
11  select active,
 12         max( decode(name,'session pga memory',val) ) pga,
 13         max( decode(name,'total: session pga memory',val) ) as "tot PGA",
 14         max( decode(name,
                'physical writes direct temporary tablespace',
                 val) ) as "temp write",
 15         max( decode(name,
                'total: physical writes direct temporary tablespace',
                 val) ) as "tot writes temp"
 16    from (
 17  select active,
 18         name,
 19         case when name like '%ga mem%' then round(value/1024/1024,1) else value end val
 20    from sess_stats
 21   where active < 275
 22         )
 23   group by active
 24         )
This part of the query retrieved the records from the table of metrics when there were less than 225 active sessions, converted the metrics for memory (UGA/PGA memory) from bytes into megabytes, and then pivoted—turned rows into columns—on the four interesting metrics. Once we got those four metrics in a single record, we used analytics (the LAG() function specifically) to add to each row the prior rows' total observed PGA and total observed IO to temp so we could easily see the incremental differences in these values.
Back to the data—as you can see, when I had a few active sessions, my sorts were performed entirely in memory. For an active session count of 1 to somewhere less than 50, I could sort entirely in memory. However, by the time I had 50 users logged in and actively sorting, the database started reining in the amount of memory I was allowed to use at a time. It would have taken a couple of minutes before the amount of PGA being used fell back within acceptable limits (the 256MB request), but eventually it would at these low concurrent user levels. The amount of PGA memory allocated to the session we were watching dropped from 11.4MB to 9.7MB to 1.2MB (and popped back up a bit and then went back down again), and eventually went down to around 1.1 to 1.0MB (remember, parts of that PGA are not for sorting, but are for other operations; just the act of logging in created a .5MB PGA allocation). The total PGA in use by the system remained within tolerable limits until somewhere around 225 users. At that point, I started to exceed on a regular basis the PGA_AGGREGATE_TARGET, and continued to do so until the end of the test. I gave the database instance in this case an impossible task; the very act of having 250 users, most executing PL/SQL, plus the sort they were all requesting, just did not fit into the 256MB of RAM I had targeted. It simply could not be done. Each session therefore used as little memory as possible, but had to allocate as much memory as it needed. By the time I finished this test, 250 active sessions were using a total of 304MB of PGA memory—as little as they could.
You should, however, consider what that output would look like under a manual memory management situation. Suppose the SORT_AREA_SIZE had been set to 5MB. The math is very straightforward: each session would be able to perform the sort in RAM (or virtual memory as the machine ran out of real RAM), and thus would consume 6 to 7MB of RAM per session (the amount used without sorting to disk in the previous single-user case). The memory use would look something like this:
ops$tkyte%ORA11GR2> column total_pga format 9,999
ops$tkyte%ORA11GR2> with data(users)
  2  as
  3  (select 1 users from dual
  4   union all
  5   select users+25 from data where users+25 <= 275)
  6  select users, 7 my_pga, 7*users total_pga
  7    from data
  8   order by users
  9  /

     USERS     MY_PGA TOTAL_PGA
---------- ---------- ---------
         1          7         7
        26          7       182
        51          7       357
        76          7       532
       101          7       707
       126          7       882
       151          7     1,057
       176          7     1,232
       201          7     1,407
       226          7     1,582
       251          7     1,757

11 rows selected.
Note
This query uses a new technique—recursive subquery factoring—that is available only in Oracle Database 11g Release 2 and above. It will not work in earlier releases.
Had I run this test (I have 2GB of real memory on this server and my SGA is 256MB), by the time I got to 250 users, the machine would have begun paging and swapping to the point where it would have been impossible to continue; at 500 users I would have allocated around 3,514MB of RAM! So, the DBA would probably not set the SORT_AREA_SIZE to 5MB on this system, but rather to about 0.5 MB, in an attempt to keep the maximum PGA usage at a bearable level at peak. At 500 users, I would have had about 500MB of PGA allocated, perhaps similar to what we observed with automatic memory management, but even when there were fewer users, we would still have written to temp rather than performing the sort in memory.
Manual memory management represents a very predictable—but suboptimal—use of memory as the workload increases or decreases over time. Automatic PGA memory management was designed specifically to allow a small community of users to use as much RAM as possible when it was available, to back off on this allocation over time as the load increased, and increase the amount of RAM allocated for individual operations over time as the load decreased.
Earlier, I wrote that "in theory" we can use the PGA_AGGREGATE_TARGET to control the overall amount of PGA memory used by the instance. We saw in the last example that this is not a hard limit, however. The instance will attempt to stay within the bounds of the PGA_AGGREGATE_TARGET, but if it can't, it won't stop processing; rather, it will just be forced to exceed that threshold.
Another reason this limit is "theory" is because work areas, though large contributors to PGA memory, are not the only contributors to PGA memory. Many factors contribute to PGA memory allocation and only the work areas are under the control of the database instance. If you create and execute a PL/SQL block of code that fills in a large array with data in dedicated server mode where the UGA is in the PGA, Oracle can't do anything but allow you to do it.
Consider the following quick example. We'll create a package that can hold some persistent (global) data in the server:
ops$tkyte%ORA11GR2> create or replace package demo_pkg
  2  as
  3          type array is table of char(2000) index by binary_integer;
  4          g_data array;
  5  end;
  6  /
Package created.
Now we'll measure the amount of memory our session is currently using in the PGA/UGA (I used a dedicated server in this example, so the UGA is a subset of the PGA memory):
ops$tkyte%ORA11GR2> select a.name, to_char(b.value, '999,999,999') bytes,
  2         to_char(round(b.value/1024/1024,1), '99,999.9' ) mbytes
  3    from v$statname a, v$mystat b
  4   where a.statistic# = b.statistic#
  5     and a.name like '%ga memory%';

NAME                           BYTES        MBYTES
------------------------------ ------------ ---------
session uga memory                1,367,116       1.3
session uga memory max            1,367,116       1.3
session pga memory                1,868,392       1.8
session pga memory max            1,868,392       1.8
Initially we are using about 1.8MB of PGA memory in our session (as a result of compiling a PL/SQL package, running this query, etc.). Now, we'll run our query against T again using the same 256MB PGA_AGGREGATE_TARGET (this was done in an otherwise idle instance; we are the only session requiring memory right now):
ops$tkyte%ORA11GR2> set autotrace traceonly statistics;
ops$tkyte%ORA11GR2> select * from t order by 1,2,3,4;

71917 rows selected.


Statistics
----------------------------------------------------------
          0  recursive calls
          0  db block gets
1031 consistent gets
0 physical reads
0 redo size
4078637 bytes sent via SQL*Net to client
53154 bytes received via SQL*Net from client
4796 SQL*Net roundtrips to/from client
1 sorts (memory)
0 sorts (disk)
71917 rows processed
ops$tkyte%ORA11GR2> set autotrace offAs you can see, the sort was done entirely in memory, and in fact if we peek at our session's PGA/UGA usage, we can see how much we used:
ops$tkyte%ORA11GR2> select a.name, to_char(b.value, '999,999,999') bytes,
  2         to_char(round(b.value/1024/1024,1), '99,999.9' ) mbytes
  3    from v$statname a, v$mystat b
  4   where a.statistic# = b.statistic#
  5     and a.name like '%ga memory%';

NAME                           BYTES        MBYTES
------------------------------ ------------ ---------
session uga memory                1,367,116       1.3
session uga memory max            9,674,632       9.2
session pga memory                1,802,856       1.7
session pga memory max           10,257,000       9.8
We see the same 9-10MB of RAM we observed earlier in the prior test for sorting. Now we'll fill up that CHAR array we have in the package (a CHAR datatype is blank-padded so each of these array elements is exactly 2,000 characters in length):
ops$tkyte%ORA11GR2> begin
  2          for i in 1 .. 200000
  3          loop
  4                  demo_pkg.g_data(i) := 'x';
  5          end loop;
  6  end;
  7  /

PL/SQL procedure successfully completed.
If we then measure our session's current PGA utilization, we find something similar to the following:
ops$tkyte%ORA11GR2> select a.name, to_char(b.value, '999,999,999') bytes,
  2         to_char(round(b.value/1024/1024,1), '99,999.9' ) mbytes
  3    from v$statname a, v$mystat b
  4   where a.statistic# = b.statistic#
  5     and a.name like '%ga memory%';

NAME                           BYTES        MBYTES
------------------------------ ------------ ---------
session uga memory              469,319,332     447.6
session uga memory max          469,319,332     447.6
session pga memory              470,188,648     448.4
session pga memory max          470,188,648     448.4
Now, that is memory allocated in the PGA that the database itself can't control. We already exceeded the PGA_AGGREGATE_TARGET set for the entire system in this single session— and there is quite simply nothing the database can do about it. It would have to fail our request if it did anything, and it will do that only when the OS reports back that there is no more memory to give. If we wanted, we could allocate more space in that array and place more data in it, and the database would just have to do it for us.
However, the database is aware of what we have done. It does not ignore the memory it can't control; it simply recognizes that the memory is being used and backs off the size of memory allocated for work areas accordingly. So if we rerun the same sort query, we see that this time we sorted to disk—the database did not give us the 9MB or so of RAM needed to do this in memory since we had already exceeded the PGA_AGGREGATE_TARGET:
ops$tkyte%ORA11GR2> set autotrace traceonly statistics;
ops$tkyte%ORA11GR2> select * from t order by 1,2,3,4;

71917 rows selected.


Statistics
----------------------------------------------------------
          9  recursive calls
          7  db block gets
       1031  consistent gets
       1055  physical reads
          0  redo size
    4078637  bytes sent via SQL*Net to client
      53154  bytes received via SQL*Net from client
       4796  SQL*Net roundtrips to/from client
          0  sorts (memory)
          1  sorts (disk)
      71917  rows processed

ops$tkyte%ORA11GR2> set autotrace off
So, because some PGA memory is outside of Oracle's control, it is easy to exceed the PGA_AGGREGATE_TARGET simply by allocating lots of really large data structures in our PL/SQL code. I am not recommending you do this by any means. I'm just pointing out that the PGA_AGGREGATE_TARGET is more of a request than a hard limit.
So, which method should you use, manual or automatic? My preference is to use the automatic PGA memory management by default.
Warning
I'll repeat this from time to time in this book: please do not make any changes to a production system—a live system—without first testing for any side effects. For example, please do not read this chapter, check your system and find you are using manual memory management—and then just turn on automatic memory management. Query plans may change, and performance may be impacted. One of three things could happen:
Things run exactly the same.
Things run better than they did before.
Things run much worse than they did before.
Exercise caution before making changes; test the proposed change first.
One of the most perplexing things for a DBA can be setting the individual parameters, especially parameters such as SORT|HASH_AREA_SIZE and so on. I often see systems running with incredibly small values for these parameters—values so small that system performance is massively impacted in a negative way. This is probably a result of the fact that the default values are very small themselves: 64KB for sorting and 128KB for hashing. There's a lot of confusion over how big or small these values should be. Not only that, but the values you should use for them might vary over time, as the day goes by. At 8:00 am, with two users, a 50MB sort area size might be reasonable for the two users logged in. However, at 12:00 pm with 500 users, 50MB might not be appropriate. This is where the WORKAREA_SIZE_POLICY = AUTO setting and the corresponding PGA_AGGREGATE_TARGET come in handy. Setting the PGA_AGGREGATE_TARGET, the amount of memory you would like Oracle to feel free to use to sort and hash, is conceptually easier than trying to figure out the perfect SORT|HASH_AREA_SIZE, especially since there isn't a perfect value for these parameters; the perfect value varies by workload.
Historically, DBAs configured the amount of memory Oracle would use by setting the size of the SGA (the buffer cache; the log buffer; and the shared, large, and Java pools). The remaining memory on the machine would then be used by the dedicated or shared servers in the PGA region. The DBA had little control over how much of this memory would or would not be used. She could set the SORT_AREA_SIZE, but if there were 10 concurrent sorts, Oracle could use as much as 10 * SORT_AREA_SIZE bytes of RAM. If there were 100 concurrent sorts, Oracle would use 100 * SORT_AREA_SIZE bytes; for 1,000 concurrent sorts, 1,000 * SORT_AREA_SIZE; and so on. Couple that with the fact that other things go into the PGA, and you really didn't have good control over the maximal use of PGA memory on the system.
What you'd like to happen is for this memory to be allocated differently as the memory demands on the system grow and shrink. The more users, the less RAM each should use. The fewer users, the more RAM each should use. Setting WORKAREA_SIZE_POLICY = AUTO is just the way to achieve this. The DBA specifies a single size now, the PGA_AGGREGATE_TARGET or the maximum amount of PGA memory that the database should strive to use. Oracle then distributes this memory over the active sessions as it sees fit. Further, with Oracle9i Release 2 and up, there is even a PGA advisory (part of statspack and AWR, available via a V$ dynamic performance view and visible in Enterprise Manager), much like the buffer cache advisor. It will tell you over time what the optimal PGA_AGGREGATE_TARGET for your system is to minimize physical I/O to your temporary tablespaces. You can use this information to either dynamically change the PGA size online (if you have sufficient RAM) or decide whether you need more RAM on your server to achieve optimal performance.
Are there times, however, when you won't want to use it? Absolutely, but fortunately they seem to be the exception and not the rule. The automatic memory management was designed to be multiuser "fair." In anticipation of additional users joining the system, the automatic memory management will limit the amount of memory allocated as a percentage of the PGA_AGGREGATE_TARGET. But what happens when you don't want to be fair, when you know that you should get all of the memory available? Well, that would be time to use the ALTER SESSION command to disable automatic memory management in your session (leaving it in place for all others) and to manually set your SORT|HASH_AREA_SIZE as needed. For example, that large batch process that takes place at 2:00 am and does tremendously large hash joins, some index builds, and the like? It should be permitted to use all of the resources on the machine. It does not want to be "fair" about memory use—it wants it all, as it knows it is the only thing happening in the database right now. That batch job can certainly issue the ALTER SESSION command and make use of all resources available.
So, in short, I prefer to use automatic PGA memory management for end-user sessions—for the applications that run day to day against my database. Manual memory management makes sense for large batch jobs that run during periods when they are the only activities in the database.
So far, we have looked at two memory structures: the PGA and the UGA. You should understand now that the PGA is private to a process. It is the set of variables that an Oracle dedicated or shared server needs to have independent of a session. The PGA is a "heap" of memory in which other structures may be allocated. The UGA is also a heap of memory in which various session-specific structures may be defined. The UGA is allocated from the PGA when you use a dedicated server to connect to Oracle, and from the SGA under a shared server connection. This implies that when using a shared server, you must size your SGA's large pool to have enough space to cater to every possible user that will ever connect to your database concurrently. So, the SGA of a database supporting shared server connections is generally much larger than the SGA for a similarly configured dedicated server mode-only database. We'll cover the SGA in more detail next.
Every Oracle instance has one big memory structure referred to as the System Global Area (SGA). This is a large, shared memory structure that every Oracle process will access at one point or another. It varies in size from a few megabytes on small test systems, to hundreds of megabytes on medium-to-large systems, up to many gigabytes for really big systems.
On UNIX, the SGA is a physical entity you can "see" from the OS command line. It is physically implemented as a shared memory segment—a standalone piece of memory to which processes may attach. It is possible to have an SGA on a system without having any Oracle processes; the memory stands alone. It should be noted, however, that if you have an SGA without any Oracle processes, this is an indication that the database crashed in some fashion. It is an unusual situation, but it can happen. This is what an SGA "looks like" on Red Hat Linux:
$ ipcs -m | grep ora
0xbba344b8 1540099    ora11gr2  660        270532608  26
0x39381320 1179655    ora10gr2  660        538968064  16
0x6b08d4e8 491529     ora11gr1  640        270532608  21
0x0d998a20 557067     ora9ir2   660        253755392  8
0xe5b0179c 622604     ora10gr1  660        610271232  15
Note
I have five instances on my test/demo machine. This is highly unusual. I needed five instances to test the various concepts presented in this book on different releases. The only reasonable, correct number of instances on a production machine is one. In real life, never have more than one instance on a given production server. If you need more than one instance on a physical server, you should use virtualization to split that one server into many virtual servers—each with its own instance of Oracle.
Five SGAs are represented here and the report shows the OS account that owns the SGA (ora11gr2 for the first one, for example) and the size of the SGA—258MB for the first example. On Windows, you really can't see the SGA as a distinct entity the way you can in UNIX/Linux. Because on the Windows platform Oracle executes as a single process with a single address space, the SGA is allocated as private memory to the oracle.exe process. If you use the Windows Task Manager or some other performance tool, you can see how much memory oracle.exe has allocated, but you can't see what is the SGA versus any other piece of allocated memory.
Note
Unless you have my parameter settings and you are running my exact same version of Oracle on my exact same OS, you will almost certainly see different numbers than I do. The SGA sizing is very version/OS/parameter-dependent.
Within Oracle itself, you can see the SGA regardless of platform, using another magic V$ view called V$SGASTAT. It might look as follows:
ops$tkyte%ORA11GR2> compute sum of bytes on pool
ops$tkyte%ORA11GR2> break on pool skip 1
ops$tkyte%ORA11GR2>
ops$tkyte%ORA11GR2> select pool, name, bytes
  2    from v$sgastat
  3   order by pool, name;

POOL         NAME                                BYTES
------------ ------------------------------ ----------
java pool    free memory                       4194304
************                                ----------
sum                                            4194304

large pool   PX msg pool                       3894304
             free memory                        300000
************                                ----------
sum                                            4194304

shared pool  1:kngisga                           16052
             ADR_CONTROL                          1056
             ADR_INVALIDATION                      464
             AQ Propagation Scheduling           16000
             ASH buffers                       5368712
..
xsoqsehift 2404
xssinfo 5560
************ ----------
sum 159388244
buffer_cache 92274688
fixed_sga 1335924
log_buffer 6438912
************ ----------
sum 100049524
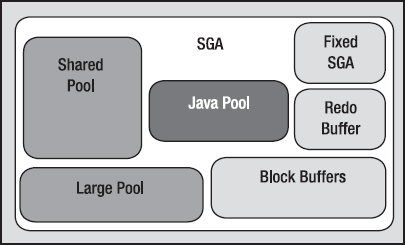
863 rows selected.The SGA is broken up into various pools. Here are the major ones you'll see:
Java pool: The Java pool is a fixed amount of memory allocated for the JVM running in the database. In Oracle10g, the Java pool may be resized online while the database is up and running.
Large pool: The large pool is used by shared server connections for session memory, by parallel execution features for message buffers, and by RMAN backup for disk I/O buffers. This pool is resizable online.
Shared pool: The shared pool contains shared cursors, stored procedures, state objects, dictionary caches, and many dozens of other bits of data. This pool is resizable online in both Oracle 10g and 9i.
Streams pool: This is a pool of memory used exclusively by Oracle Streams, a data-sharing tool within the database. This pool is new in Oracle 10g and is resizable online. If the Streams pool is not configured and you use the Streams functionality, Oracle will use up to 10 percent of the shared pool for streams memory.
The "Null" pool: This one doesn't really have a name. It is the memory dedicated to block buffers (cached database blocks), the redo log buffer, and a "fixed SGA" area.
A typical SGA might look as shown in Figure 4-1.
The parameters that have the greatest effect on the overall size of the SGA are as follows:
JAVA_POOL_SIZE: Controls the size of the Java pool.SHARED_POOL_SIZE: Controls the size of the shared pool (to some degree).LARGE_POOL_SIZE: Controls the size of the large pool.DB_*_CACHE_SIZE: Eight of thesecache_sizeparameters control the sizes of the various buffer caches available.LOG_BUFFER: Controls the size of the redo buffer (to some degree).SGA_TARGET: Used with automatic SGA memory management in Oracle 10g and above.SGA_MAX_SIZE: Used to control the maximum size to which the SGA can be resized while the database is up and running.MEMORY_TARGET: Used with automatic memory management (both PGA and SGA automatic memory management).MEMORY_MAX_SIZE: Used to control the maximum amount of memory Oracle should strive to use over both the PGA and SGA sizes under automatic memory management. This is really just a target; the PGA may exceed the optimum size if the number of users increases beyond some level or a session(s) allocates large untunable bits of memory as demonstrated above.
In Oracle9i, the various SGA components must be manually sized by the DBA. Starting in Oracle 10g and above, however, there is a new option to consider: automatic SGA memory management, whereby the database instance will allocate and reallocate the various SGA components at runtime in response to workload conditions. Moreover, starting in Oracle 11g, there's another new option: automatic memory management, whereby the database instance will not only perform automatic SGA memory management and automatic PGA memory management, it will also decide the optimum size of the SGA and PGA for you—reallocating these allotments automatically when deemed reasonable. Using the automatic SGA memory management with Oracle 10g and above is simply a matter of setting the SGA_TARGET parameter to the desired SGA size, leaving out the other SGA-related parameters altogether. The database instance will take it from there, allocating memory to the various pools as needed and even taking memory away from one pool to give to another over time. When using automatic memory management with Oracle 11g and above, you simply set the MEMORY_TARGET. The database instance will then decide the optimal SGA size and PGA size—and those components will be set up appropriately and do their own automatic memory management within their respective boundaries. Further, the database can and will resize the SGA and PGA allocations as the workload changes over time.
Regardless of whether you are using automatic or manual memory management, you'll find that memory is allocated to the various pools in the SGA in units called granules. A single granule is an area of memory of 4MB, 8MB, or 16MB in size. The granule is the smallest unit of allocation, so if you ask for a Java pool of 5MB and your granule size is 4MB, Oracle will actually allocate 8MB to the Java pool (8 being the smallest number greater than or equal to 5 that is a multiple of the granule size of 4). The size of a granule is determined by the size of your SGA (this sounds recursive to a degree, as the size of the SGA is dependent on the granule size). You can view the granule sizes used for each pool by querying V$SGA_DYNAMIC_COMPONENTS. In fact, we can use this view to see how the total SGA size might affect the size of the granules:
ops$tkyte%ORA11GR2> show parameter sga_target

NAME                                 TYPE        VALUE
------------------------------------ ----------- ------------------------------
sga_target                           big integer 256M
ops$tkyte%ORA11GR2> select component, granule_size from v$sga_dynamic_components;

COMPONENT                                                        GRANULE_SIZE
---------------------------------------------------------------- ------------
shared pool                                                           4194304
large pool                                                            4194304
java pool                                                             4194304
streams pool                                                          4194304
DEFAULT buffer cache                                                  4194304
KEEP buffer cache                                                     4194304
RECYCLE buffer cache                                                  4194304
DEFAULT 2K buffer cache                                               4194304
DEFAULT 4K buffer cache                                               4194304
DEFAULT 8K buffer cache                                               4194304
DEFAULT 16K buffer cache                                              4194304
DEFAULT 32K buffer cache                                              4194304
Shared IO Pool                                                        4194304
ASM Buffer Cache                                                      4194304

14 rows selected.
Note
This is the SGA information for the Oracle instance started with the initialization parameter file in the previous example. We specified the SGA and PGA sizes ourselves in that parameter file. Therefore we are using automatic SGA memory management and automatic PGA memory management, but not the new in Oracle 11g "memory management" setting, which would have sized and resized our PGA/SGA settings for us.
In this example, I used automatic SGA memory management and controlled the size of the SGA via the single parameter SGA_TARGET. When my SGA size is under about 1GB, the granule is 4MB. When the SGA size is increased to some threshold over 1GB (it will vary slightly from operating system to operating system and even from release to release), I see an increased granule size. First we convert to using a stored parameter file to make altering the SGA_TARGET easier:
sys%ORA11GR2> create spfile from pfile;
File created.


sys%ORA11GR2> startup force;
ORACLE instance started.

Total System Global Area  267825152 bytes
Fixed Size                  1335924 bytes
Variable Size             130026892 bytes
Database Buffers          130023424 bytes
Redo Buffers                6438912 bytes
Database mounted.
Database opened.
Then we modify the SGA_TARGET:
sys%ORA11GR2> alter system set sga_target = 1512m scope=spfile;

System altered.

sys%ORA11GR2> startup force
ORACLE instance started.

Total System Global Area 1590267904 bytes
Fixed Size                  1336792 bytes
Variable Size             218106408 bytes
Database Buffers         1358954496 bytes
Redo Buffers               11870208 bytes
Database mounted.
Database opened.
sys%ORA11GR2> show parameter sga_target

NAME                                 TYPE        VALUE
------------------------------------ ----------- ------------------------------
sga_target                           big integer 1520M
Now when we look at the SGA components:
sys%ORA11GR2> select component, granule_size from v$sga_dynamic_components;

COMPONENT                                                        GRANULE_SIZE
---------------------------------------------------------------- ------------
shared pool                                                          16777216
large pool                                                           16777216
java pool                                                            16777216
streams pool                                                         16777216
DEFAULT buffer cache                                                 16777216
KEEP buffer cache                                                    16777216
RECYCLE buffer cache                                                 16777216
DEFAULT 2K buffer cache                                              16777216
DEFAULT 4K buffer cache                                              16777216
DEFAULT 8K buffer cache                                              16777216
DEFAULT 16K buffer cache                                             16777216
DEFAULT 32K buffer cache                                             16777216
Shared IO Pool                                                       16777216
ASM Buffer Cache                                                     16777216

14 rows selected.
As you can see, at 1.5GB of SGA, my pools will be allocated using 16MB granules, so any given pool size will be some multiple of 16MB.
With this in mind, let's look at each of the major SGA components in turn.
The fixed SGA is a component of the SGA that varies in size from platform to platform and from release to release. It is "compiled" into the Oracle binary itself at installation time (hence the name "fixed"). The fixed SGA contains a set of variables that point to the other components of the SGA, as well as variables that contain the values of various parameters. The size of the fixed SGA is something over which we have no control, and it is generally very small. Think of this area as a "bootstrap" section of the SGA—something Oracle uses internally to find the other bits and pieces of the SGA.
The redo buffer is where data that needs to be written to the online redo logs will be cached temporarily, before it is written to disk. Since a memory-to-memory transfer is much faster than a memory-to-disk transfer, use of the redo log buffer can speed up database operation. The data will not reside in the redo buffer for very long. In fact, LGWR initiates a flush of this area in one of the following scenarios:
Every three seconds
Whenever someone commits
When
LGWRis asked to switch log filesWhen the redo buffer gets one-third full or contains 1MB of cached redo log data
For these reasons, it will be a very rare system that will benefit from a redo buffer of more than a couple of tens of megabytes in size. A large system with lots of concurrent transactions might benefit somewhat from large redo log buffers because while LGWR (the process responsible for flushing the redo log buffer to disk) is writing a portion of the log buffer, other sessions could be filling it up. In general, a long-running transaction that generates a lot of redo log will benefit the most from a larger than normal log buffer, as it will be continuously filling up part of the redo log buffer while LGWR is busy writing out some of it (we'll cover this phenomenon of writing uncommitted data to the datafiles at length in Chapter 9 "Redo and Undo"). The larger and longer the transaction, the more benefit it could receive from a generous log buffer.
The default size of the redo buffer, as controlled by the LOG_BUFFER parameter, varies widely by operating system, database version, and other parameter settings. Rather than try to explain what the most common default size is (there isn't such a thing), I'll refer you to the documentation for your release of Oracle (the Reference Guide). My default LOG_BUFFER—given the instance we just started above with a 1.5GB SGA—is shown by the following query:
ops$tkyte%ORA11GR2> select value, isdefault
  2  from v$parameter
  3  where name = 'log_buffer'
  4  /

VALUE                ISDEFAULT
-------------------- ---------
11583488             TRUE
The size is about 11MB. The minimum size of the default log buffer is OS-dependent. If you'd like to find out what that is, just set your LOG_BUFFER to 1 byte and restart your database. For example, on my Red Hat Linux instance I see the following:
ops$tkyte%ORA11GR2> alter system set log_buffer=1 scope=spfile;
System altered.

ops$tkyte%ORA11GR2> connect / as sysdba;
Connected.
sys%ORA11GR2> startup force;
ORACLE instance started.

Total System Global Area 1590267904 bytes
Fixed Size                  1336792 bytes
Variable Size             234883624 bytes
Database Buffers         1342177280 bytes
Redo Buffers               11870208 bytes
Database mounted.
Database opened.
sys%ORA11GR2> show parameter log_buffer

NAME                                 TYPE        VALUE
------------------------------------ ----------- ------------------------------
log_buffer                           integer     1703936

sys%ORA11GR2> select 1703936/1024/1024 from dual;

1703936/1024/1024
-----------------
            1.625
The smallest log buffer I can really have, regardless of my settings, is going to be 1.625MB on this system.
So far, we have looked at relatively small components of the SGA. Now we are going to look at one that is potentially huge in size. The block buffer cache is where Oracle stores database blocks before writing them to disk and after reading them in from disk. This is a crucial area of the SGA for us. Make it too small and our queries will take forever to run. Make it too big and we'll starve other processes (e.g., we won't leave enough room for a dedicated server to create its PGA, and we won't even get started).
In earlier releases of Oracle, there was a single block buffer cache, and all blocks from any segment went into this single area. Starting with Oracle 8.0, we had three places to store cached blocks from individual segments in the SGA:
Default pool: The location where all segment blocks are normally cached. This is the original—and, previously, the only—buffer pool.
Keep pool: An alternate buffer pool where by convention you assign segments that are accessed fairly frequently, but still get aged out of the default buffer pool due to other segments needing space.
Recycle pool: An alternate buffer pool where by convention you assign large segments that you access very randomly, and which would therefore cause excessive buffer flushing of many blocks from many segments. There's no benefit to caching such segments because by the time you wanted the block again, it would have been aged out of the cache. You would separate these segments out from the segments in the default and keep pools so they would not cause those blocks to age out of the cache.
Note that in the keep and recycle pool descriptions I used the phrase "by convention." There is nothing in place to ensure that you use either the keep pool or the recycle pool in the fashion described. In fact, the three pools manage blocks in a mostly identical fashion; they do not have radically different algorithms for aging or caching blocks. The goal here was to give the DBA the ability to segregate segments to hot, warm, and "do not care to cache" areas. The theory was that objects in the default pool would be hot enough (i.e., used enough) to warrant staying in the cache all by themselves. The cache would keep them in memory since they were very popular blocks. If you had some segments that were fairly popular but not really hot, these would be considered the warm blocks. These segments' blocks could get flushed from the cache to make room for blocks you used infrequently (the "do not care to cache" blocks). To keep these warm segments' blocks cached, you could do one of the following:
Assign these segments to the keep pool, in an attempt to let the warm blocks stay in the buffer cache longer.
Assign the "do not care to cache" segments to the recycle pool, keeping the recycle pool fairly small so as to let the blocks come into the cache and leave the cache rapidly (decrease the overhead of managing them all).
Having to do one of these two things increased the management work the DBA had to perform, as there were three caches to think about, size, and assign objects to. Remember also that there is no sharing among them, so if the keep pool has lots of unused space, it won't give it to the overworked default or recycle pool. All in all, these pools were generally regarded as a very fine, low-level tuning device, only to be used after most other tuning alternatives had been looked at (if I could rewrite a query to do one-tenth the I/O rather then set up multiple buffer pools, that would be my choice!).
Starting in Oracle9i, the DBA had up to four more optional caches, the db_Nk_caches, to consider in addition to the default, keep, and recycle pools. These caches were added in support of multiple blocksizes in the database. Prior to Oracle9i, a database would have a single blocksize (typically 2KB, 4KB, 8KB, 16KB, or 32KB). Starting with Oracle9i, however, a database can have a default blocksize, which is the size of the blocks stored in the default, keep, or recycle pool, as well as up to four nondefault blocksizes, as explained in Chapter 3 "Files".
The blocks in these buffer caches are managed in the same way as the blocks in the original default pool—there are no special algorithm changes for them either. Let's now move on to see how the blocks are managed in these pools.
For simplicity, assume that there's just a single default pool. Because the other pools are managed in the same way, we need only discuss one of them.
The blocks in the buffer cache are basically managed in a single place with two different lists pointing at them:
The list of dirty blocks that need to be written by the database block writer (
DBWn; we'll take a look at that process a little later)A list of nondirty blocks
The list of nondirty blocks used to be a Least Recently Used (LRU) list in Oracle 8.0 and before. Blocks were listed in order of use. The algorithm has been modified slightly in Oracle8i and in later versions. Instead of maintaining the list of blocks in some physical order, Oracle employs a touch count algorithm, which effectively increments a counter associated with a block as you hit it in the cache. This count is not incremented every time you hit the block, but about once every three seconds if you hit it continuously. You can see this algorithm at work in one of the truly magic sets of tables: the X$ tables. The X$ tables are wholly undocumented by Oracle, but information about them leaks out from time to time.
Note
I am using a user connected as SYSDBA in the following examples, because the X$ tables are by default visible only to that account. You shouldn't in practice use the SYSDBA account to run queries. The need to query for information about blocks in the buffer cache is a rare exception to that rule.
The X$BH table shows information about the blocks in the block buffer cache (which offers more information than the documented V$BH view). Here, we can see the touch count get incremented as we hit blocks. We can run the following query against that view to find the five "currently hottest blocks" and join that information to the DBA_OBJECTS view to see what segments they belong to. The query orders the rows in X$BH by the TCH (touch count) column and keeps the first five. Then we join the X$BH information to DBA_OBJECTS by X$BH.OBJ to DBA_OBJECTS.DATA_OBJECT_ID:
sys%ORA11GR2> select tch, file#, dbablk,
  2        case when obj = 4294967295
  3             then 'rbs/compat segment'
  4             else (select max( '('||object_type||') ' ||
  5                               owner || '.' || object_name  ) ||
  6                          decode( count(*), 1, '', ' maybe!' )
  7                     from dba_objects
  8                    where data_object_id = X.OBJ )
  9         end what
 10   from (
 11  select tch, file#, dbablk, obj
 12    from x$bh
 13   where state <> 0
 14   order by tch desc
 15        ) x
 16  where rownum <= 5
 17  /

       TCH      FILE#     DBABLK WHAT
---------- ---------- ---------- ------------------------------
        65          1       2009 (TABLE) SYS.JOB$
        65          1       2008 (TABLE) SYS.JOB$
        11          1        345 (INDEX) SYS.I_OBJ2
        11          1        337 (INDEX) SYS.I_OBJ1
        10          1      44528 (INDEX) SYS.I_OBJ2
Note
The (2^32 − 1) or 4,294,967,295 referred to in the CASE statement is a magic number used to denote "special" blocks. If you'd like to understand what the underlying block in that instance is associated with, use the query select * from dba_extents where file_id = <FILE#> and block_id <= <DBABLK> and block_id+blocks-1 >= <DBABLK>.
You might be asking what is meant by the 'maybe!' and the use of MAX() in the preceding scalar subquery. This is due to the fact that DATA_OBJECT_ID is not a "primary key" in the DBA_OBJECTS view, as evidenced by the following:
sys%ORA11GR2> select data_object_id, count(*)
  2    from dba_objects
  3   where data_object_id is not null
  4   group by data_object_id
  5  having count(*) > 1;

DATA_OBJECT_ID   COUNT(*)
-------------- ----------
            29          3
             6          3
         73317          2
             2         18
         73350          2
             8          3
           633          3
           664          3
         73314          2
         73318          2
           267          2
           420          2
           503          7
            10          3
             0          4

15 rows selected.
This is due to clusters (discussed in Chapter 10 on Tables), which may contain multiple tables. Therefore, when joining from X$BH to DBA_OBJECTS to print out a segment name, we would technically have to list all of the names of all of the objects in the cluster, as a database block does not belong to a single table all of the time.
We can even watch as Oracle increments the touch count on a block that we query repeatedly. We will use the magic table DUAL in this example—we know it is a one row, one column table.
Note
Prior to Oracle 10g, querying DUAL would incur a full table scan of a real table named DUAL stored in the data dictionary. If you set autotrace on and query SELECT DUMMY FROM DUAL, you'll observe some I/O in all releases of Oracle (consistent gets). In 9i and earlier, if you query SELECT SYSDATE FROM DUAL or variable := SYSDATE in PL/SQL, you'll also see real I/O occur. However, in Oracle 10g, that SELECT SYSDATE is recognized as not needing to actually query the DUAL table (since you are not asking for the column or rowid from DUAL) and is done in a manner similar to calling a function. Therefore DUAL does not undergo a full table scan—only SYSDATE is returned to the application. This small change can dramatically decrease the number of consistent gets a system that uses DUAL heavily performs.
So every time we run the following query, we should be hitting the real DUAL table (since we explicitly reference the DUMMY column):
sys%ORA11GR2> select tch, file#, dbablk, DUMMY
  2    from x$bh, (select dummy from dual)
  3   where obj = (select data_object_id
  4                  from dba_objects
  5                 where object_name = 'DUAL'
  6                   and data_object_id is not null)
  7  /

       TCH      FILE#     DBABLK D
---------- ---------- ---------- -
         1          1        929 X
         2          1        928 X

sys%ORA11GR2> exec dbms_lock.sleep(3.2);

PL/SQL procedure successfully completed.

sys%ORA11GR2> /

       TCH      FILE#     DBABLK D
---------- ---------- ---------- -
         2          1        929 X
         3          1        928 X

sys%ORA11GR2> exec dbms_lock.sleep(3.2);

PL/SQL procedure successfully completed.

sys%ORA11GR2> /

       TCH      FILE#     DBABLK D
---------- ---------- ---------- -
         3          1        929 X
         4          1        928 X
sys%ORA11GR2> exec dbms_lock.sleep(3.2);
PL/SQL procedure successfully completed.
sys%ORA11GR2> /
TCH FILE# DBABLK D
---------- ---------- ---------- -
4 1 929 X
5 1 928 XI expect output to vary by Oracle release; you may well see more than two rows returned. You might observe TCH not getting incremented every time. On a multiuser system, the results will be even more unpredictable. Oracle will attempt to increment the TCH once every three seconds (there is a TIM column that shows the last update time to the TCH column), but it is not considered important that the number be 100 percent accurate, as it is close. Also, Oracle will intentionally "cool" blocks and decrement the TCH count over time. So, if you run this query on your system, be prepared to see potentially different results.
So, in Oracle8i and above, a block buffer no longer moves to the head of the list as it used to; rather, it stays where it is in the list and has its touch count incremented. Blocks will naturally tend to "move" in the list over time, however. I put the word "move" in quotes because the block doesn't physically move; rather, multiple lists are maintained that point to the blocks and the block will "move" from list to list. For example, modified blocks are pointed to by a dirty list (to be written to disk by DBWn). Also, as they are reused over time, when the buffer cache is effectively full, and some block with a small touch count is freed, it will be "placed" into approximately the middle of the list with the new data block.
The whole algorithm used to manage these lists is fairly complex and changes subtly from release to release of Oracle as improvements are made. The actual full details are not relevant to us as developers, beyond the fact that heavily used blocks will be cached, and blocks that are not used heavily will not be cached for long.
Note
If you've been following along, running the examples in your database, take this opportunity to log out of the SYSDBA account and get back in with your own account!
Starting in Oracle9i, you can have multiple database blocksizes in the same database. Previously, all blocks in a single database were the same size and in order to have a different blocksize, you had to rebuild the entire database. Now you can have a mixture of the "default" blocksize (the blocksize you used when you initially created the database; the size that is used for the SYSTEM and all TEMPORARY tablespaces) and up to four other blocksizes. Each unique blocksize must have its own buffer cache area. The default, keep, and recycle pools will only cache blocks of the default size. In order to have a nondefault blocksize in your database, you need to have configured a buffer pool to hold them.
In this example, my default blocksize is 8KB. I will attempt to create a tablespace with a 16KB blocksize:
ops$tkyte%ORA11GR2> create tablespace ts_16k
  2  datafile '/tmp/ts_16k.dbf'
  3  size 5m
  4  blocksize 16k;
create tablespace ts_16k
*
ERROR at line 1:
ORA-29339: tablespace block size 16384 does not match configured block sizes


ops$tkyte%ORA11GR2> show parameter 16k

NAME                                 TYPE        VALUE
------------------------------------ ----------- ------------------------------
db_16k_cache_size                    big integer 0
Right now, since I have not configured a 16KB cache, I can't create such a tablespace. I could do one of a couple of things right now to rectify this situation. I could set the db_16k_cache_size parameter and restart the database. I could shrink one of my other SGA components in order to make room for a 16KB cache in the existing SGA. Or, I might be able to just allocate a 16KB cache if the SGA_MAX_SIZE parameter was larger than my current SGA size.
Note
Starting in Oracle9i, you can resize various SGA components while the database is up and running. If you want to be able to "grow" the size of the SGA beyond its initial allocation, you must have set the SGA_MAX_SIZE parameter to some value larger than the allocated SGA. For example, if after startup your SGA size was 128MB and you wanted to add an additional 64MB to the buffer cache, you would have had to set the SGA_MAX_SIZE to 192MB or larger to allow for the growth.
In this example, I will set the db_16k_cache_size and restart, since I'm using automatic SGA memory management and don 't wish to set any of the other caches manually:
ops$tkyte%ORA11GR2> alter system set sga_target = 256m scope=spfile;

System altered.

ops$tkyte%ORA11GR2> alter system set db_16k_cache_size = 16m scope=spfile;

System altered.

ops$tkyte%ORA11GR2> connect / as sysdba
Connected.
sys%ORA11GR2> startup force
ORACLE instance started.

Total System Global Area  267825152 bytes
Fixed Size                  1335924 bytes
Variable Size             134221196 bytes
Database Buffers          130023424 bytes
Redo Buffers                2244608 bytes
Database mounted.
Database opened.
sys%ORA11GR2> show parameter 16k

NAME                                 TYPE        VALUE
------------------------------------ ----------- ------------------------------
db_16k_cache_size                    big integer 16M
So, now I have another buffer cache set up: one to cache any blocks that are 16KB in size. The default pool will consume the rest of the buffer cache space, as you can see by querying V$SGASTAT. These two caches are mutually exclusive; if one "fills up," it can't use space in the other. This gives the DBA a very fine degree of control over memory use, but it comes at a price. That price is complexity and management. These multiple blocksizes were not intended as a performance or tuning feature (if you need multiple caches, you have the default, keep and recycle pools already!), but rather came about in support of transportable tablespaces—the ability to take formatted data files from one database and transport or attach them to another database. They were implemented in order to take datafiles from a transactional system that was using an 8KB blocksize and transport that information to a data warehouse using a 16KB or 32KB blocksize.
The multiple blocksizes do serve a good purpose, however, in testing theories. If you want to see how your database would operate with a different blocksize—how much space, for example, a certain table would consume if you used a 4KB block instead of an 8KB block—you can now test that easily without having to create an entirely new database instance.
You may also be able to use multiple blocksizes as a very finely focused tuning tool for a specific set of segments, by giving them their own private buffer pools. Or, in a hybrid system, transactional users could use one set of data and reporting/warehouse users could query a separate set of data. The transactional data would benefit from the smaller blocksizes due to less contention on the blocks (less data/rows per block means fewer people in general would go after the same block at the same time) as well as better buffer cache utilization (users read into the cache only the data they are interested in—the single row or small set of rows). The reporting/warehouse data, which might be based on the transactional data, would benefit from the larger blocksizes due in part to less block overhead (it takes less storage overall) and larger logical I/O sizes perhaps. And since reporting/warehouse data does not have the same update contention issues, the fact that there are more rows per block is not a concern but a benefit. Moreover, the transactional users get their own buffer cache in effect; they don't have to worry about the reporting queries overrunning their cache.
But in general, the default, keep, and recycle pools should be sufficient for fine-tuning the block buffer cache, and multiple blocksizes would be used primarily for transporting data from database to database and perhaps for a hybrid reporting/transactional system.
The shared pool is one of the most critical pieces of memory in the SGA, especially with regard to performance and scalability. A shared pool that is too small can kill performance to the point that the system appears to hang. A shared pool that is too large can have the same effect. A shared pool that is used incorrectly will be a disaster as well.
What exactly is the shared pool? The shared pool is where Oracle caches many bits of "program" data. When we parse a query, the parsed representation is cached there. Before we go through the job of parsing an entire query, Oracle searches the shared pool to see if the work has already been done. PL/SQL code that you run is cached in the shared pool, so the next time you run it, Oracle doesn't have to read it in from disk again. PL/SQL code is not only cached here, it is shared here as well. If you have 1,000 sessions all executing the same code, only one copy of the code is loaded and shared among all sessions. Oracle stores the system parameters in the shared pool. The data dictionary cache (cached information about database objects) is stored here. In short, everything but the kitchen sink is stored in the shared pool.
The shared pool is characterized by lots of small (generally 4KB or less) chunks of memory. Bear in mind that 4KB is not a hard limit. There will be allocations that exceed that size, but in general the goal is to use small chunks of memory to prevent the fragmentation that would occur if memory chunks were allocated in radically different sizes, from very small to very large. The memory in the shared pool is managed on an LRU basis. It is similar to the buffer cache in that respect—if you don't use it, you'll lose it. A supplied package called DBMS_SHARED_POOL may be used to change this behavior—to forcibly pin objects in the shared pool. You can use this procedure to load up your frequently used procedures and packages at database startup time, and make it so they are not subject to aging out. Normally, though, if over time a piece of memory in the shared pool is not reused, it will become subject to aging out. Even PL/SQL code, which can be rather large, is managed in a paging mechanism so that when you execute code in a very large package, only the code that is needed is loaded into the shared pool in small chunks. If you don't use it for an extended period of time, it will be aged out if the shared pool fills up and space is needed for other objects.
The easiest way to break Oracle's shared pool is to not use bind variables. As you saw in Chapter 1 "Developing Successful Oracle Applications," not using bind variables can bring a system to its knees for two reasons:
The system spends an exorbitant amount of CPU time parsing queries.
The system uses large amounts of resources managing the objects in the shared pool as a result of never reusing queries.
If every query submitted to Oracle is a unique query with the values hard-coded, the concept of the shared pool is substantially defeated. The shared pool was designed so that query plans would be used over and over again. If every query is a brand-new, never-before-seen query, then caching only adds overhead. The shared pool becomes something that inhibits performance. A common but misguided technique that many use to try to solve this issue is adding more space to the shared pool, which typically only makes things worse than before. As the shared pool inevitably fills up once again, it gets to be even more of an overhead than the smaller shared pool, for the simple reason that managing a big, full shared pool takes more work than managing a smaller, full shared pool.
The only true solution to this problem is to use shared SQL to reuse queries. Earlier, in Chapter 1, we briefly looked at the parameter CURSOR_SHARING, which can work as a short-term crutch in this area. The only real way to solve this issue, however, is to use reusable SQL in the first place. Even on the largest of large systems, I find that there are typically at most 10,000 to 20,000 unique SQL statements. Most systems execute only a few hundred unique queries.
The following real-world example demonstrates just how bad things can get if you use the shared pool poorly. I was asked to work on a system where the standard operating procedure was to shut down the database every night, to wipe out the SGA and restart it clean. The reason for doing this was that the system was having issues during the day whereby it was totally CPU-bound and, if the database were left to run for more than a day, performance really started to decline. They were using a 1GB shared pool inside of a 1.1GB SGA. This is true: 0.1GB dedicated to block buffer cache and other elements and 1GB dedicated to caching unique queries that would never be executed again. The reason for the cold start was that if they left the system running for more than a day, they would run out of free memory in the shared pool. At that point, the overhead of aging structures out (especially from a structure so large) was such that it overwhelmed the system and performance was massively degraded (not that performance was that great anyway, since they were managing a 1GB shared pool). Furthermore, the people working on this system constantly wanted to add more and more CPUs to the machine, as hard-parsing SQL is so CPU-intensive. By correcting the application and allowing it to use bind variables, not only did the physical machine requirements drop (they then had many times more CPU power than they needed), but also the allocation of memory to the various pools was reversed. Instead of a 1GB shared pool, they had less than 100MB allocated—and they never used it all over many weeks of continuous uptime.
One last comment about the shared pool and the parameter SHARED_POOL_SIZE. In Oracle9i and before, there is no direct relationship between the outcome of the query
ops$tkyte@ORA9IR2> select sum(bytes) from v$sgastat where pool = 'shared pool';
SUM(BYTES)
----------
 100663296
and the SHARED_POOL_SIZE parameter
ops$tkyte@ORA9IR2> show parameter shared_pool_size
NAME                                 TYPE        VALUE
------------------------------------ ----------- ------------------------------
shared_pool_size                     big integer 83886080
other than the fact that the SUM(BYTES) FROM V$SGASTAT will always be larger than the SHARED_POOL_SIZE. The shared pool holds many other structures that are outside the scope of the corresponding parameter. The SHARED_POOL_SIZE is typically the largest contributor to the shared pool as reported by the SUM(BYTES), but it is not the only contributor. For example, the parameter CONTROL_FILES contributes 264 bytes per file to the "miscellaneous" section of the shared pool. It is unfortunate that the "shared pool" in V$SGASTAT and the parameter SHARED_POOL_SIZE are named as they are, since the parameter contributes to the size of the shared pool, but it is not the only contributor.
In Oracle 10g and above, however, you should see a one-to-one correspondence between the two, assuming you are using manual SGA memory management (i.e., you have set the shared_pool_size parameter yourself):
ops$tkyte@ORA10G> select sum(bytes)/1024/1024 mbytes
  2  from v$sgastat where pool = 'shared pool';

    MBYTES
----------
       128

ops$tkyte@ORA10G> show parameter shared_pool_size;

NAME                                 TYPE        VALUE
------------------------------------ ----------- ------------------------------
shared_pool_size                     big integer 128M
Note
I was using manual memory management in this example!
This is a relatively important change as you go from Oracle9i and before to 10g. In Oracle 10g, the SHARED_POOL_SIZE parameter controls the size of the shared pool, whereas in Oracle9i and before, it was just the largest contributor to the shared pool. You should review your 9i and before actual shared pool size (based on V$SGASTAT) and use that figure to set your SHARED_POOL_SIZE parameter in Oracle 10g and above. The various other components that used to add to the size of the shared pool now expect you to allocate that memory for them.
The large pool is not so named because it is a "large" structure (although it may very well be large in size). It is so named because it is used for allocations of large pieces of memory that are bigger than the shared pool is designed to handle.
Prior to the introduction of the large pool in Oracle 8.0, all memory allocation took place in the shared pool. This was unfortunate if you were using features that made use of "large" memory allocations, such as shared server UGA memory allocations. This issue was further confounded by the fact that processing, which tended to need a lot of memory allocation, would use the memory in a manner different from the way the shared pool managed it. The shared pool manages memory on an LRU basis, which is perfect for caching and reusing data. Large memory allocations, however, tend to get a chunk of memory, use it, and then be done with it. There was no need to cache this memory.
What Oracle needed was something similar to the recycle and keep buffer pools implemented for the block buffer cache, and that's exactly what the large pool and shared pool are now. The large pool is a recycle-style memory space, whereas the shared pool is more like the keep buffer pool—if people appear to be using something frequently, then you keep it cached.
Memory allocated in the large pool is managed in a heap, much in the way C manages memory via malloc() and free(). As soon as you "free" a chunk of memory, it can be used by other processes. In the shared pool, there really was no concept of freeing a chunk of memory. You would allocate memory, use it, and then stop using it. After a while, if that memory needed to be reused, Oracle would age out your chunk of memory. The problem with using only a shared pool is that one size doesn't always fit all.
The large pool is used specifically by:
Shared server connections, to allocate the UGA region in the SGA.
Parallel execution of statements, to allow for the allocation of interprocess message buffers, which are used to coordinate the parallel query servers.
Backup for RMAN disk I/O buffers in some cases.
As you can see, none of these memory allocations should be managed in an LRU buffer pool designed to manage small chunks of memory. With shared server connection memory, for example, once a session logs out, this memory is never going to be reused so it should be immediately returned to the pool. Also, shared server UGA memory allocation tends to be "large." If you review the earlier examples with the SORT_AREA_RETAINED_SIZE or PGA_AGGREGATE_TARGET, you'll remember that the UGA can grow very large and is definitely bigger than 4KB chunks. Putting shared server memory into the shared pool causes it to fragment into odd-sized pieces and, furthermore, you will find that large pieces of memory that will never be reused will age out memory that could be reused. This forces the database to do more work to rebuild that memory structure later.
The same is true for parallel query message buffers, since they are not LRU-manageable. They are allocated and can't be freed until they are done being used. Once they have delivered their message, they are no longer needed and should be released immediately. With backup buffers, this applies to an even greater extent—they are large, and once Oracle is done using them, they should just "disappear."
The large pool is not mandatory when using shared server connections, but it is highly recommended. If you don't have a large pool and use a shared server connection, the allocations come out of the shared pool as they always did in Oracle 7.3 and before. This will definitely lead to degraded performance over some period of time and should be avoided. The large pool will default to some size if the parameter DBWR_IO_SLAVES or PARALLEL_MAX_SERVERS is set to some positive value. You should set the size of the large pool manually if you are using a feature that employs it. The default mechanism is typically not the appropriate value for your situation.
The Java pool was added in version 8.1.5 of Oracle to support running Java in the database. If you code a stored procedure in Java, Oracle will use this chunk of memory when processing that code. The parameter JAVA_POOL_SIZE is used to fix the amount of memory allocated to the Java pool for all session-specific Java code and data.
The Java pool is used in different ways, depending on the mode in which the Oracle server is running. In dedicated server mode, the Java pool includes the shared part of each Java class, which is actually used per session. These are basically the read-only parts (execution vectors, methods, etc.) and are about 4KB to 8KB per class. Thus, in dedicated server mode the total memory required for the Java pool is quite modest and can be determined based on the number of Java classes you'll be using. Note that none of the per-session state is stored in the SGA in dedicated server mode, as this information is stored in the UGA and, as you will recall, the UGA is included in the PGA in dedicated server mode.
When connecting to Oracle using a shared server connection, the Java pool includes both of the following:
The shared part of each Java class.
Some of the UGA used for per-session state of each session, which is allocated from the JAVA_POOL within the SGA. The remainder of the UGA will be located as usual in the shared pool, or if the large pool is configured, it will be located there instead.
As the total size of the Java pool is fixed in Oracle9i and before, application developers will need to estimate the total requirement of their applications and multiply this estimate by the number of concurrent sessions they need to support. This number will dictate the overall size of the Java pool. Each Java UGA will grow or shrink as needed, but bear in mind that the pool must be sized such that all UGAs combined can fit in it at the same time. In Oracle 10g and above, this parameter may be modified, and the Java pool may grow and shrink over time without the database being restarted.
The Streams pool is a new SGA structure starting in Oracle 10g. Streams itself is a new database feature as of Oracle9i Release 2 and above. It was designed as a data sharing/replication tool and is one of Oracle's stated directions going forward for data replication.
Note
The statement that Streams "is one of Oracle's stated directions going forward for data replication" should not be interpreted as meaning that Advanced Replication, Oracle's now legacy replication feature, is going away anytime soon. Rather, Advanced Replication will continue to be supported in future releases. To learn more about Streams itself, see the "Streams Concepts Guide" at http://otn.oracle.com in the documentation section.
The Streams pool (or up to 10 percent of the shared pool if no Streams pool is configured) is used to buffer queue messages used by the Streams process as it moves or copies data from one database to another. Instead of using permanent disk-based queues, with their attendant overhead, Streams uses in-memory queues. If these queues fill up, they eventually spill over to disk. If the Oracle instance with the memory queue fails for some reason, due to an instance failure (software crash), power failure, or whatever, these in-memory queues are rebuilt from the redo logs.
So, the Streams pool will only be important in systems using the Streams database feature. In those environments, it should be set in order to avoid "stealing" 10 percent of the shared pool for this feature.
Just as there are two ways to manage PGA memory, there are two ways to manage SGA memory starting in Oracle 10g and above: manually by setting all of the necessary pool and cache parameters, and automatically by setting just a few memory parameters and a single SGA_TARGET parameter. By setting the SGA_TARGET parameter, you are allowing the instance to size and resize various SGA components.
Note
In Oracle9i and before, only manual SGA memory management was available—the parameter SGA_TARGET did not exist and the parameter SGA_MAX_SIZE was a limit, not a dynamic target.
In Oracle 10g and above, memory-related parameters are classified into one of two areas:
Auto-tuned SGA parameters: Currently these are
db_cache_size, shared_pool_size, large_pool_size, andjava_pool_size.Manual SGA parameters: These include
log_buffer, streams_pool, db_Nk_cache_size, db_keep_cache_size, anddb_recycle_cache_size.
At any time in Oracle 10g and above, you may query V$SGAINFO to see which components of the SGA are resizable:
ops$tkyte%ORA11GR2> select * from V$SGAINFO;

NAME                                          BYTES RES
---------------------------------------- ---------- ---
Fixed SGA Size                              1335924 No
Redo Buffers                                2244608 No
Buffer Cache Size                         113246208 Yes
Shared Pool Size                          142606336 Yes
Large Pool Size                             4194304 Yes
Java Pool Size                              4194304 Yes
Streams Pool Size                                 0 Yes
Shared IO Pool Size                               0 Yes
Granule Size                                4194304 No
Maximum SGA Size                          267825152 No
Startup overhead in Shared Pool           109051904 No
Free SGA Memory Available                         0

12 rows selected.
Note
To use automatic SGA memory management, the parameter statistics_level must be set to TYPICAL or ALL. If statistics collection is not enabled, the database will not have the historical information needed to make the necessary sizing decisions.
Under automatic SGA memory management, the primary parameter for sizing the auto-tuned components is SGA_TARGET, which may be dynamically sized while the database is up and running, up to the setting of the SGA_MAX_SIZE parameter. This defaults to be equal to the SGA_TARGET, so if you plan on increasing the SGA_TARGET, you must have set the SGA_MAX_SIZE larger before starting the database instance. The database will use the SGA_TARGET value, minus the size of any of the other manually sized components such as the db_keep_cache_size, db_recycle_cache_size, and so on, and use that amount of memory to size the default buffer pool, shared pool, large pool, and Java pool. Dynamically at runtime, the instance will allocate and reallocate memory among those four memory areas as needed. Instead of returning an ORA-04031 "Unable to allocate N bytes of shared memory" error to a user when the shared pool runs out of memory, the instance could instead choose to shrink the buffer cache by some number of megabytes (a granule size) and increase the shared pool by that amount.
Over time, as the memory needs of the instance are ascertained, the size of the various SGA components would become more or less fixed in size. The database also remembers the sizes of these four components across database startup and shutdown so that it doesn't have to start all over again figuring out the right size for your instance each time. It does this via four double-underscore parameters: __db_cache_size, __java_pool_size, __large_pool_size, and __shared_pool_size. During a normal or immediate shutdown, the database will record these values to the stored parameter file and use them at startup to set the default sizes of each area.
Note
This last feature, of storing the recommended values for the pools, only works if you are using stored parameter files.
Additionally, if you know you want a certain minimum value to be used for one of the four areas, you may set that parameter in addition to setting the SGA_TARGET. The instance will use your setting as the lower bound, or the smallest size that particular area may be.
Starting in Oracle Database 11g Release 1 and above, the database also offers automatic memory management—sort of a one stop shop for all of your memory settings. With Oracle 10g and automatic SGA memory management—the DBA could get away with just two major memory settings—the pga_aggregrate_target and the sga_target. The database would automatically allocate and reallocate memory chunks within each as described above. In Oracle Database 11g, the DBA can now get away with setting a single memory parameter—the memory_target. This memory_target represents the total amount of memory the combined SGA and PGA allocations should strive to stay within (remember, the PGA memory can be somewhat uncontrollable!). The database will dynamically determine what the proper SGA size is and what the proper PGA size is, based on workload history). Over time, as the workload performed in the database changes, the allocations to the SGA and PGA will change as well. For example, if you are heavy OLTP (Online Transaction Processing) during the day and heavy batch processing at night, you might discover that the daytime SGA is much larger than the PGA and the nighttime SGA is much smaller than the PGA. This would reflect the different memory needs of these two application types.
Just as with automatic SGA memory management, the DBA can set up lower bounds for the size of each memory area by setting the SGA_TARGET and PGA_AGGREGATE_TARGET, or the lower bound of each of the pools in the SGA by setting their values to that lower bound. The database will remember the optimal settings for the pools and the SGA and PGA in the stored parameter file if you are using one. For example, on one of my test systems I've set:
memory_target= 756msga_target= 256mpga_aggregate_target= 256m
The stored parameter file for that database currently has:
sys%ORA11GR2> create pfile='/tmp/pfile' from spfile; File created. sys%ORA11GR2> !cat /tmp/pfile;ora11gr2.__db_cache_size=88080384ora11gr2.__java_pool_size=4194304ora11gr2.__large_pool_size=4194304ora11gr2.__pga_aggregate_target=524288000ora11gr2.__sga_target=268435456ora11gr2.__shared_io_pool_size=0ora11gr2.__shared_pool_size=146800640ora11gr2.__streams_pool_size=0*.compatible='11.2.0.0.0' *.control_files='/home/ora11gr2/app/ora11gr2/oradata/orcl/control01.ctl','/home/ora11gr2/app/ora11gr2/flash_recovery_area/orcl/control02.ctl' *.db_16k_cache_size=16777216 *.db_block_size=8192 *.db_name='orcl' *.db_recovery_file_dest='/home/ora11gr2/app/ora11gr2/flash_recovery_area' *.db_recovery_file_dest_size=4039114752 *.diagnostic_dest='/home/ora11gr2/app/ora11gr2' *.log_buffer=1*.memory_target=792723456*.open_cursors=300*.pga_aggregate_target=256m*.processes=600 *.remote_login_passwordfile='EXCLUSIVE' *.resource_limit=TRUE*.sga_target=268435456*.undo_tablespace='UNDOTBS1'
As you can see, the double-underscore parameters in bold now include the __sga_target and __pga_aggregate_target settings as well as the various pools. These values are derived based on the last three memory parameters shown in bold, as well as the observed server workload. In this fashion, Oracle will remember your last optimal SGA/PGA settings and use them upon the next restart.
In this chapter, we took a look at the Oracle memory structure. We started at the process and session level, examining the PGA and UGA and their relationship. We saw how the mode in which we connect to Oracle dictates how memory is organized. A dedicated server connection implies more memory used in the server process than under a shared server connection, but that use of a shared server connection implies there will be the need for a significantly larger SGA. Then we discussed the main structures of the SGA itself. We discovered the differences between the shared pool and the large pool, and looked at why we might want a large pool to "save" our shared pool. We covered the Java pool and how it is used under various conditions, and we looked at the block buffer cache and how that can be subdivided into smaller, more focused pools.
Now we are ready to move on to the physical processes that make up the rest of an Oracle instance.