Exposure and Understanding the Histogram
Introduction
You’ll see some of the best examples of the creative use of exposure at the cinema. For example, when I watched the film ”The King’s Speech,” I was struck by how dark the opening scenes were. For me, it’s not a great look—it’s not flattering to the actors, and there was no oomph or sparkle to the scenes. If a photographer took photos at the same brightness, I wouldn’t hesitate to say they were underexposed.
I don’t know why the movie was shot the way it was, but I’m sure the movie’s producers knew what they were doing. It just goes to show how subjective the question of exposure is. What looks underexposed to me may be correctly exposed according to someone else.
In this article, I’d like to address the idea that some photographers have—that in any given situation there is a single exposure that is right and that anything else is wrong. That’s not true. The question of exposure is as open to creative interpretation as any other aspect of photography.
There are two sides to exposure. One is technical, and it’s the question of arriving at the “correct” exposure. In this case, I define the correct exposure as the one that creates a digital file containing the maximum possible information. This is a relatively easy goal to achieve once you understand the technical aspects of how your camera’s sensor reacts to light.
The other side is creative. This aspect relates to how bright or dark you want the photo to be in order to convey something to the viewer. It’s tied to the mood of the photo or the feel that you want to express in the image.
This means—and this is the principle that I’m going to explore in-depth in this guide—that if you wanted to create a dark image, in the style of “The King’s Speech,” the best way to do it is to select an exposure that creates a digital file containing the most information possible, then to darken it in postprocessing. The advantage of this method is that it maximizes image quality in the final image.
Exposure and digital photography
Now that most photographers use digital cameras, there are two types of people learning about exposure. The first group is composed of photographers who started out using film and learned about the principles of exposure in relation either to slides, black-and-white film, or color negatives. These photographers have to get used to the fact that digital photography is a different medium and that the basic principles of exposure that they are familiar with have changed. It’s time to adapt their knowledge to the new medium. I understand this because I started out using film—and when I switched to digital, I had to unlearn the techniques I was using to obtain the correct exposure.
The other group is made up of photographers who have never used film. Their experience is limited to digital cameras. This is not a bad thing—and this group will grow over time as more people are introduced to photography through digital camera technology.
What’s confusing for these photographers is that although there are many resources that discuss exposure, those resources were written before the use of digital cameras became the norm. They were written for the medium of film, not digital technology. While some of these resources have been updated for digital cameras, they still contain many references to techniques that only apply if you are using film.
The purpose of this guide is to explain the principles of exposure for photographers who use digital cameras. By the end of this guide, you will understand how to take a photo that is correctly exposed (i.e., contains the maximum information) using the tools provided for you by your digital single-lens reflex (SLR) camera.
I’ve used real-life examples throughout, displaying screen shots taken from the back of my camera. The histograms you see in this guide are the ones displayed by the camera, not generated by software like Adobe® Photoshop® or Adobe Photoshop Lightroom®. This is important because the histograms on your camera are the ones you use to tell you how accurate your exposure was.
The histogram
One advantage that digital cameras have over their film counterparts is instant feedback. You no longer have to wait for your film to be developed to see if your photos are correctly exposed (I remember waiting a week for Kodachrome slides to come back from the processor). Nor do you have to bracket exposures like you did with slide film to make sure of getting a correctly exposed frame.
Instant feedback has sped up the learning process, allowing you to check the accuracy of your exposures immediately. With the histogram, you can see if your exposure settings were correct and learn from your mistakes right away. You simply adjust your exposure as you go along, according to what your camera’s telling you.
Just about every digital SLR camera can display a histogram, so check your instruction manual to learn how to view the histogram on your camera. In general, there should be an option to display the histogram when you play back your photos. Some cameras with Live View also have an option to display a live histogram so that you can see how accurate your exposure is before you take the photo. How cool is that!
Exposure modes
All digital SLRs come with more than one exposure mode. I’ll run through what each one does later, but for now the important point to understand is that no matter how sophisticated your camera, it still isn’t easy for it to arrive at the correct exposure each and every time you press the shutter button. If it were easy, cameras would come with just one exposure mode and no one would experience any problems with under- or overexposed images.
We all know that exposure isn’t always as easy as we would like it to be. My advice is that you should treat the reading your camera gives you as a suggestion only. It’s up to you to override your camera’s suggested reading when necessary. If that sounds complicated, don’t worry. At heart, exposure is quite simple and digital SLRs come with all the tools you need to help you get your exposure spot-on.
What is a histogram?
A histogram is a graph that represents the brightness values of the photo that you’ve taken. As a photographer you will encounter histograms generated by sources other than your camera, including software like Adobe Photoshop CS and Lightroom (or whatever image-editing programs you use). These histograms all vary at least slightly. To avoid confusion, whenever I use the word histogram I’m referring to the one displayed by your camera, unless I specifically say otherwise in the text.
The reason that your camera displays a histogram is quite simple—it’s the only way of determining the accuracy of your exposure. Don’t make the mistake of judging exposure by looking at your photos on the camera’s LCD screen. That doesn’t work.
If you’ve ever tried to look at the screen of a laptop computer outside, you’ll understand why. Your perception of the brightness of the image on the LCD screen depends on the ambient light level. If it’s bright, you’ll think that your photos are underexposed when they aren’t. On the other hand, if it’s dark outside, you may think your photos are too bright.
Figure 1 Pressing the Playback button on my EOS 5D Mark II shows the image that I’ve just taken.
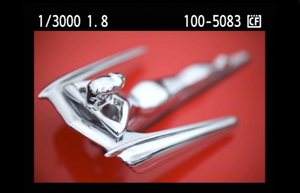
Figure 2 Pressing the Info button twice displays the luminance histogram.
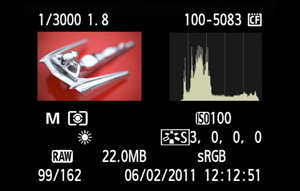
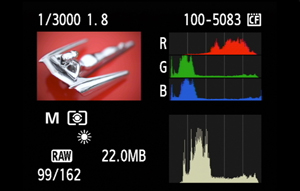
Figure 3 Pressing the Info button once more adds the red, green, and blue histograms to the display.
These illustrations are taken from the back of a Canon EOS-5D Mark II camera. The first shows the full-size photo on the back of the LCD screen. This camera has a high-resolution, 3-inch LCD screen and, although the display quality is excellent, it is still unreliable for assessing exposure. To do that, I have to press the Info button twice to bring up the second screen. This shows a thumbnail of the image, a luminance histogram, and some extra information about the file and some of the camera settings (the luminance histogram describes the brightness range of the image; more on that in a moment).
Pressing the Info button again brings up another screen that shows the luminance histogram plus three color histograms. The color histograms show the brightness values in the red, green, and blue color channels.
The luminance histogram
Figure 4 This diagram shows the histogram, and how it relates to the tones captured in the photo, for the image in Figure 1.
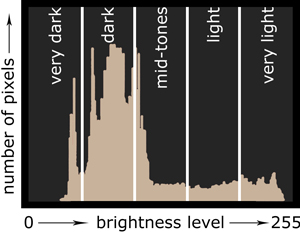
A luminance histogram is a bar graph that shows the brightness of the pixels within your photo. The x-axis (the bottom line) represents brightness in a range starting at zero (pure black) and finishing at 255 (pure white). The y-axis shows the number of pixels of each brightness value that the photo contains.
The histogram display on the EOS-5D Mark II is divided into five zones (other camera models may differ). The left-hand zone shows the darkest tones in the image, and the right-hand zone the lightest. The middle zone shows the midtones. In this particular image, we can see that the majority of the tones fit into the dark zone.
The luminance histogram is the important one to check when it comes to exposure, and early digital cameras often showed just the luminance histogram (and no color histograms). The ability to show color histograms has been introduced on more recent models. The luminance histogram is also sometimes called a brightness histogram.
The color histograms
Figure 5 This diagram shows the red, green, and blue histograms for the image in Figure 1.
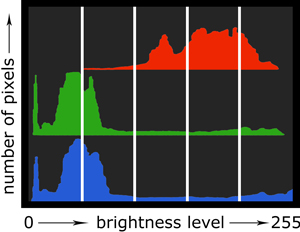
The color histograms are also bar graphs that show the brightness range of the red, green, and blue channels. The x-axis represents each color from dark to light, and the y-axis shows the number of pixels that the image contains of each color value.
You can see that red is the dominant color in this image and that some of the red tones in this photo are quite bright. That’s why the red histogram leans to the right.
Tip: If this is the first time that you’ve come across the concept of color channels, it’s quite simple. All you really need to know is that the 12-million-odd possible colors in your photo can all be created from a combination of just three primary colors: red, green, and blue. These three colors form the basic building blocks of every digital image. You may be familiar with the concept—televisions and RGB monitors work the same way.
You may have read that you can use the color histograms to judge the color balance of your images. The idea is that in a neutral image, all three color histograms would look more or less the same. I disagree with this—in real life there are times when it’s quite natural for a photo to be dominated by a particular color. This photo is a perfect example.
The color histograms are sometimes referred to as an RGB histogram. The term RGB histogram may also be used to describe a single histogram that is a combination of the three color histograms.
RGB histograms vs. luminance histograms
RGB histograms show the accumulated values of the red, green, and blue channels. Luminance histograms show the brightness range of the image, taking into account that the human eye is twice as sensitive to green light than red or blue light. You can verify this by comparing the luminance histogram to the color histograms on the back of your camera—it will look more like the green histogram than the other two. You can see that in the diagrams above as well.
The origin of histograms
The histograms you see on the back of your camera are generated from a JPEG file created at the time you took the photo. It’s important to be aware of this if you are using the Raw format. JPEG files contain less information than Raw files, and it’s important to bear this in mind when interpreting the histogram. I’ll go into this in more detail later.
What histograms tell you
The luminance histogram is a guide to the contrast and tonal distribution of the image, the dynamic range of the subject plus any underexposure or overexposure. You may have read that a ”good” histogram is bunched toward the middle of the graph. This is incorrect. There is no such thing as a good histogram; a histogram is just conveying information about the tonal values of the image you’ve just taken. The histogram of a correctly exposed image may bunch up in the middle, or lean to the left or right. It depends on the tonal range within the image.
Dynamic range and contrast
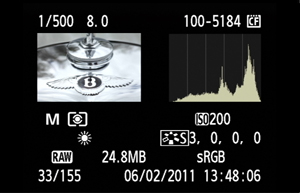
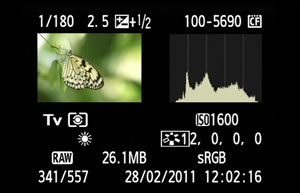
Figure 6 This photo doesn’t have much contrast, and thus the graph doesn’t cover the full range of the luminance histogram.
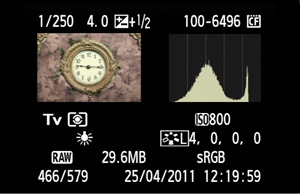
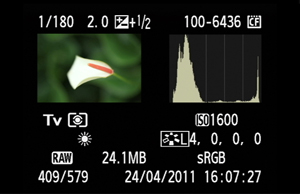
Figure 7 This photo has greater contrast, and the graph covers the entire range of the luminance histogram.
The histogram represents brightness values of zero to 255. Now look at the above photos and the accompanying histograms displayed by the camera.
The first photo was taken indoors, in a museum, lit by artificial light. You can see that the bar graph doesn’t occupy the entire space available—there is a large gap on the right and a smaller one on the left. This tells you that the contrast of this image isn’t very high.
You can get histograms like this whenever the subject doesn’t have much contrast—for example, if you’re shooting on a cloudy day, or in misty or foggy conditions. As the contrast of the subject drops, so does the amount of space occupied by the histogram.
In the histogram of the second photo, by contrast, the graph is spread out over more or less the entire range. There are two spikes in the histogram—one on the left, indicating the darkest tones in the image (the shadows and green leaves in the background), and another on the right that corresponds to the bright petal. Even though the photo was taken indoors under diffused light, the contrast is fairly high.
Expect to see histograms similar to this if you’re shooting on a sunny day or your subject has plenty of contrast.
Tonal distribution
Figure 8 This photo contains lots of dark tones, and the luminance histogram spikes to the left.
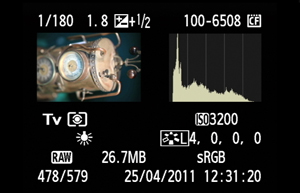
Figure 9 This photo, on the other hand, is very bright, and the luminance histogram spikes to the right.
The luminance histogram is a guide to the ways that tones are distributed across your image. You’re probably beginning to understand that the spikes in the graph correspond to shadows, highlights, and midtones within the image.
An image containing lots of dark tones has a histogram that leans to the left, and an image with lots of bright tones has one that leans to the right. You can see that in the two photos above. The first one is quite dark, and there is a corresponding spike on the left-hand side of the histogram.
The second photo is very bright; therefore, the histogram has a spike on the right-hand side.
Clipped highlights
So far we’ve looked at examples in which the graph stays within the right- and left-hand limits of the histogram. But what does it mean if the graph extends past these limits? This indicates whether you have successfully captured all the tonal detail within the subject, or whether there are any parts of the photo where highlight or shadow detail have been lost.
When you look at a photo’s histogram, pay attention to the right-hand side of the graph. Does the graph slope downward to meet the x-axis, or does it stop abruptly at the edge of the histogram? If it stops abruptly, this indicates that some of the highlights could be clipped. The term clipped highlights means the highlights are overexposed and contain no texture or detail. They will appear pure white when you view the image on your computer.
If you use the JPEG format when you take photos, you won’t be able to recover any of the lost information in the clipped highlights. If you use the Raw format, your Raw processing software may be able to recover some of the detail, depending on the degree of overexposure. There’s more on this topic later in this guide.
Figure 10 The luminance histogram shows that the tonal range across the entire scene has been successfully recorded by the camera’s sensor.
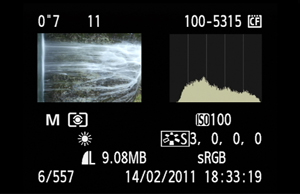
Figure 11 For this exposure, the sun came out, increasing the ambient light. The luminance histogram shows that the same exposure has resulted in loss of highlight detail.
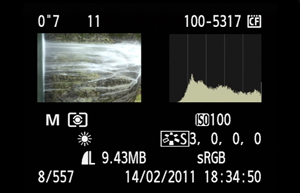
Take a look at these two photos of a waterfall, one taken a minute or so after the other. In the first photo, the graph lies within the left- and right-hand boundaries of the histogram. Every detail within the subject has been successfully recorded by the camera’s sensor. In the second photo, however, the sun came out and the ambient light levels increased, and the photo, even though the exposure settings are the same as the first, has been overexposed. The histogram tells the story—the higher light levels mean that the brightest parts of the subject have received too much exposure and are overexposed.
Figure 12 The highlight alert indicates which parts of the image have been clipped.
Highlight alert
Most digital cameras have a highlight alert feature. This is also known as the ”blinkies,” thanks to the way the alert flashes when you play your images back on the camera (the screen shot above shows what it looks like on my EOS-5D Mark II). The purpose of the highlight alert is to warn you about any clipped highlights. If the ”blinkies” are flashing, it’s a signal to check the histogram and see what’s going on with the exposure.
Specular highlights
Figure 13 The highlight alert (black) indicates that there is a small amount of clipping in the brightest highlights.

Beware of confusing specular highlights with overexposed highlights. Specular highlights are small highlights on shiny surfaces like water or metal. You get them on sunny days, and they will show up as clipped highlights in your photos and activate the highlight alert. But they are not really anything to worry about—as long as they are small, they usually look perfectly natural in the final image. This photo is a good example. The highlight alert is indicating clipping, but this is to be expected when taking a photo of shiny metal surface.
Clipped shadows
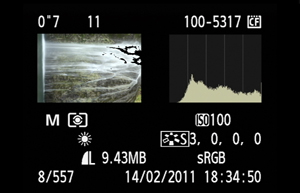
Figure 14 The histogram indicates that there are clipped shadows, that is, dark tones without detail or texture, in the photo.

The same principle applies to the darkest tones in your photo. Does the graph slope downward to meet the x-axis of the histogram, or does it run up against the left side of the histogram? If it runs up against the side, you have some clipped shadows. This is not as bad as clipped highlights—clipped shadows look quite natural in the final image, whereas clipped highlights often don’t. There are clipped shadows in this photo, but this doesn’t really matter since the photo was taken at night and black areas are to be expected—they look natural to the viewer.
Underexposure
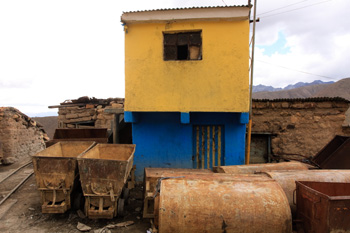
Figure 15 The space on the right-hand side of the histogram indicates that I can increase exposure without clipping any highlights.
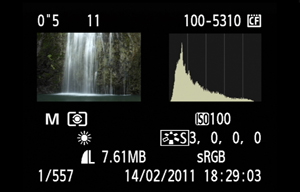
Figure 16 An increase in exposure of one stop results in a brighter image and no loss of highlight detail.

Sometimes a photo can be underexposed without clipping any shadows. There’s no precise rule that indicates whether a left-leaning histogram, for instance, is telling you whether the image that you’ve just taken is underexposed or merely contains a lot of dark tones.
But there is one indication you can look out for—space on the right-hand side of the histogram. The two photos above demonstrate what I mean. In the first, the histogram leans to the left. This looks all right, as the rocks in the photo are quite dark. But if you take a close look at the histogram, you’ll see that the graph doesn’t extend all the way to the right. This indicates that you can increase exposure without clipping any highlights. So I increased the exposure by a stop and took another photo. You can see that the histogram in the second photo leans to the right. That’s the beauty of digital—if you’re ever in doubt, you can take another photo at a different setting.
Clipping in the color histograms
There’s one more thing you should look out for, and that’s clipping in the color channels. If the luminance histogram is pushing up against the right-hand edge of the graph, then you should check the color histograms. Even if the luminance histogram shows no sign of clipping, it’s possible that one of the color channels is clipped. A quick look at the color histograms (if your camera has them) will confirm this.
Digital vs. film
The luminance histogram is an excellent guide to whether your image is overexposed or underexposed. The first, and most important, thing to check is highlight clipping. That’s one of the reasons why digital cameras can display histograms and highlight alerts.
Why is this important? It has to do with the way digital sensors react to light. If you’re trying to understand the differences between exposure on a digital camera and exposure for film, then pay attention here because the following point is crucial.
Digital
Digital camera sensors react to light in a linear fashion. What does this mean? The individual pixels on the camera’s sensor are sensitive to light. During an exposure each pixel records the amount of light that hits it, and the camera converts that information into either a Raw or JPEG file that we recognize as the digital image. The brightness level recorded by each pixel corresponds directly to the amount of light that falls on it. If twice as much light falls on one pixel as another, the first pixel will record a brightness level twice that of the second.
Film
Film, however, responds differently. If twice the amount of light hits one film grain than another, the first film grain doesn’t necessarily record twice the amount of brightness. The sensitivity of the film grain to light decreases as the amount of light hitting it increases.
Overexposure
Figure 17 The sharp transition from a grey cloud to burnt-out highlights in this digital image looks unnatural.
Digital cameras are sensitive to overexposure; it’s easier to overexpose parts of the digital image than a film image. Furthermore, the results tend to look a lot more unnatural on digital than film. Take a look at the highlights in the sky in the photo above. There is no gentle graduation between the grey clouds and the brightest part of the sky. Instead, there’s a sharp transition from areas that contain detail to clipped highlights, and it doesn’t look right.
The result is that with digital, the main aim of the photographer is usually to avoid overexposing the highlights, and this is one of the key factors in the decision as to which is the correct exposure. With film, this isn’t such an important consideration.
JPEG vs. Raw
Digital cameras record images in two different file formats: JPEG and Raw. Both serve a purpose, which is why both options are included in your camera. Your approach to exposure with digital cameras depends on which of the two formats you are using. To understand how this works, let’s look at the differences between them.
JPEG
If you are using the JPEG format when you take a photo, the camera takes the data captured by the camera’s settings, processes it according to the camera settings (such as white balance and contrast), and saves it as a compressed 8-bit JPEG file. As JPEG files contain far less data than the sensor is capable of recording, any unused data is thrown away by the camera. Once it’s gone, you can’t get it back.
Raw
On the other hand, if you’re using the Raw format, the camera saves all the information captured by the sensor in a Raw file, which you can open in a Raw processing application on your computer. You then adjust the settings within the program to process the image and save it in a format that is recognized by other software (usually JPEG or TIFF).
Bit depth
Bit depth is a measure of how much information is contained in a photo file. JPEG files have a bit depth of 8 bits per channel. This means that each pixel in the image is assigned a value from between zero and 255 in each of the three color channels: red, green, and blue. The total number of possible color values per pixel is obtained by multiplying the total number of possible values in each channel (256 × 256 × 256). This results in 16,777,216 possible color tones. Given that, according to the experts, the human eye is capable of detecting 12 million or so color tones, you can see that a JPEG file contains more than enough color information for practical use.
The scale of zero to 255 should be familiar to you; it matches the scales used in the luminance and color histograms displayed by your camera.
Depending on your camera, Raw files have more bit depth, normally 12 or 14 bits per channel (it varies according to which camera you have). How much difference does this make? Quite a lot: 12-bit files assign a value between zero and 4095 per channel to each pixel. The scale in 14-bit files ranges from zero to 16,383.
This doesn’t mean that Raw files contain more colors—remember that JPEG files are already capable of storing more colors than the human eye can see. But it does mean that Raw files contain much more information than JPEG files. That information can be pulled out and used by Raw processing software.
It all boils down to this: JPEG files have a lot less leeway in postprocessing. In other words, a JPEG file contains 256 levels of information per channel per pixel, so when you brighten or darken an image in Photoshop, some of that data is lost.
In practice, this means that you have just a little room to brighten or darken JPEG files in Photoshop, thus it’s important to get the exposure as accurate as possible when you take the photo. That way you don’t have to make drastic changes to the image in postprocessing, which leads me back to what I said in the introduction: you need to make sure the exposure is accurate if you are using the JPEG format.
The Raw advantage
Raw files contain all of the information captured at the point of exposure by the camera’s sensor. The extra bit-depth of Raw files means that you have much more flexibility when it comes to making photos darker or lighter. In short, the goal of the exposure is to ensure that as much information as possible is contained within the Raw file. In practice, this means giving the photo as much exposure as possible without clipping any highlights. I’ll go into the details of how you can achieve this later.
Comparing digital to film
Photographers accustomed to exposing for film can think of it like this: JPEGs are similar to slide film—you need to get the exposure spot-on at the point of image capture. Luckily, with JPEGs you still have some leeway for adjusting the brightness in postprocessing. But the general concept is the same—you need to get the exposure right at the point you take the photo.
Raw files, though, have more in common with color negative film than slide film. Color negative film responds well to overexposure and horribly to underexposure. With color negative film, the aim is to create a good negative to create a print from, and to do that you need a negative that contains as much information as possible. This is usually achieved by increasing the exposure. Raw files work the same way. It’s just that you use a computer to process your images rather than print them in a darkroom.
Image quality and exposure
Exposure is one of the key building blocks to your photographic technique. It’s important to get it right; otherwise you may have technical flaws in your photos that can’t be corrected in postprocessing.
The effects of underexposure
Figure 18 This image has been underexposed. The lack of light on the background means that no details have been recorded in the darkest tones.
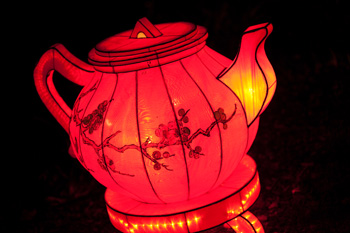
Figure 19 Increasing the brightness in Photoshop has the side effect of increasing noise levels.
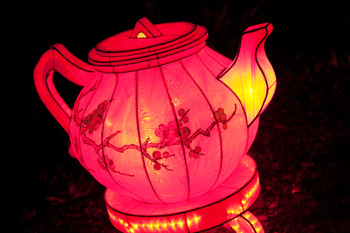
Figure 20 Close-up of Figure 18.
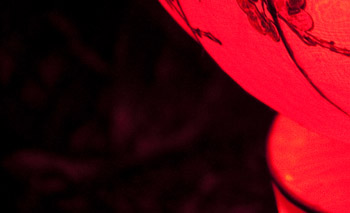
Figure 21 Close-up of Figure 19. There is a visible difference in noise levels.
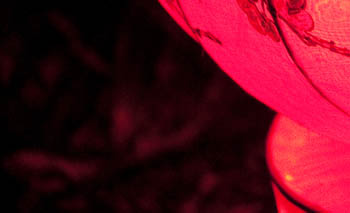
If you underexpose an image, you will need to correct it in postprocessing by increasing the brightness. This increases the noise levels in the photo, and there’s not much that you can do about it. It happens regardless of whether you used the Raw or JPEG format, although you will probably get better results from brightening a Raw file than a JPEG. This issue is more pronounced at high ISO settings than low ones, although it can happen at low ISO settings as well.
The other thing that will happen with underexposure is a loss of texture and detail in shadow areas. Texture is only recorded when enough light hits the sensor. If you underexpose the image, less light hits the sensor, and you lose detail in dark areas. You cannot bring back detail that was never recorded in the first place. You can lighten these areas, but you end up with a brighter image that still lacks detail in the darker areas, and more noise.
You can see these principles in action in the above photos. The image of the teapot lantern was underexposed. It’s easy to lighten in Photoshop—but at the cost of increasing noise levels. There are also parts of the background with no texture or detail. This cannot be fixed in Photoshop.
The effects of overexposure
Figure 22 This photo has been overexposed. There is no detail in the brightest tones.
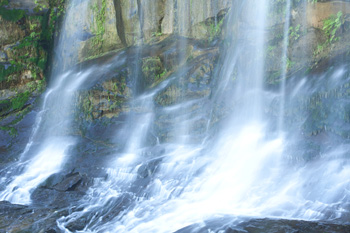
Figure 23 I’ve darkened the image in Photoshop, but the brightest tones still show no detail, as there was none recorded in the first place.
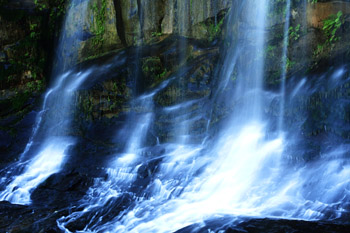
Figure 24 Close-up of Figure 22.
Figure 25 Close-up of Figure 23.
Overexposure brings a different set of problems. Remember that earlier I wrote about the differences between the ways that digital sensors and film react to light. Digital sensors are more sensitive to overexposure than film. You can think of the pixels in the sensor as small wells that fill up with light during the exposure. Once a pixel fills up, it is no longer capable of recording detail—and what you get is a clipped highlight.
Another way of thinking about it is to see each pixel as a well with a scale of zero to 255 on the side. The scale matches the camera’s histogram—and if you get to 255, the pixel is overexposed.
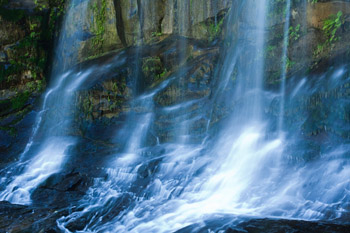
If you look at the two photos above, you’ll see that the first sample is overexposed. The second one shows what happened when I darkened it in Photoshop. While the rocks are darker and look better, there is still no detail in the water. That’s because the sensor captured no detail in these areas.
Overexposure and Raw
Figure 26 I captured the previous overexposed image in both Raw and JPEG formats. Here, I’ve used the recovery slider in Photoshop to retrieve as much highlight detail as possible from the Raw file. There’s a significant improvement over the result from the JPEG file.
When it comes to overexposure, it can make a big difference if you use the Raw format. Raw files contain more information than JPEG files, including information related to the highlights and lightest areas of the image.
Raw processing applications have a function for recovering lost highlight detail. Photoshop and Lightroom, for example, both have a recovery slider for this purpose. The image of the waterfall above shows the difference that the recovery slider makes. You’ll notice that it hasn’t recovered all the clipped highlights, but it’s still a big improvement.
Highlight clipping
You may remember that earlier I mentioned that highlights that appear clipped, according to the histogram, may not be actually be overexposed if you are using the Raw format. The leeway provided by the extra bit depth in Raw files means that you don’t have to pay as much attention to clipped highlights as you do if you are using the JPEG format. The Raw format gives you the capability of recovering highlight detail that would be lost if you had used the JPEG format.
The three exposure scenarios
There are three basic lighting scenarios that you will encounter as a photographer. Your approach to exposure depends on which of these scenarios you are faced with as well as the file format you are using.
Scenario 1: The subject brightness matches the dynamic range of the sensor
Figure 27 The histogram indicates that the brightness range of the scene matches the dynamic range of the sensor.
The histogram stretches from one side of the graph to the other, with either no gap or just a small gap at the edges. It doesn’t get any easier than this. There is no clipping of the highlights and shadows, and the contrast range of the subject is good. All you have to do is determine which exposure settings to use and keep an eye on the histogram to make sure things don’t change.
Scenario 2: The subject brightness is less than the dynamic range of the sensor
Figure 28 The histogram of this image, taken at the camera’s recommended exposure settings, shows that the brightness range of the subject is very low.
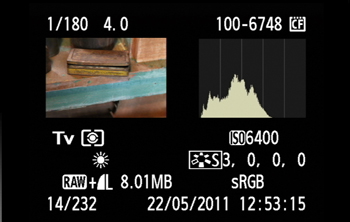
In this scenario, the brightness of the subject is lower than what the camera’s sensor can handle. This results in a histogram with all the pixels bunched up somewhere in the middle and a large gap on either side. The photo above is a good example; it was taken at the settings suggested by the camera’s evaluative metering. The contrast of the subject is low, and there is plenty of room to the right of the graph in the histogram.
If you are using the JPEG format, you don’t need to do much. The important thing is to make sure you err on the side of overexposure, rather than underexposure. It’s best to have to darken the image in postprocessing than to have to lighten it, which will increase the noise. This means that if you see a histogram like the one above, it’s worth taking another photo with the exposure increased by half a stop or a full stop. This is so easy with digital cameras that there is little excuse not to.
If the approach suits the subject, you have the option to increase the contrast using the camera’s settings. This will have the effect of spreading the histogram out over a larger range. This is a little like using the auto-levels command in Photoshop, except that you are doing it yourself in-camera. Don’t forget to return the contrast control to its default setting afterward, before your next shoot.
Exposing to the right
Figure 29 Overexposing by a stop moves the histogram to the right. There is still space on the right-hand side of the graph.
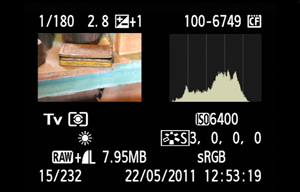
Figure 30 Overexposing by two stops moves the histogram even further to the right. There are still no clipped highlights.
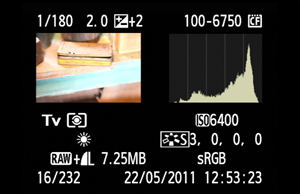
Figure 31 This is the photo processed from the Raw file taken at the camera’s original recommended exposure. I had to increase the brightness slightly, and there is noise in the dark tones at the bottom of the image.
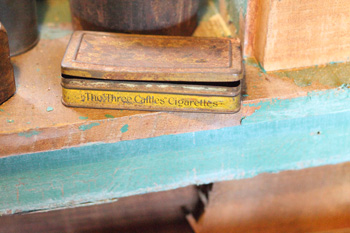
Figure 32 This is the same photo, taken with two stops overexposure and darkened to match the previous image in Lightroom. There is much less noise and also less depth-of-field, as I had to open the aperture by two stops to increase exposure.
If you are using the Raw format, you can increase the exposure so that the histogram moves closer to the right-hand side of the graph. This is called exposing to the right (often abbreviated to ETTR). The quality of the image improves as the graph moves closer to the right-hand side of the histogram. The result, after postprocessing, is a better-quality image with less noise. This technique is particularly effective at high ISO settings.
Increasing exposure
The low contrast in this photo meant that I could increase the exposure by two stops without clipping the highlights. The result? Less noise and much improved image quality. The difference is particularly noticeable at the high ISO setting of 6400 I used for the photo.
Exposing to the right works because of the signal-to-noise ratio within the image. The amount of noise in the image is related to the amount of light that hits the sensor. When less light reaches the sensor during the exposure, noise levels increase. That’s why noise levels are higher when you take photos at higher ISO settings. Less light is hitting the sensor at these settings than when you use a low ISO, and the signal-to-noise ratio is lower.
In the above example, the two-stop increase in exposure meant that four times as much light reached the sensor during the exposure than at the original settings suggested by the camera. I increased the exposure by opening the aperture two stops from f4 to f2. The final image may look too bright, but it’s easy to lower the brightness level in a Raw processor.
Scenario 3: The subject brightness is greater than the dynamic range of the sensor
This is the most problematic scenario to deal with, and the ideal solution really depends on the type of subject that you are faced with. One thing to be aware of is that if the brightness range of the subject really does exceed what the camera’s sensor is capable of recording, that may be a signal that you’re trying to take a photo in the wrong type of light. Most photographers know that the light is better for photography at the start or at the end of the day, when the sun is low in the sky. The light is softer and warmer at these times; it’s also not so strong and the contrast is lower. You are far less likely to encounter a subject with a brightness range that exceeds the sensor’s dynamic range if you are taking photos at the beginning or end of the day.
Avoiding HDR
One solution is to use high dynamic range (HDR) techniques. This is a technique that tends to appeal to newcomers to photography because it creates bright, high-contrast, colorful images. My advice is to avoid HDR techniques whenever you can and instead come back to the photo when the light is kinder to the subject.
Coping with high contrast
Here are some practical photography techniques that will help you when the subject brightness range is greater than what the camera’s sensor can cope with. With one exception, these techniques have nothing to do with postprocessing. Instead the aim is to find a way of changing or evening out the subject’s brightness range so that you end up with a single good image.
Figure 33 The background behind the parrot is very bright. I’ve set the exposure for the parrot, and the highlights in the background are overexposed.
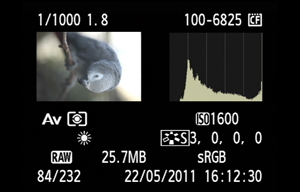
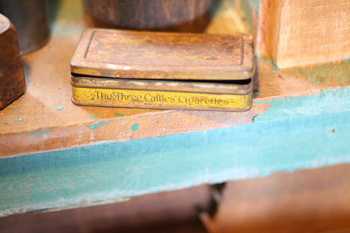
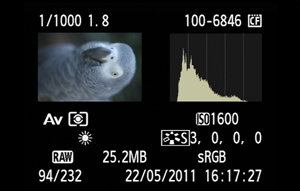
Figure 34 A change in position so that there are no highlights in the background means that the camera’s sensor can easily record the brightness range of the entire scene.
Changing viewpoint
Sometimes just changing viewpoint can make a difference. The bright background behind the parrot in the first photo above means that the contrast range of the scene is too high for the camera’s sensor to cope with. A correct exposure for the parrot results in clipped highlights in the sky.
All I had to do was change position so that there was a darker background behind the parrot. That simple change meant that the camera’s sensor could cope quite easily with the brightness range of the subject.
Sometimes you can do the same by switching from a wide-angle lens to a longer focal length. A wide-angle lens includes more of the scene and, in some situations, highlights in the background will create a problem with excessive contrast. However, if you switch to a lens with a longer focal length, you can hone in on part of the scene and exclude any areas of excessive brightness. This means you are working within the limitations of your camera’s sensor, rather than against them.
Graduated neutral-density filters
Use a graduated neutral-density filter. This is a tool used by landscape photographers to reduce the brightness of the sky. The difference in brightness between the sky and the landscape may be so great that you can’t record both in the same photo. Or, you may be able to expose for the sky, but that means the landscape is underexposed or silhouetted. Graduated neutral-density filters help you overcome the problem by reducing the light from the sky so that the exposure matches that for the land.
Exposure blending
Figure 35 The brightness range of this scene is very high. I created two separate images from the same Raw file. This is the first, and it has been processed to give the correct brightness for the sea and rock stacks.
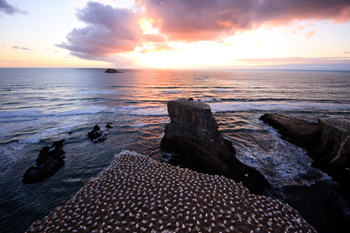
Figure 36 This is another version from the same Raw file, this time processed to bring out the detail in the sky.
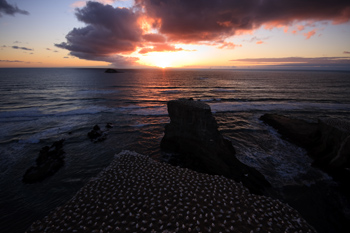
Figure 37 This is the result when the two images are blended together in Photoshop.
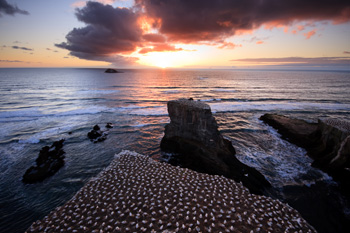
Another potential technique in this situation is to take two photos at different exposures, one for the landscape and the other for the sky, and to blend them together in Photoshop. You need to mount the camera on a tripod so that the two images align. You can even do the same with two different images created from the same Raw file. This is called exposure blending and shouldn’t be confused with HDR techniques, which use a different process. The above photos show this technique in action.
Portable flash
Another solution is to add some light to the subject using a portable flash unit. This is a popular technique with portraits. You can expose for the background and add light to the subject with the flash unit. There are so many techniques you can use with portable flash that it’s difficult to know where to begin. A good place to start is on David Hobby’s Web site www.strobist.com, which contains tutorials for newcomers to flash photography. You can also buy books from Peachpit authors Joe McNally and Syl Arena on the same topic.
The exposure triangle
The basics of exposure are quite simple. There are three settings on your camera that affect exposure—ISO, aperture, and shutter speed. Exposure is just a matter of deciding which setting to use for each one.
ISO
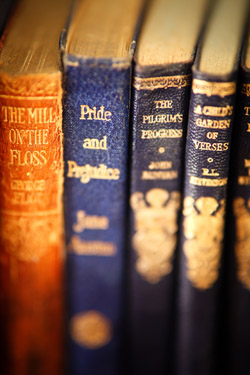
Figure 38 I had to use an ISO of 3200 to give me a fast enough shutter speed to take a hand-held photo of these books without camera shake.
ISO is the measure of the sensitivity to light of the camera’s sensor. One of the advantages of digital cameras, compared to film, is that you have the freedom to change the ISO setting from photo to photo.
The lowest ISO setting of most digital cameras is either 100 or 200. This setting gives you the best image quality. It is the setting you would use when image quality is a priority. It is the setting that landscape photographers tend to use, for example, as they are accustomed to using tripods so that they can take photos with long shutter speeds without camera shake.
As you raise the ISO, the sensitivity of the camera’s sensor to light increases but at the cost of image quality. Noise levels increase as you raise the ISO. How much raising the ISO affects your images depends partly on your camera, and partly on your photographic technique. For example, older digital cameras tend to have more noise at high ISO settings than newer ones. This is because camera manufacturers have made noise reduction a priority over the last few years and the high ISO performance of their latest models is a big improvement over cameras made five years ago or more.
Full-frame cameras also produce images with less noise at high ISO settings than cameras with smaller sensors.
Technique is important, too. You can minimize noise at high ISO settings by using the Raw format and utilizing the expose-to-the-right technique where possible. An advantage of using Raw at high ISO settings is that you can apply noise reduction to the photo when you process it. If you use the JPEG format, you are stuck with the camera’s generic high ISO noise-reduction performance, which may not match that of your Raw processor, and furthermore can’t be tailored to individual photos.
While it’s important to understand that you’ll get better image quality at the lowest ISO settings on your camera, it’s also important to appreciate that you’ll also get good image quality at higher ISO settings, provided that your technique is sound. Don’t be afraid of your camera’s high ISO settings.
A good approach is to take some test photos at each ISO setting on your camera and look at them on your computer afterward. That way you can compare the noise levels and make a decision about the highest ISO settings you are comfortable using. The above photo, for example, was taken at ISO 3200. It was taken indoors, hand-held, and that was the ISO I had to use to give me a shutter speed fast enough to avoid camera shake.
Aperture
Figure 39 An aperture setting of f1.8 gives a narrow depth-of-field and throws the background out of focus.
The aperture setting controls the size of the iris within the lens. If you are using a zoom lens, the aperture settings may range from around f4 to f22. The lower the aperture number, the larger the iris. The larger the iris, the more light gets through. Prime lenses have wider maximum aperture settings, typically in the f1.4 to f2.8 range.
Aperture affects image quality. The optical performance of a camera lens is at its lowest at the widest aperture settings, where you will see more pronounced vignetting and poorer edge-to-edge sharpness than at other settings. You should also avoid taking photos at f22 where possible, as another optical effect called diffraction softens the image.
Image quality improves as you move toward the middle of the aperture range. Generally speaking, you’ll get the best optical quality from your lens at f8 or f11 (or f5.6 on a prime lens with a wide maximum aperture).
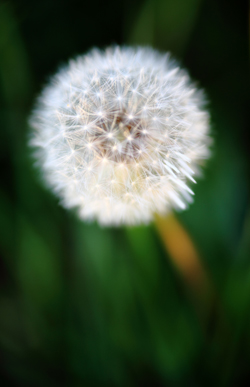
The aperture setting you select also has another effect on depth-of-field. There is more depth-of-field at small apertures than wide apertures. You can see this in the photo of a dandelion above. I wanted to throw the background out of focus, so I selected a wide aperture of f1.8, the maximum aperture setting of the 85mm lens I was using.
Shutter speed
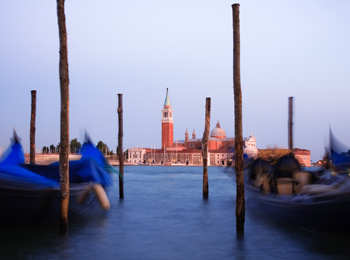
Figure 40 I chose a slow shutter speed of 2.5 seconds to record the movement of the gondolas as a blur.
The shutter speed measures the amount of time that the shutter is open during the exposure. The shutter speed settings on your camera cover a wide range—from 30 seconds at the longest end to 1/8000 second at the shortest end is typical.
There are two considerations when setting shutter speed. The first is camera shake. If you are hand-holding the camera, you need to select a shutter speed that is fast enough to prevent camera shake with the lens you are using. If you have the camera mounted on a tripod, this is not such an important consideration.
The second consideration is subject motion. If your subject is moving, do you want a shutter speed that is fast enough to freeze the movement, or do you want to use a slower shutter speed that conveys movement by blurring the subject? If your subject is completely still, this doesn’t matter. For example, in the above photo, I chose a shutter speed of 2.5 seconds to blur the water and the motion of the gondolas.
The exposure triangle in practice
Deciding which ISO, aperture and shutter-speed settings to use depends partly on ambient light levels and practical considerations like preventing camera shake, and partly on creative decisions such as depth-of-field.
The easiest way is to set two of the three and let the other one change according to light levels. For example, if you are taking a landscape photo, and depth-of-field and image quality are your priorities, you could set the ISO to 100, the aperture to something like f11 or f16 to maximize depth-of-field, and let the shutter speed be the variable factor (you’ll need to use a tripod to prevent camera shake). You can easily achieve this by using aperture priority mode.
On the other hand, you may be taking some action photos. You need a high shutter speed, but you don’t want the ISO to be too high because of the image quality. So in this case, you could set the camera to shutter priority mode, set the shutter speed required (say 1/500 second), and a medium ISO figure (around 400), and let the aperture vary according to light levels.
Another option is to set the camera to Program or another fully automatic mode and let it make the decisions for you. It will do quite well, but it does take creative control away from you. If you want to become a better photographer, avoid the camera’s automatic modes and get into the habit of making creative decisions for yourself.
Automatic exposure
There are two types of automatic exposure modes. There are fully automatic modes where the camera makes all the decisions for you. These are aimed at beginners and are not much use for anybody who likes to make creative decisions for themselves.
The other type of automatic mode is where you set ISO and either aperture or shutter speed yourself, and the camera calculates the remaining setting using its built-in metering modes. These are called aperture priority and shutter priority modes, and are the automatic exposure modes that you should be using most often.
Now, if only exposure were a simple matter of setting either aperture priority or shutter priority and letting the camera take care of the rest. Unfortunately, it’s not that easy and there’s a simple reason why. Your camera comes with several metering modes and each of them works well under certain circumstances and poorly under others. It’s the photographer’s job to choose which metering mode is appropriate to the subject.
This isn’t really as complex as it sounds, once you understand the differences between each one. These are the most commonly used metering modes. Check your camera’s instruction manual to see which ones you have. The names may vary according to manufacturer.
Evaluative metering
This is Canon’s term. Nikon calls it matrix metering. The screen is divided into zones and the camera compares the light reading from each one to make an exposure decision. It’s worth looking into precisely how this works for your camera; for instance, your camera may weight the exposure toward the active autofocus point on the assumption that it is likely to be covering the subject. Understanding your camera’s version of evaluative metering helps you judge how it’s going to react in different circumstances. The complexity of evaluative metering means that it can be a little less predictable than the other metering modes on your camera.
Evaluative metering is your camera’s most sophisticated metering mode. Often, there is no need to use any of the other modes. However, it is useful to understand how they work in case you encounter a situation where they would be useful.
Center-weighted average metering
This metering mode takes into account the entire subject but weights its light reading toward the center of the frame, working on the assumption that this is where the subject is likely to be. Some photographers prefer center-weighted averaging to evaluative metering because it behaves predictably. This makes it easy to judge when it’s likely to give an inaccurate reading and compensate accordingly.
Partial metering
The camera meters from a small area in the center of the frame. It comes in useful when photographing backlit subjects, as it is less likely to be influenced by the bright background than evaluative or center-weighted average metering.
Spot metering
The camera takes a reading from a small area in the center of the frame. Spot metering is aimed at photographers who want to take light readings from several parts of the subject to judge the difference in brightness between them. It is very useful for black-and-white film photographers, but not so useful on digital cameras. Some advanced cameras have multi-spot metering modes where you can enter the results of two or more spot-meter readings and the camera calculates an average exposure.
18% grey
Figure 41 The camera bases its exposure readings on the assumption that all the tones within the photo average out to mid-grey. This means that if you photograph something that is predominantly white, like this snow scene, the camera will underexpose it.
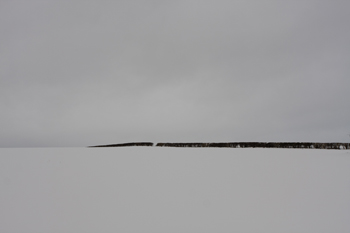
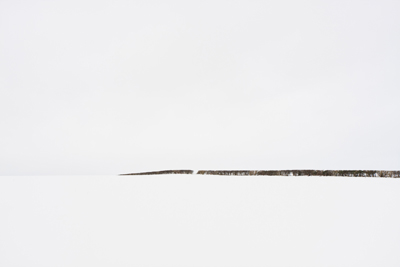
Figure 42 Increasing the exposure by around two stops compensates for the camera’s error and gives the correct exposure.
Regardless of which metering mode you decide to use, they all work to the same basic principle. That is, if you average out all the tones within the subject, you’ll get a midtone that is called 18% grey. This works most of the time. Sometimes though, you’ll run into situations where the tones within the scene don’t average out to 18% grey. That’s when the metering modes start to run into problems. Evaluative metering is less likely to give a misleading reading than the other metering modes, but even so it can still be misled easily.
However, if you know in advance what type of subject matter is going to give the camera’s metering system a hard time, you can get ready to override the camera’s meter if the readings are wrong.
The types of scene that can mislead the camera’s meter are those that are backlit, or have a predominance of dark or light tones. If your camera is faced with a backlit subject, or one that is light, such as a snowy landscape (such as the one above), it tends to underexpose. You’ll need to compensate by overexposing by about two stops. If the subject is comprised of predominantly dark tones, the camera tends to overexpose.
Automatic metering and the histogram
Regardless of which metering mode you decide to use, you need to check the accuracy of the camera’s reading against the histogram. It is even more important if you are photographing a subject you know is likely to cause problems for the camera’s meter. A quick look at the histogram will tell you how the camera’s meter is performing. If the histogram indicates that the exposure is correct, then there is no need to do anything more.
If it indicates that your light meter is giving the wrong reading, then you need to compensate. There are two methods of doing this. The first is to use the exposure compensation feature on your camera. This lets you dial in up to two stops of over- or underexposure (newer or more advanced cameras may provide up to five stops exposure compensation). The exposure compensation that you set will be applied to all the photos that you take until you change or disable it.
For example, if you are taking photos of a snowy landscape, you can dial in plus two stops of overexposure to compensate for the camera’s tendency to underexpose this type of subject. After you have applied exposure compensation, take another photo and check the histogram again to make sure that the exposure is correct.
Tip: You can use exposure compensation to apply overexposure to the image while using the expose-to-the-right technique. This works if the subject matter has a low contrast range and the graph is bunched up somewhere in the middle of the histogram with gaps on either side. If you’re taking a number of photos in the same lighting conditions, you can dial in a stop or two of exposure compensation to push the histogram all the way over to the right. Just remember to check the histogram every now and then to make sure that you are not overexposing the image.
Manual exposure
Another option is to switch to manual exposure mode. This is where you set the ISO, aperture, and shutter speed yourself and the camera can’t change any of the settings. It’s a technique that works quite well with using the histogram to check your exposures. Once you’ve established the optimum exposure, you don’t have to change the settings (unless the ambient light level changes). An advantage of this method is that the exposure is consistent from frame to frame. This can potentially save you time in postprocessing if you are using the Raw format, as you can apply the same settings to multiple images.
If you are using one of the automatic exposure modes, regardless of which metering method, even a slight change in the framing may result in the camera giving a different exposure reading.
Conclusion
Exposure can be a confusing topic, but it doesn’t have to be that way. In essence, it’s quite simple, and there are only a few basic principles to master. Digital photography has made achieving the correct exposure quite easy. We no longer have to wait until our film is developed to check the exposure—the histogram provides instant feedback.
Exposure is a technical topic and it’s easy to forget that there are two sides to photography—the technical and the creative. Photography is both art and craft, and great photographers combine an artist’s vision with the control of a craftsman. Exposure is important, but it’s just a tool to help you realize your vision. The important thing is to make sure that you get out and take some good photos of interesting things, and don’t get so tangled up in theory that you miss an opportunity to take a photo when interesting things are happening in front of you. Press the shutter and take the photo, even if you’re not sure that the camera settings are correct. Sometimes it’s better to get an imperfect image than no image at all.
Mastering photography techniques like exposure takes time. The good news is that with practice, the techniques in this guide will become second nature, and you will be able to put them into practice almost without thinking.