
Key Performance Indicators in Food and Beverage Management
In this chapter, the focus is on the financial good health indicators commonly used in food and beverage management.
While they are not the only tools used to assess of a healthy operation, they constitute an important measurement and are the basic tools used every day in food and beverage management.
Keywords |
||||
Adjustments Analysis Average check Benchmark Budgeted Cost of goods sold (COGS) Consolidated |
Consumption Cost Covers Daily report End of month report Expenses Forecast Gross profit percentage Income |
Indicators Inventory Labor cost Margin Methods Net profit Payroll Percentages Performance Period |
Point of sales (POS) Profit Purchases Ratio Revenue Return on sales (ROS) Salaries Sales Statement Stock |
System Transfers Unit Value Variable Variance Volume Wages |
Main Food and Beverage Indicators and Ratios
Food and Beverage Sales, Revenue, or Income
Food and beverage sales are, in most cases, calculated by a point of sales (POS) system, on a daily basis, and consolidated in monthly figures.
Such systems will also record the number of guests served, under the heading covers; a cover is equivalent to a guest. In operations that are not using electronic POS systems, such figures can be reported manually or using a cash register.
Knowing how many guests were attended to during the day is a very useful indicator of a business’s health, in addition to the amount of sales that were achieved. In the food and beverage industry, it is common to consider covers as guests who consume a meal in the restaurant. A guest coming in for a coffee or lemonade or any other type of drink will generate sales but will not be recorded as a cover.
A bar or a nightclub, serving mostly drinks, would, on the other hand, consider each guest as a cover, as beverage is the main source of revenue.
Situational examples
Situation 1
Four guests have dinner at a restaurant. Pre-dinner drinks are served, as well as a bottle of wine with their meal: four food covers + four beverage covers are recorded.
Situation 2
As in Situation 1, the four guests sit down at a table together; however, only two of them consume meals, and all four have the same drinks as in situation 1: two food covers + four beverage covers are recorded in this case.
Situation 3
Four guests have cocktails at the bar, and one of them orders snacks: four beverage covers + one food cover are recorded.
These examples describe what is generally done in the industry; however, the way of recording covers may vary from organization to organization. The important thing is that a coherent and consistent recording system is put in place by management.
There is a good reason behind careful recording of the covers figures: they are the base for the calculation of the average check, another important ratio in food and beverage. As we will see later, the combination of covers and average checks allows the drafting of budgets and precise analysis of profit and loss statements.
The average check, also called average spent per customer, is a ratio used daily in restaurants: it informs the manager of the spending trend of customers. As mentioned earlier, the average food check of a fine-dining restaurant, such as a one Michelin star, is around 100 U.S. dollars per cover.
Now let us examine the mechanics of covers and average check ratios, the basis for any of the planning and analysis activities in food and beverage management:
Food average check
Total food sales/total food covers
Example:
Food sales: $24,200
Food covers: 450
Food average check: $24,200/450 = $53.77
Beverage average check
Total beverage sales/total beverage covers
Example:
Beverage sales: $4,500
Beverage covers: 520
Beverage average check: $4,500/520 = $8.65
Note that food and beverage average checks should first be calculated separately, in order to have useful and accurate measurements, which can be compared from day to day, month to month, and also on a yearly basis.
Food and Beverage Costs or Expenses
Categories of Expenses in Food and Beverage
Expenses, as opposed to sales or revenue, represent all the costs associated with the food and beverage operation. They are divided in four main sections:
Food cost
Beverage cost
Other expenses
Food cost, beverage cost, and labor cost are generally the highest costs generated by a food and beverage department. The three categories costs added together are called prime cost.
In the luxury segment, food and beverage costs are usually higher, as quality products are more often used than in other types of establishments. The cost of labor is also usually higher as more staff are required, with higher levels of skills. For example, salaries for a pastry chef, a sommelier, or a chief baker in a Michelin-starred restaurant may represent a large percentage of the food and beverage payroll.
Food and beverage costs may also be referred to as COGS (cost of goods sold)

Figure 4.1 Cost repartition in the food and beverage department
Cost of Goods Sold (COGS)
Also referred to as food cost or cost of food sales, COGS is the main benchmark used in any food and beverage operation. Whenever chefs or food and beverage managers meet for a strategic budget meeting, or when reviewing end of the month results, COGS is the main indicator that will be taken into account.
This ratio is calculated at least once per month, by the financial department of the hotel, and is presented in the monthly profit and loss statement, or income statement, which will be further detailed in the following chapter.
As for the average check ratios, COGS should be calculated separately for food and beverage.
The food cost
The food cost is calculated by comparing the product consumption to the sales that were generated.
Obtaining restaurant sales is relatively easy with computerized systems in use today; however, finding out what the exact consumption is a little bit more complex, as most food sales are made of many different ingredients.
In this chapter, we will explore two methods of calculating food consumption: the inventory method and the daily food cost method.
The inventory method
Here is the formula used to calculate food consumption in a food and beverage outlet:
Beginning or opening inventory Computed the first day of the month, by counting or weighing all food products in the kitchen |
|
Issues to the kitchen Obtained by costing all food products transferred to the kitchen, from the hotel’s general stores |
|
Ending inventory Computed the last day of the month, by counting or weighing all food products in the kitchen |
|
Total food consumed |
Once the total food consumption is obtained, certain adjustments will have to be made, such as the cost of food that has been used to produce employees’ meals, or product transfers to and from the outlet. Such transfers may be fruits transferred from the pastry to the bar for the making of cocktails or fresh juices, for example.
The value of employees’ meals is usually predetermined by the human resources department, with the chef’s assistance. If, for example, it costs 3.00 U.S. dollars to produce an employee meal per day, then this amount has to be deducted from the overall food cost. The reason for this is that employees’ meals are considered, in accounting terms, as a staff benefit, and should therefore be allocated to human resources costs rather than food cost.
To be relevant, all food and beverage ratios, such as the COGS, should be expressed as a percentage of sales.
Example
Month end results |
|
Total sales |
$750,000 |
Food sales |
75% of total sales |
Beverage sales |
25% of total sales |
Beginning food inventory |
$25,000 |
Ending food inventory |
$30,000 |
Total food issues |
$200,000 |
Employee meal cost |
$6,000 |
Transfers to bars |
$250 |
Transfers from bars |
$125 |
Calculation of food cost:
Food consumed: $25,000 + $200,000 = $225,000 – $30,000 = $195,000
COGS: $195,000 – $6,000 – $250 + $125 = $188,875
Total food sales: $750,000 * 75/100 = $562,500
Food cost %: $188,875/$562,500 * 100 = 33.6% (rounded to one digit)
This result means that for every 100 U.S. dollars of revenue generated by food sales, the operator had to spend 33.60 U.S. dollars in food products. This is a percentage that may correspond to a fine-dining operation.
Food cost percentage is a very meaningful benchmark for any food and beverage operation, as it assesses its healthy management.
The food cost percentage should be compared both to the budgeted and the previous year’s figures. This will be the main subject of the profit and loss statement section.
The daily food cost method
Counting inventories, also called stocktaking, can be timely, as every item needs to be counted or weighted individually. This task may take a few hours each month for large operations.
For certain establishments, this does not make business sense, as labor hours, which are often the costliest post in fine-dining operations, are best spent in the kitchen production.
Also, smaller restaurant operations tend to have limited storage space in the kitchen, and chefs will focus on the day’s stock to increase the turnover and use the freshest possible food products. For these reasons, most of the stock is used in the daily production and replenished the next day. It is right to assume that on average, the value of inventory will not vary greatly from day to day, and therefore, the daily food cost method may be used.
This method will focus on the cost price of direct purchases, their amounts will be recorded on a daily basis, and consolidated throughout the month. The great advantage of this method is that, besides saving precious time, it also computes a daily figure, rather than a monthly one.
Another advantage for food and beverage management and the executive chef is that the daily inventory method indicates a cost trend, enabling a faster reaction from management if anything looks out of line compared to expectations.
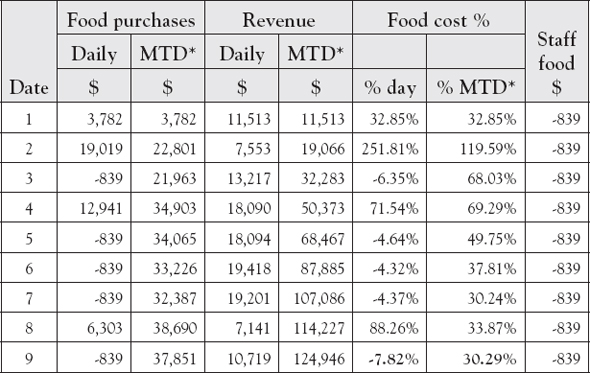
Figure 4.2 Daily food cost calculation
* Month to date
In this example, the value of each day’s purchases is compared to the daily revenue (sales), and the food allocated to staff is deducted daily, providing a net cost of food sold.
The food cost resulting is shown in the two food cost columns on the right. The % day column is not so relevant, as the kitchen may purchase ingredients in preparation for events taking place later in the week. For example, a banquet for 100 guests will be prepared over the course of several days, creating an off balance: for a few days, the cost of purchased ingredients will not be offset by any corresponding sale, as it will only be recorded on the day of the event. Therefore, the % MTD column, which shows the evolution throughout the month, is the most important one and needs to be monitored on a daily basis.
The first five to seven days of the month may not reveal much relevant information either, as it is typically a time when kitchens will restock. After this period, the cumulative food cost tends to stabilize and indicates the trend for the month. In the preceding example, we could expect a month end result of between 31 and 33 percent, corresponding to a fine-dining outlet.
The beverage cost may be calculated using the food cost methods, although the staff transfers would not apply in this case.
Beverage cost for luxury operations tends to be, on average, between 20 and 25 percent. The percentage greatly depends on the wine list’s references: the more luxury products are offered, the higher the cost percentage will tend to be.
There are many different levels of costs among beverage: mineral water, soft drinks, and coffee are usually the most profitable products, while high-quality wines, vintage champagnes, or cognacs have a much higher beverage cost.
Following on the previous example in the food cost section, let us now calculate the beverage cost according to the restaurant’s sales and using the inventory method.
Example
Month end results |
|
Total sales |
$750,000 |
Food sales |
75% of total sales |
Beverage sales |
25% of total sales |
Beginning beverage inventory |
$5,000 |
Ending beverage inventory |
$7,000 |
Total beverage issues |
$35,000 |
Transfers to kitchens |
$150 |
Transfers from kitchens |
$135 |
Calculation of beverage cost:
Beverage consumed: $5,000 + $35,000 = $40,000 – $7,000 = $33,000
COGS: $33,000 – $150 + $135 = $32,985
Total beverage sales: $750,000 * 25/100 = $187,500
Beverage cost %: $32,985/$187,500 * 100 = 17.6% (rounded to one digit)
This result means that for every 100 U.S. dollars of revenue generated by beverage sales, the operator had to spend 17.60 U.S. dollars in beverage products, in line with the expected spending of a fine-dining operation.
As for the food cost percentage, the beverage cost should be compared both to the budgeted, and the previous year’s figures.
Review questions
1. What are the main ratios measuring the food and beverage department’s efficiency?
2. Why are inventories necessary?
3. Is staff food included in COGS?
4. What is an average check?
5. Who is responsible for the COGS?
6. What are the benefits of using the daily food cost technique?
7. Which are food and beverage’s greatest expenses?
8. What is a cover? When is it used?
9. What are examples of transfers to bars?
10. When are inventories required?
Exercises
Calculate the food cost, in value and percentage, using the inventory method:
Food cost calculation—inventory method |
|||
Inventory January 31 |
$21,580 |
||
February purchases: |
|||
Meat |
$10,420 |
||
Dairy |
$3,201 |
||
Fruits and vegetables |
$4,320 |
||
Dry goods |
$15,320 |
||
Number of employees eating daily |
50 |
||
Cost per employee meal |
$3.00 |
||
Inventory on April 30 |
$19,530 |
||
Beginning inventory |
|||
Purchases |
|||
Goods available for sale |
|||
Ending inventory |
|||
Cost of food consumed |
|||
Employee meals (30 days) |
|||
Cost of food sold |
|||
Food revenue February |
$65,450 |
||
Food cost % February |
|||
Complete the daily food cost report for the first week of January, comment on the trends observed in the food cost evolution.

The Profit and Loss Statement
Main Objectives
The profit and loss, commonly called P&L statement, provides a detailed analysis of the volume of sales, the food and beverage expenses, labor expenses and other expenses. It also indicates the level of profitability, or loss, when expenses exceed revenue, of an outlet or department.
Also named the income statement, is it computed at least once a month, after all inventories and sales have been reconciled. The financial department prepares this document, which is based on the information collected in the kitchens and food and beverage outlets. It is extremely important for any food and beverage manager or executive chef to be able to analyze and interpret this report.
The profit and loss statement is similar to a thermometer; it provides management with a clear picture of the business’s health and indicates the efficiency of an operation. The profit and loss statement is analyzed regularly and is a good base to suggest action plans or implement new food and beverage control procedures for future improvement.
It is also worth noting that most staff holding management positions in the food and beverage department, particularly so in international luxury hotel chains, are regularly evaluated on their ability to meet established profit and loss targets.
The profit and loss statement contains six critical operational areas:
• Volume of sales
• Food cost
• Beverage cost
• Labor cost
• Other expenses, broken down in controllable and non-controllable expenses
• Profit or loss
As stated in the previous section, the greatest expenses in a high-level food and beverage operation are food and beverage costs and labor costs, or the prime cost.
The profit and loss statement allows a detailed analysis of the prime cost, as well as the other expenses incurred by food and beverage sales activities. Corporate food and beverage managers or executive chefs, in charge of multiple units, may receive profit and loss comparative data from district or regional managers and establish performance ratings among the various unit managers for each city, region, state, or nation.

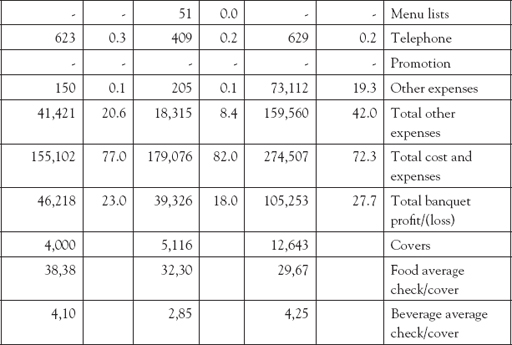
Figure 4.3 Profit and loss statement
Profit Calculation
There are two main levels of profit calculation for a food and beverage operation:
• The gross operating profit (GOP)
• The net profit, or net income
The gross operating profit
This indicator is useful in assessing the efficiency of an operation, concentrating on product consumption only. It is a benchmark, which can be easily compared between different business units within a chain for example.
The GOP is obtained by the following formula:

For the month of January (in $):
Food sales |
45,500 |
Beverage sales |
12,300 |
Food cost |
13,500 |
Beverage cost |
3,250 |
Labor cost |
19,500 |
Other expenses |
6,200 |
Revenue |
January |
% |
Food |
45,500 |
78.7 |
Beverage |
12,300 |
21.3 |
Total |
57,800 |
100 |
Cost of sales |
||
Food |
13,500 |
29.7 |
Beverage |
3,250 |
26.4 |
Total |
16,750 |
29 |
GOP |
||
Food |
32,000 |
70.3 |
Beverage |
9,050 |
73.6 |
Total |
41,050 |
71 |
Net Profit or Income
To calculate net profit, all expenses have to be deducted from the GOP.
They are, in order of importance:
• Labor cost
• Other expenses
Using the preceding example, here are the month’s results:
Revenue |
January |
% |
Food |
45,500 |
78.7 |
Beverage |
12,300 |
21.3 |
Total revenue |
57,800 |
100 |
Cost of sales |
||
Food |
13,500 |
29.7 |
Beverage |
3,250 |
26.4 |
Total cost of sales |
16,750 |
29 |
GOP |
||
Food |
32,000 |
70.3 |
Beverage |
9,050 |
73.6 |
Total GOP |
41,050 |
71 |
Labor cost |
19,500 |
33.7 |
Other expenses |
6,200 |
10.7 |
Net profit or loss |
15,350 |
26.6 |
The result shows a profitability percentage of 26.6, meaning that for every 100 U.S. dollars of food and beverage sales, the business has generated 26.60 U.S. dollars of profit. This is an example of a healthy and well-managed food and beverage venture.
The formula for profit calculation is as follows:
Revenue, 100%
- Food and beverage cost %
- Labor cost %
- Other expense %
- Profit or loss %
Example
During the month of January, Restaurant Blue Oyster achieved food sales of
$8,600, and after inventories, recorded the following costs:
Food cost $2,354
Labor cost $1,892
Other expenses $1,720
GOP: $8,600 – $2,354 = $6,246, or 72.6% of sales
Net profit: $6,246 – $1,892 – $ 1,720 = $2,634 or 30.6% of sales
Profit and Loss Statement Analysis
The primary objective of a food and beverage profit and loss statement is to provide relevant and useful information for the main stakeholders involved in any commercial venture:
• Management
• Shareholders
• Owners
• Creditors
It analyzes strategic information such as:
• Amount of sales
• How much money was spent to realize those sales?
• How much profit was made at the end of the period?
Analysis of the Volume of Sales
The analysis procedure of each of these areas can be divided in three main steps:
• Determine sales for the period, usually corresponding to one month
• Compare this figure to budgeted or targeted sales and proceed to calculate the difference between the two figures
• Express this difference in percentage, in relation with the budgeted sales
Such analysis may highlight different scenarios:
• Similar number of covers were served, at a higher average check
• More guests than targeted were served, at a similar than budgeted average check
• More guests served, at a higher average check
• Fewer guests served, at a higher average check
• And so on.
When analyzing expenses, the first instinctive reaction would be to wish for the lowest possible expenses, and therefore, the highest possible profit. In luxury operations, that approach may be lead to lack of quality in the products offered to guests.
So, let us look closely at the following statement: low costs are good and high costs are bad. It will only depend on what the primary expectation is, or in other words, what was planned, or budgeted for.
Let us take an example: the food cost has decreased by 5 percent between April and May, how could this be interpreted? It could be that the costs were better managed than previously, but it could also very well mean that the portions served were smaller than they should have been, or that the standard of quality of products was lowered. In both cases, it is clearly detrimental for the guest.
Of course, high costs should be avoided as well, in order not to run the risk of generating losses. However, overcontrolling costs at the expense of guest service will result in a series of issues, ranging from guest complaints, or number of covers decreasing, negative comments on social media, to name a few.
So, the trick is to find the right balance, keeping in mind that most improvements in business operations, provided they are carefully planned and assessed, should yield more customers, which, in turn, will yield greater operational expense. All costs are not necessarily negative, they just need to be monitored and controlled, hence the need to forecast expenses ahead.
Labor or Staff Cost
This expense includes all salaries, wages, and benefits such as food, laundry, accommodation, if any, and any other expense that is related to staff. For example, when hiring a restaurant manager for a fine-dining outlet, the cost of his or her transportation to get to the place of interview may be charged to labor cost.
In most food and beverage operations, staff costs are considered a fixed cost, because for the most part, monthly salaries are paid. Although, from time to time, there are variable costs that are added to the overall payroll cost of salaries and wages. The most common example is in the banqueting department, as the remuneration of part-time waiters or waitresses for a large banquet is a variable expense.
When total sales volume increases, fixed labor cost percentages will decline. On the contrary, variable labor costs will increase along with the volume of sales. As with food and beverage costs, COGS, staff expenses provide a number of useful productivity ratios.
The general productivity ratio, which is mostly used in the industry, is the labor cost percentage, which simply compares the total labor costs, fixed and variable, to the food and beverage sales.
The benchmark will vary greatly, depending on the type of establishment, the number of employees, and of course, the geographical location. For example, in Europe, a fine-dining restaurant may have a labor cost of around 40 percent, making it the greatest expense on the profit and loss statement.

The cost of labor will always appear in the profit and loss statement, following the COGS ratio.
Other interesting ratios may be added to the profit and loss report, in the form of statistics, such as:
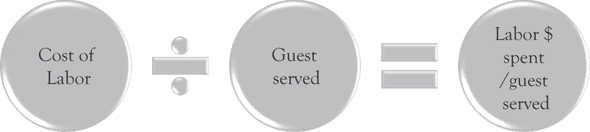
• Labor U.S. dollars spent per guest served
• Guests served per labor hour
• RevPASH, or revenue per available seat hour
Depending on the needs of the operation, any or all of these ratios can be used.
Let us have a look at them one by one in more detail:
Labor U.S. dollars spent per guest served
Week |
Labor cost U.S. dollars |
Guest served |
Labor U.S. dollars spent per guest |
1 |
6,500 |
875 |
7.42 |
2 |
9,030 |
1,138 |
7.93 |
3 |
8,543 |
1,024 |
8.34 |
4 |
6,327 |
698 |
9.06 |
TOTAL |
30,400 |
3,735 |
8.13 |
This ratio expresses the cost of labor for each guest served, giving a more precise indication of productivity than the overall labor cost percentage. It is very useful for budgeting purpose when the manager needs to follow the year to year evolution.
Restaurant operators, wishing to compare performance among different outlets, would also gain valued information from such a ratio.
Guests served per labor hour

Week |
Guests served |
Labor hours used |
Guest served per labor hour |
1 |
740 |
663 |
1.11 |
2 |
850 |
648 |
1.31 |
3 |
1,242 |
850 |
1.46 |
4 |
992 |
790 |
1.25 |
TOTAL |
3,824 |
2,951 |
1.29 |
This ratio is very useful for measuring productivity. It is mostly used in high-volume restaurant operations, where many diners are served simultaneously, such as a fast food or cafeteria for example.
It would probably not be used in a fine-dining restaurant, where guests tend to seat for a longer time.
Revenue per available seat hour (RevPASH)
This ratio evaluates how much guests spend. It also gives information on the speed of service, or table rotation, as well as an occupancy rate of the dining room.

Time slot |
Seats available |
Guests served |
Sales ($) |
RevPASH ($) |
7–8 pm |
50 |
25 |
500 |
10 |
8–9 pm |
50 |
40 |
1,250 |
25 |
9–10 pm |
50 |
50 |
2,000 |
40 |
Total |
150 |
115 |
3,750 |
25 |
Seat occupancy |
115/150 = 76.7% |
|||
RevPASH is useful for high-volume restaurants, where seat rotation is frequent, for example, fast-food operations and coffee shops.
Profit Analysis
The profit margin represents the amount of profit generated on each U.S. dollars of sales, it is that portion of a U.S. dollar sale returned to the operation in the form of profits. Profit margin is also known as return on sales, or ROS. This ratio can also be used to evaluate a manager’s overall effectiveness.
Profit margin percentage is calculated using the following formula:

A positive ROS provides a profit, and a negative profit will mean the company generated a loss, or that expenses were greater than sales.
An operation’s profit variance percentage for an accounting period is measured by the following formula:

Review questions
1. What are food and beverage’s greatest expenses?
2. Which are the various ways of presenting labor ratios?
3. Is a high food cost necessarily a negative sign?
4. What does ROS mean?
5. Why is it useful to determine the average check?
6. How often should a profit and loss statement be computed?
7. Which sections are highlighted in the profit and loss statement?
8. What is the meaning of GOP?
9. What is included in prime cost?
10. Is the RevPASH method useful for a three Michelin star restaurant?
Exercises
Gross profit
Calculate the outlet’s gross profit
Blue Bayou restaurant (in U.S. dollars) |
||
This year |
% |
|
Sales |
||
Food |
2,675,889 |
73.5% |
Beverage |
965,660 |
26.5% |
Total sales |
3,641,549 |
100.0% |
Cost of sales |
||
1,074,420 |
40.2% |
|
Beverage |
115,879 |
12.0% |
Total cost of sales |
1,190,299 |
32.7% |
Gross profit |
||
Food |
||
Beverage |
||
Total gross profit |
||
Percentages, net profit
Calculate the relevant percentages, as well as restaurant’s profits
Blueberry Hill Restaurant (in U.S. dollars) |
||||
This year |
% |
Last year |
% |
|
Sales |
1,020,064 |
954,030 |
||
Expenses |
703,045 |
695,088 |
||
Profit |
||||
RevPASH and seat occupancy
Calculate Blue Bayou restaurant’s RevPASH, as well as seat occupancy for the period
Date: Thursday, November 24, 2019
Time slot |
Seats available |
Guests served |
Sales (U.S. dollars) |
REVPASH (U.S. dollars) |
3–4 pm |
0 |
0 |
0 |
|
4–5 pm |
75 |
5 |
154 |
|
5–6 pm |
75 |
12 |
386 |
|
6–7 pm |
75 |
25 |
850 |
|
7–8 pm |
75 |
60 |
1,872 |
|
8–9 pm |
75 |
45 |
1,690 |
|
9–10 pm |
75 |
38 |
1,245 |
|
10–11 pm |
75 |
11 |
478 |
|
11–12 pm |
0 |
0 |
0 |
|
Total |
||||
Seat occupancy |