
Chapter 8
Benford's Law
The Number Duplication and Last-Two Digits Tests
The data profile, periodic graph, histogram, first-order test, second-order test, and the summation test gave us valuable insights into the internal diagnostics of our data. The data profile and the histogram gave us insights into the distribution of the numbers. The periodic graph showed us the distribution of the amounts across time. The first-order test on the InvoicesPaid table showed that there were abnormal duplications of five first-two digit combinations. Although there was the general tendency toward more numbers with low first-two digits, the visual pattern of the graph and mean absolute deviation showed that the data did not conform to Benford's Law. The second-order test confirmed that much of the data was tightly packed into a small range, a fact that was also evident from the histogram. The summation test showed that there were abnormal duplications of some high-value amounts. The remaining tests in this chapter complete the Nigrini Cycle. This cycle of eight tests should be the minimum set of forensic analytic tests run on data tables. The first of the final two tests drill down into the data table to identify the exact transactions that were causing the spikes on our first-order and summation graphs. The second test identifies abnormal duplications on the right side of the numbers in the data table. These duplications could indicate errors, invented numbers, or excessive rounding.
Running the number duplications test is quite straightforward in Access and a little complex in Excel. Running the last-two digits test uses the same approach and logic as for the first-order tests. Running the round numbers test is a little bit tricky because we have to specify what we mean by “round.”
The number duplication test is a drill-down test and is essentially a numbers hit parade. This test identifies which specific numbers were causing the spikes on the first-order graph and on the summation test graph. Spikes on the first-order graph are linked with some specific numbers occurring abnormally often while any spikes on the summation graph are associated with abnormally large numbers. For example, a large spike at 50 on the first-order graph could be caused by many $50s and on the summation graph it could be caused by a single $50 million.
The number duplication test was developed as a part of my Ph.D. dissertation when I was looking for amounts that were duplicated abnormally often by taxpayers. I believed that these abnormal duplications were there because taxpayers were inventing numbers and since we as humans think alike, we would gravitate toward making up the same numbers. There were some interesting results especially for deduction fields such as charitable contributions. The result of the number duplication test is a table in the form of a report showing (a) a rank, (b) the amount that was duplicated, and (c) count for each amount. The table would usually be sorted by the count descending so that the amount that occurred most often in the data table is listed first.
The number duplication test is run on each of the five main strata in the data profile. That is, we analyze the large positive, small positive, small negative, and large negative numbers separately. This makes it important that the strata in the data profile have some logic behind the break points.
The number duplication test has yielded some valuable findings. The usual candidates for a review in a forensic analytic setting are:
- Numbers linked to large positive spikes on the first-order graph. For the invoices data these would be amounts with first-two digits of 10, 11, 50, 98, and 99. The largest spikes are those first-two digits with the largest Z-statistics and an actual proportion that exceeds the expected proportion. We are usually only interested in positive spikes (i.e., excesses of first-two digits).
- Numbers associated with large positive spikes on the summation test. For the invoices data these would be amounts with first-two digits 10, 11, 14, 15, 26, and 50. Again, the largest spikes would be those digits with the largest Z-statistics. However, since the expected proportions are all equal, the largest spikes are simply the largest actual proportions.
- Numbers just below psychological thresholds or just below control amount levels. These would include amounts such as $24.50, $99, $990, and $4,950.
- Large round numbers. Round numbers are usually dollar amounts that have been negotiated. Examples of negotiated amounts are fees for professional services or donations, both of which are open to fraud and abuse. In one forensic investigation the data showed an excess of numbers equal to $5,000 and $10,000. The findings were that many of these numbers were for donations by company vice presidents to organizations that were of importance to them (and of not too much importance to the company).
- Odd numbers that have occurred unusually often. Examples of odd numbers in the invoices data include $1,153.35, $1,083.45, and $1,159.35.
- Numbers that have occurred relatively more times than any other number. In the invoices data $50 occurs more than twice as often as the next most frequently occurring number.
- Numbers associated with inefficiencies. This would occur when a certain type of transaction for a small dollar amount is processed many times over by a company. In one forensic investigation the auditors discovered that the company had processed 12,000 invoices for $8.20 each. These were for purchases of business cards by the head office employees.
The InvoicesPaid data is made up of transactions in dollars and cents. The number duplication test is not limited to currency units. Airline auditors ran the number duplication test against the mileage deposits to passenger frequent-flyer mileage accounts for a calendar year. The test showed that (not surprisingly) 500 miles was the most frequently deposited number, this being the minimum award for a flight of any distance. The second most frequent number was 802 miles. That number was the distance between the airline's two main hubs. This number was used repeatedly because the airline had many daily flights between its two main hubs.
A company in Tennessee used forensic analytics and the number duplication test to test for fictitious employees. They used the payroll file and tested whether there were duplications in the bank account numbers of employees (from the Direct Deposit Details field). More than two employees having their pay amounts deposited to the same bank account number could be an indicator of fraud. They found cases of multiple deposits in a single pay period to the same checking account and the forensic investigation showed that in most cases this duplication was because two employees were married (to each other). They also found other strange duplications where two or three (younger) employees shared an apartment and also a checking account. The explanation for this was that some of their employees did not qualify for a checking account (perhaps due to prior histories of bouncing checks) and shared a bank account with an employee who was a friend.
The number duplication test has also been run on employee credit cards and the results showed that there was very little number duplication. That is, the most frequently used number was not all that frequently used. These results made sense because there is no real reason that any amount for corporate purchases (other than perhaps courier fees) should occur abnormally often.
This test has also been used with varying levels of success on inventory counts, temperature readings, health care claims, airline ticket refunds, airline flight liquor sales, electricity meter readings, and election counts.
Running the Number Duplication Test in Access
This test is not too complex to run in Access. It is a little complex in Excel because the standard Excel worksheet was not meant to group records and then to count the number of records in each group. In this test (and all the tests in the Nigrini Cycle) only one field is being analyzed. The tests will get more complex later when we analyze two or more fields at the same time. The logic for the number duplication test in Access is shown below:
- Identify the numeric field that will be analyzed.
- Use a criteria (>=10, or between 0.01 And 9.99) to correspond to the data profile strata.
- Use Group By in the query to group the numeric values.
- Use Count to count the numeric values in each group.
- Sort by the Count descending and then sort by the numeric field descending.
- Add the Rank to the output (this is tricky in Access). The rank is 1 for the highest count, 2 for the second highest rank, and so on.
The Access method is shown using the InvoicesPaid data from Chapters 4 to 7. The first number duplication query is shown in Figure 8.1. Change the query from the usual select query to a Make Table query by selecting Query Type→Make Table and naming the table tblNumberDupsLP. The LP at the end indicates Large Positive.
Figure 8.1 The First Step in the Number Duplication Test
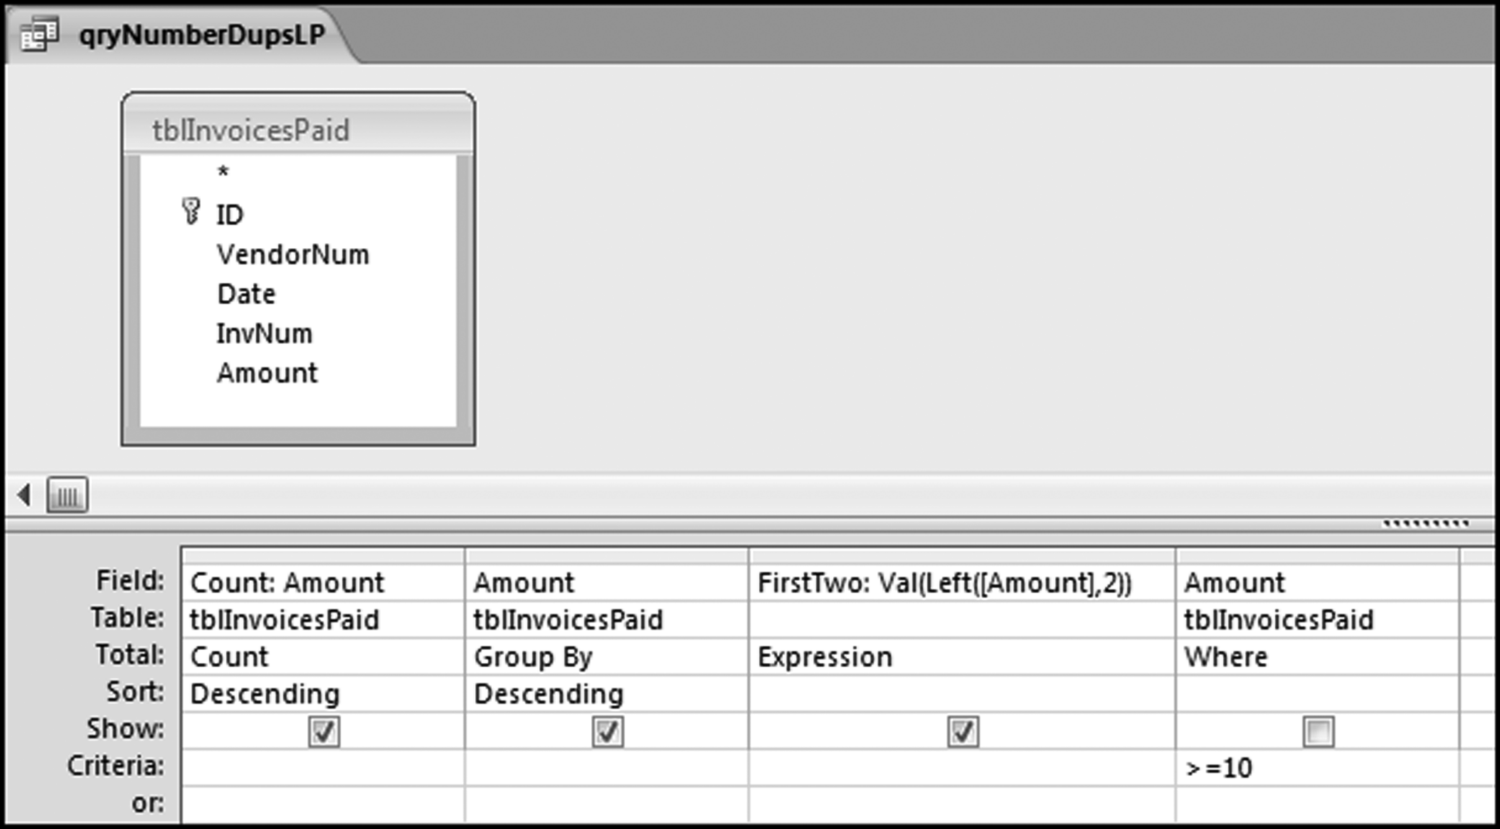
The first step in the number duplication test is shown in Figure 8.1. Save the query as qryNumberDupsLP. Run the query and click Yes after the warning about pasting 64579 rows into a new table. Open the table in Datasheet View to get the results shown in Figure 8.2.
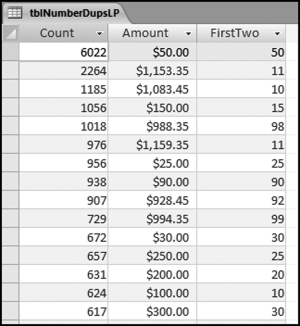
Figure 8.2 The Table Listing the Amounts that Were Duplicated, and Their Counts
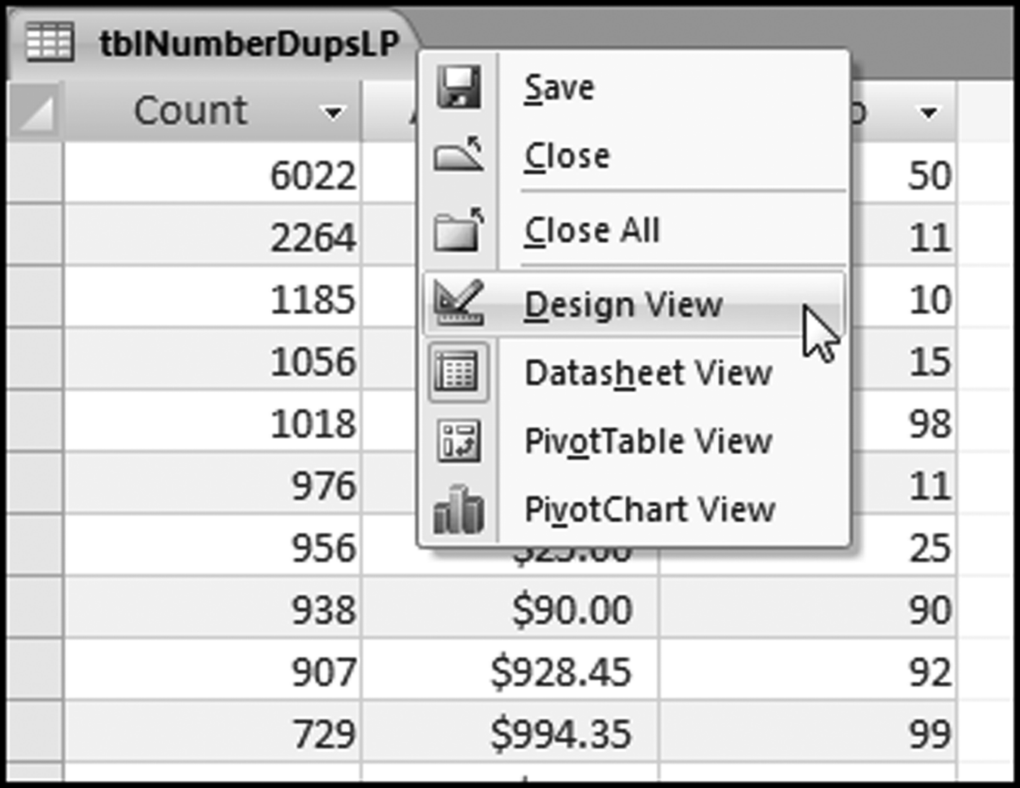
The rank needs to be added to the table. The first step in this process is to change the view in the table from Datasheet View to Design View as is shown in Figure 8.3.
Figure 8.3 The Design View Command
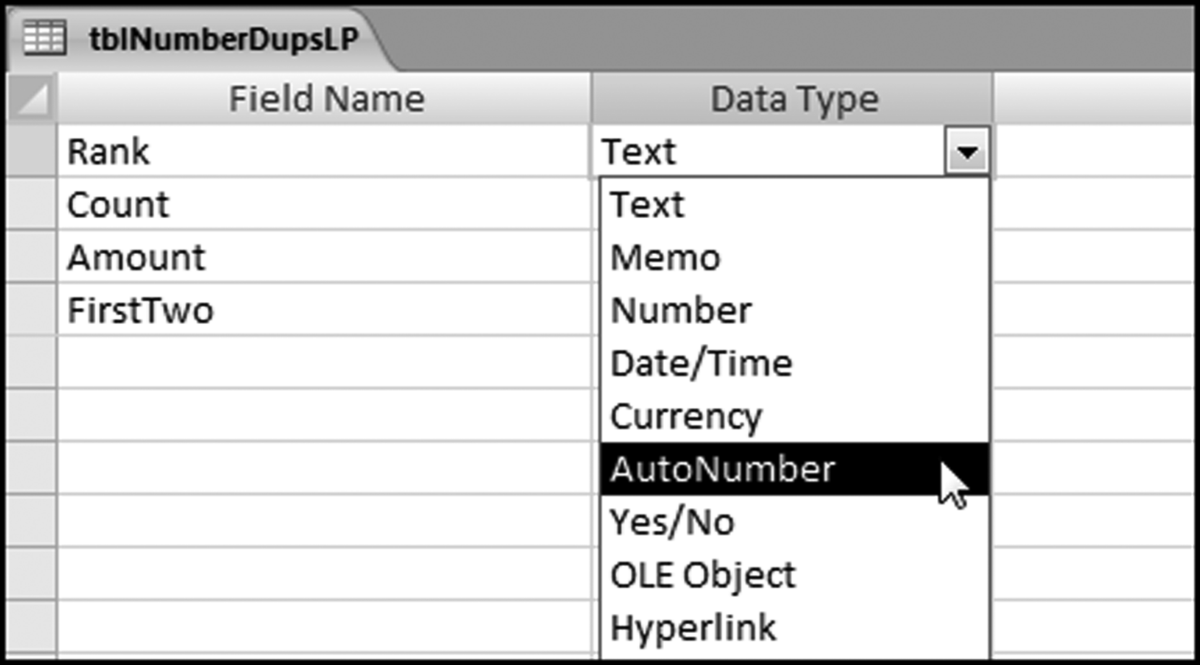
To add the Rank we need to first insert an extra row in the first position. The next step is to add an extra field called Rank and to make the Data Type Auto Number as is shown in Figure 8.4. The changes need to be saved at the prompt.
Figure 8.4 An Extra Field Named Rank Being Added to the Table
To see the final result we have to look at the tblNumberDupsLP table in Datasheet View. The result is shown in Figure 8.5.
Figure 8.5 The Results of the Number Duplication Test. The Results Include Fields Showing the Rank and the First-Two Digits
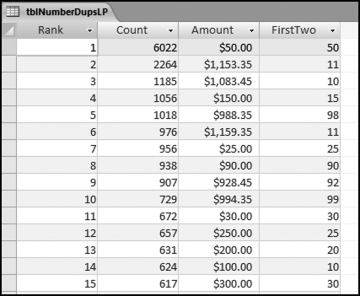
The first row shows that there were 6,022 invoices for exactly $50 each. This means that something that cost $50 was purchased 6,000 times. In a later chapter we will take the test one step further to see if all these invoices were all from one vendor. For now we will assume that they were from different vendors. This is an opportunity for an efficiency improvement. We have about 190,000 invoices for 2010, so this means that about 3 percent of the accounts payable department's workload was processing these $50 payments over and over again. The $50 duplication in the first row also explains the spike at 50 on the first-order graph.
At Rank #2 and Rank #3 there is a high count of numbers with first-two digits of 10 and 11. These numbers go a long way to explaining the spikes at 10 and 11 on the first-order graphs. These transactions should be selected and reviewed. The query result for $1,153.35 is shown in Figure 8.6.
Figure 8.6 The Details for the $1,153.35 Amounts
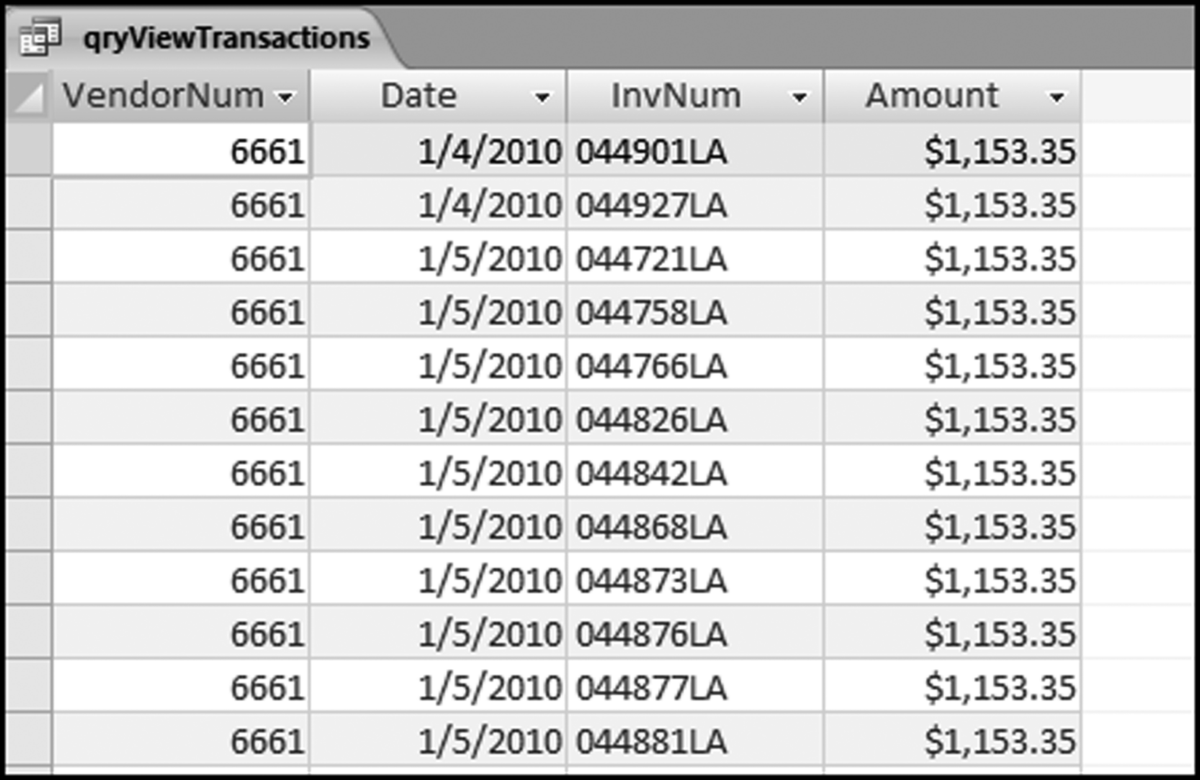
The $1,153.35 transactions are shown in Figure 8.6. The drill-down showed that there was a clustering of dates and that 2,263 of the $1,153.35 transactions were from two vendors with one lone transaction with a third vendor. An in-depth audit would be warranted in a forensic investigations setting.
Another noteworthy fact from the number duplications is that we have $988.35 at rank #5 and $994.25 at rank #10. From Benford's Law we know that 98 is the second least likely first-two digit combination, and 99 is the least likely first-two digit combination. We would therefore not expect to see amounts beginning with 98 and 99 so close to the top of the rankings. Their high rankings go against all that we have learned about Benford's Law. The first-order test showed spikes (excesses) at 98 and 99. The $988.35 and the $994.35 are the causes of the spikes. An in-depth audit would be warranted in a forensic investigations setting.
There is one more noteworthy fact about the number duplication table, but we will save it for later in the chapter. As a clue you can look at the ending digits in Figure 8.5.
The last step in the number duplication test is to identify which amounts caused the spikes on the summation graph. To do this we need to sort the table by the first-two digits. Unfortunately in Access, if you sort a table once this becomes an automatic built-in sort every time that the table opens. Since we are really only interested in the spikes we can write a query to get our result. The query to sort and to only extract the amounts associated with a specified first-two digit combination is shown in Figure 8.7.
Figure 8.7 The Query to Drill Down to the Summation Transactions
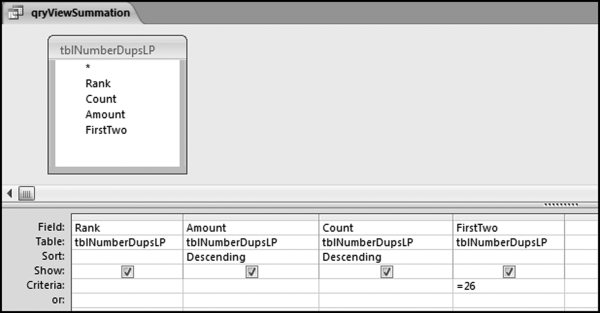
The criterion limits the results to numbers with first-two digits equal to 26. The two sort commands give us the largest amounts followed by the largest counts. Access first sorts on the leftmost sorted field. The results of the query are shown in Figure 8.8.
Figure 8.8 The Amounts with the First-Two Digits 26
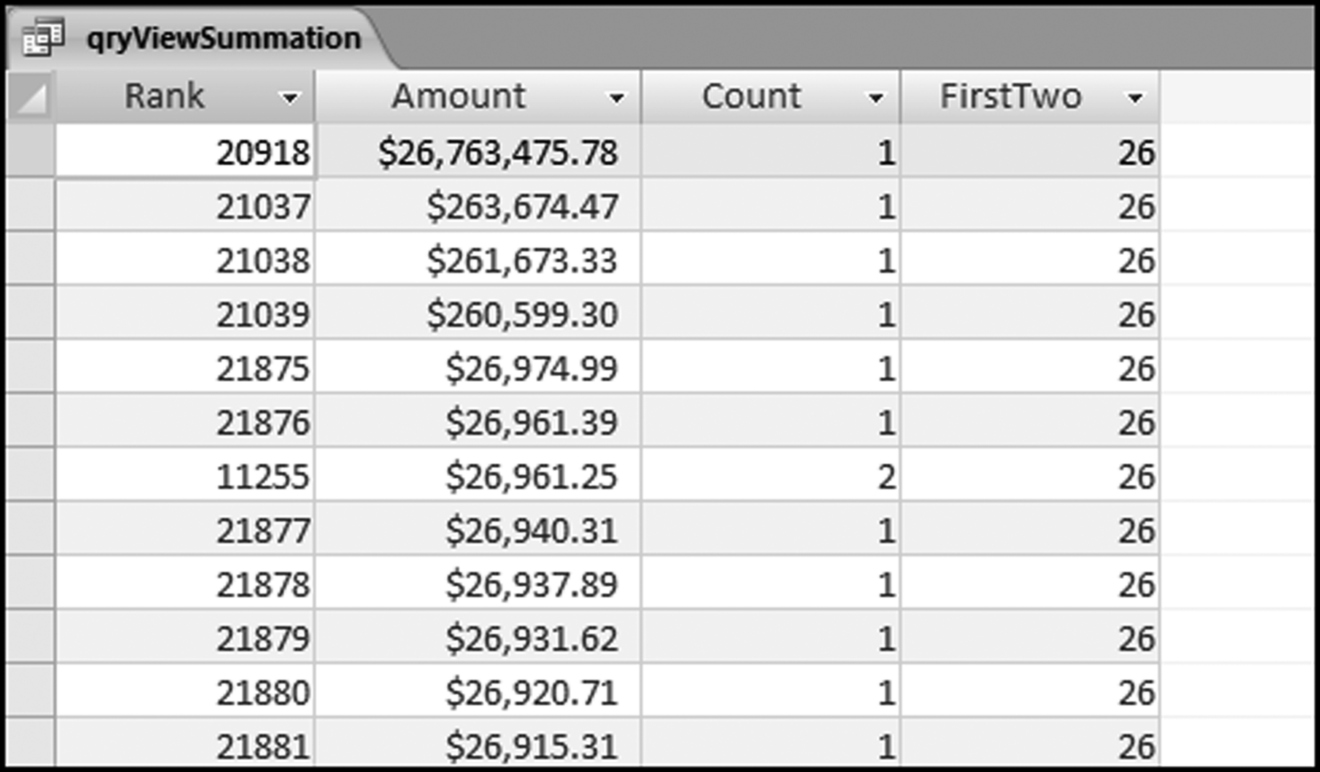
The large amounts associated with the first-two digits 26 are shown in Figure 8.8. The largest dollar amounts are listed first. The table shows that the spike at 26 was caused by one large amount of $26,763,475.78. This transaction is probably neither an error nor a fraud. The transaction is nevertheless a high-value outlier and the payment should be reviewed. An amount of $26.8 million is rare for a cash payment. The summation test also showed a large spike at 50. These transactions are also extracted using the same qryViewSummation query by changing the criterion from 26 to 50. These results are shown in Figure 8.9.
Figure 8.9 The Amounts with the First-Two Digits 50
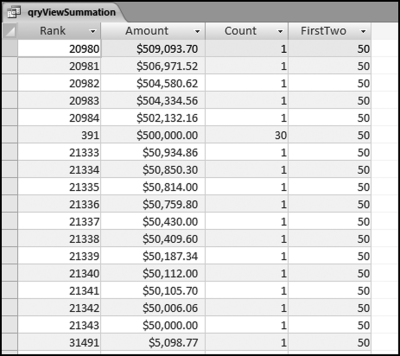
The large amounts associated with the first-two digits 50 are shown in Figure 8.9. These results differ from the 26 results. The 50 spike is mainly caused by a count of 30 for the amount of $500,000. These transactions should be reviewed. It was a high count of $50 that caused the spike at 50 on the first-order graph and the count of 30 for $500,000 that caused the spike at 50 on the summation graph.
The next number duplication test is an analysis of the small positive numbers. The Access approach would be the same as for the large positive numbers. The first step would be to create a new table of the small positive numbers. The query in Figure 8.1 can be reused except that the criterion would be “Between 0.01 and 9.99” and the table name would be tblNumberDupsSP.
Figure 8.10 The Number Duplication Results for the Small Positive Numbers
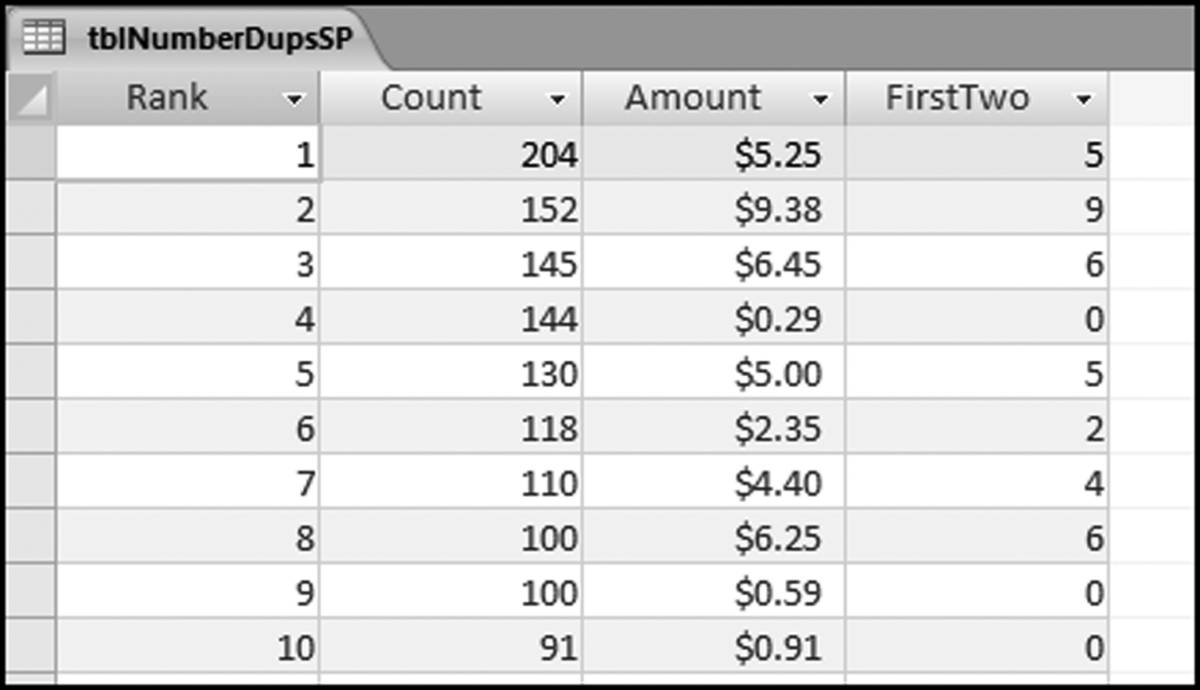
The small positive number duplication results are shown in Figure 8.10. The goal of this test with accounts payable data is to look for processing inefficiencies. The results show duplications of small dollar amounts such as $0.29, $0.59, and $0.91. It is difficult to imagine what any company could be purchasing for such low amounts and also to be processing the payments through the accounts payable system. Note that the first-two digits are shown as single digits. This is because the leftmost two characters of $5.25 are “5” and because the query converts this to a value it is shown as 5. Note also that 0 is not a valid first-two digits combination. If we really wanted the first-two digits of the small positive numbers we could use Left([Amount]∗1000,2). This would multiply 0.01 to 10.00 and the Left function would then extract the correct first-two digits for each small positive number. The left function would normally work well.
The final number duplication test is a test of the large negative numbers, which includes a comparison to the large positive numbers. The idea to include a comparison came about during a forensic investigation of ticket refunds for an airline. The investigators took the position that since the most frequently flown segment for the airline was from Dallas to Chicago that we should expect the most frequently refunded segment to be “Dallas to Chicago.” Similarly, if the best-selling item for a fast-food restaurant was its double hamburger for $3.99, followed by its medium fries for $0.99, then we would expect most of the voids (sales amounts cancelled by the cashier) to be for $3.99 followed by $0.99. It seems logical that refunds, corrections, and voids (all negative numbers) should be correlated with the original sales amounts. You need to sell something before you can refund or void it and the items that are most often sold are the ones most likely to be refunded or voided. We would therefore expect a relationship between the invoice amounts (large positive number duplications) and the credit memos (large negative number duplications).
The creation of the table for the large negative amounts follows the usual logic with just a few changes. The query in Figure 8.1 can be reused with some modifications. First, the criteria should be changed to <=− 10. The less than sign is used to retrieve “large” negative numbers. Second, the first-two digits calculation needs to be changed because of the negative sign, which is the first character of a negative number. The calculated field needs to be changed to
FirstTwo: Val(Left(Abs([Amount]),2))
The calculation shown above will ensure that we take the leftmost two characters of the absolute value of the Amount. The table name needs to be changed to tblNumberDupsLN. The query can then be run to create the number duplication table of large negative numbers. The Rank needs to be added as is shown in Figure 8.4. The Rank turns out to be useful for the final analysis.
The Access query to show the combined number duplication output is set up in a few of stages. The first step is to create a new query in the query Design View. Add both the tblNumberDupsLP and the tblNumberDupsSP tables to the query grid. The next step is to rename the fields so that we know what we are looking at once the query has run. The renaming step is needed because Access will not allow the same field name to be shown twice in a query result. The first step is shown in Figure 8.11.
Figure 8.11 Comparing the Positive and Negative Number Duplications
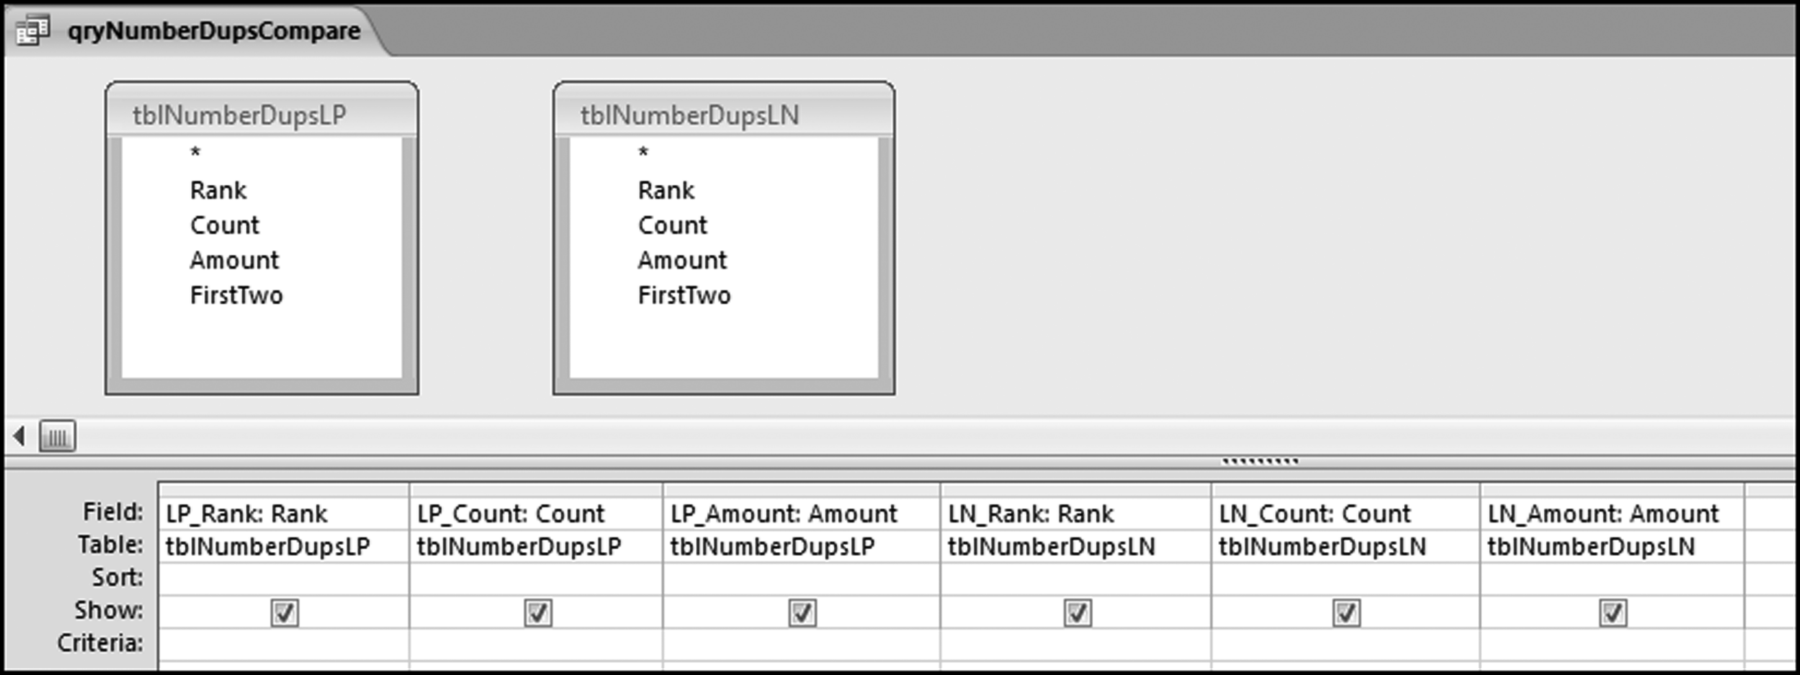
The next step is to join the tables in qryNumberDupsCompare so that we have Rank #1 for large positive on the same row as Rank #1 for large negative. The first step in the join is to link the two fields by clicking on Rank for large positive and holding down the left click button and moving the cursor over to Rank for large negative. The result will be a thin straight line from Rank on the left to Rank on the right.
The final step is to change the default join to a left outer join. To do this we need to left click the line from Rank to Rank. The line will then become bold. The next step is to right click the bold line and to select Join Properties. The final step is to select the radio button for Option #2, which is a left outer join.
Figure 8.12 The Selection of the Left Outer Join for the Number Duplications
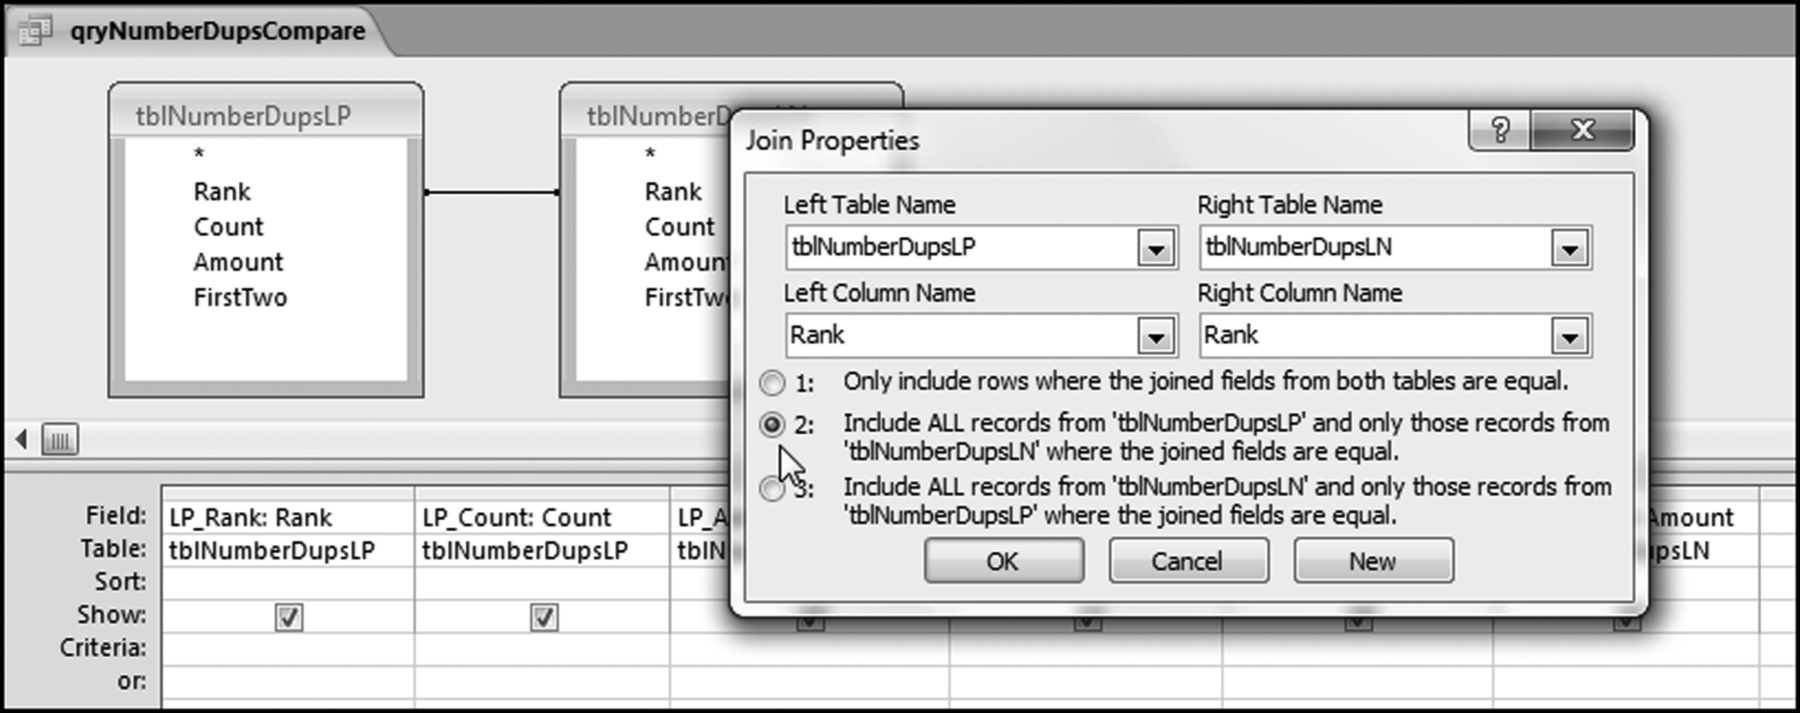
The final step in the comparison of the number duplications is shown in Figure 8.12. Click OK to accept the left out join (Option #2). The result will be a right-facing arrow in qryNumberDupsCompare. Run the query using the usual Design→Results→Run. The number duplication comparison result is shown in Figure 8.13.
Figure 8.13 The Number Duplications for the Positive and Negative Amounts
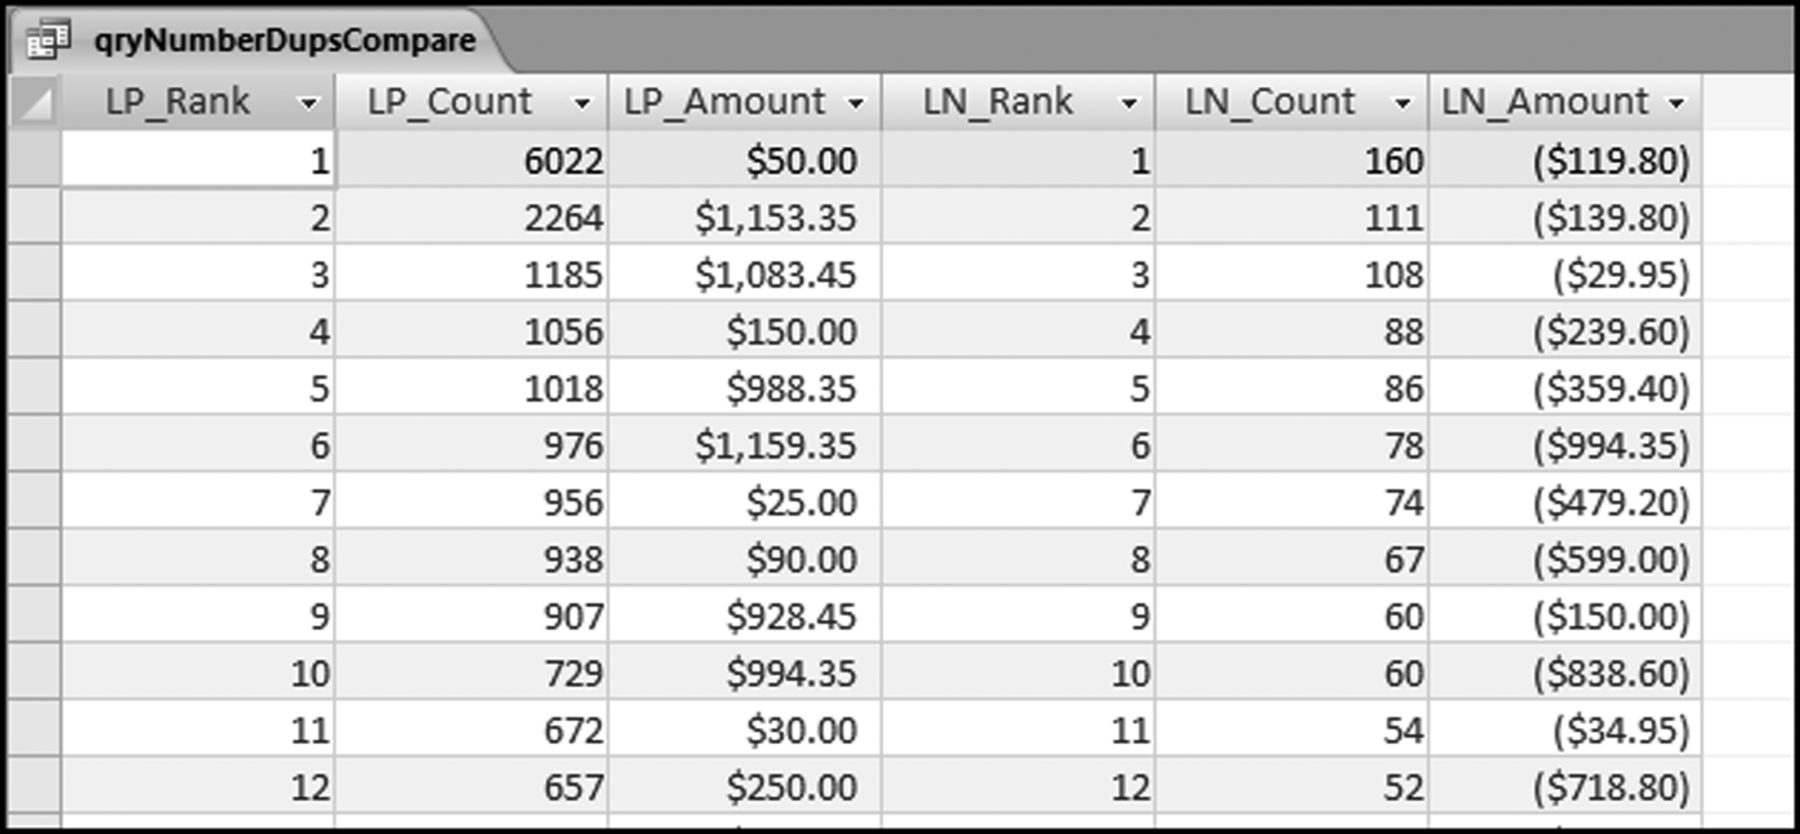
The number duplication results in Figure 8.13 are very interesting. There is no relationship between the top nine positive numbers and the top nine negative numbers. Indeed, the positive numbers that occurred abnormally often ($50.00, $1,153.35, $1,083.45, and $988.35) are nowhere near the top of the negative number duplication table. A search of the negative numbers shows that these amounts were corrected 8, 15, 5, and 7 times respectively. This level of transaction processing accuracy is highly questionable for excessively recurring transactions. The results are also inconsistent. The other excessive duplication of $994.35 was corrected or voided 78 times giving a correction rate of about 10 percent. Four of the amounts with first-order spikes had very few corrections and one amount with a first-order spike was corrected at a rate of 1 in 10 times.
Another number duplications pattern will become evident when we look at the last-two digits. The low level of corrections and the high level of corrections should be reviewed further in a forensic environment.
Running the Number Duplication Test in Excel
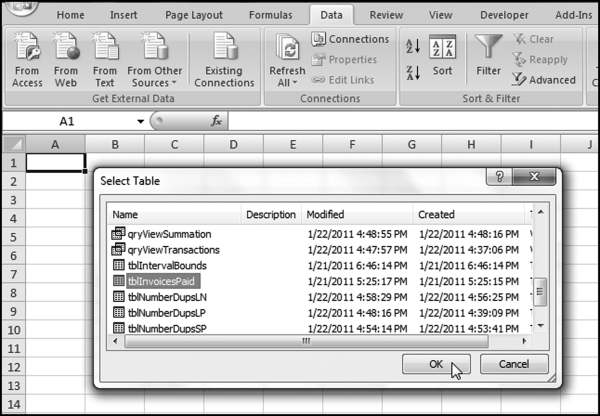
These tests can also be run in Excel. We will not use Excel's pivot table function for now. We will import the data into Excel from Access because the Copy and Paste clipboard cannot hold 189,470 records. The first step is to open an Excel file and to save the workbook as NumberDuplication.xlsx. Import the Access data using Data→Get External Data→Access Data and then selecting the Access file and the table as is shown in Figure 8.14. The Access database InvoicesPaid should be closed while the Excel import procedure is taking place.
Figure 8.14 The Selection Screen for the Data Import
Click OK to select the tblInvoicesPaid data and click OK again to import the data. Excel's default options usually work well. The data is imported into Excel quickly and accurately. Once the data has been imported uncheck the Autofilters using Home→Editing→Sort & Filter and uncheck Filter. Since we are only interested in the dollar amounts we should also delete the fields ID, VendorNum, Date, and InvNum by selecting the fields (columns) and clicking Delete from the right click option. The next step is to sort the Amounts ascending by selecting cell A1 and using Data→Sort & Filter→Sort to sort Amount from Smallest to Largest. Finally, format the Amount field as Currency with two decimal places.
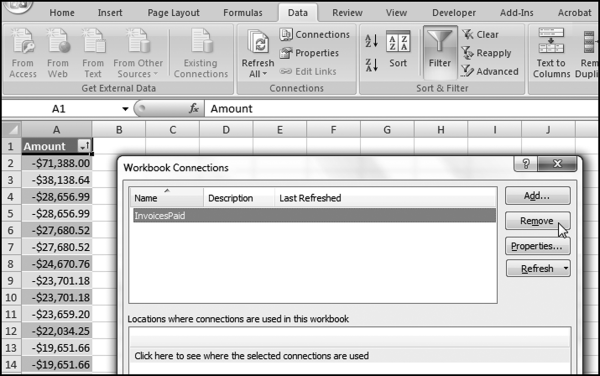
The final step is to sever (break) the connection to the Access database. Select Data→Connections→Connections and then Remove as is shown in Figure 8.15. Click Remove and click OK to note the warning about database updates.
Figure 8.15 The Removal of the Connection with the Access Database
The final formatting step is to remove the table formatting. This is done by placing the cursor in cell A1. Right click on cell A1 and click Table→Convert to Range. Click OK and the data will now be a normal range.
The number duplications can now be calculated using indicator variables. The first indicator variable counts the number of equal amounts. The second indicator variable indicates when the highest count for a particular number has been reached. Both indicator variables use the IF function in Excel. The first “formula” is there just to start the sequence off at 1.
Figure 8.16 The Formulas Used for the Number Duplication Test
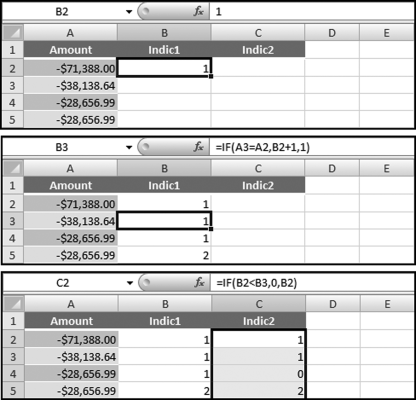
The indicator formulas are shown in Figure 8.16. The formulas for columns B and C are:
B2:1
B3: = IF(A3 = A2,B2+1,1)
C2: = IF(B2<B3,0,B2)
The formulas in B2 and C1 need to be copied down to the last row (in this case row 189471). The formulas then need to be converted to values. Select the cells with the calculations by using F5 (the Go To button) and entering B2:C189471 and clicking OK. Then use the right click sequence of Copy→Paste Special→Values and OK to convert the formulas to values.
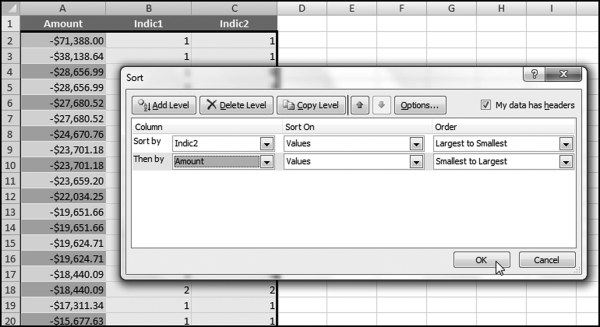
The data now needs to be sorted by Indic2 descending and then by Amount descending as the second sort. The commands are started with Data→Sort followed by the directions in Figure 8.17.
Figure 8.17 The Sort to Create the Number Duplication Table
The final step is to do a little cleaning up. First delete the field Indic1, which is no longer needed. One way to get rid of some rows that we do not need is to scroll down to where Indic2 shows 0s (row 67249). Delete the first zero row and all other subsequent rows by highlighting groups of rows and clicking Delete. The final Excel results are as shown in Figure 8.18.
Figure 8.18 The Results of the Number Duplication Test
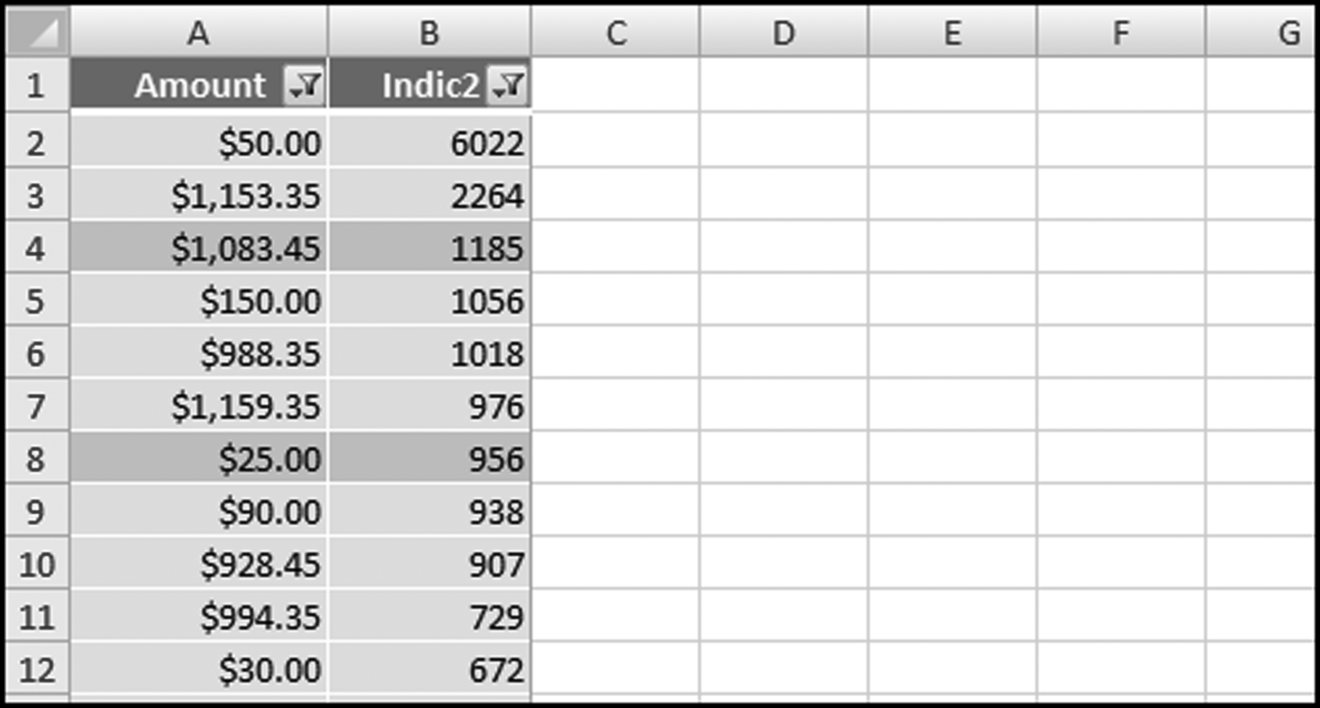
The number duplication results are shown in Figure 8.18. In these results we do not have a Rank column as is seen in Figure 8.5. This is easy to add in Excel. Also, the large positive, small positive, zeroes, small negative, and large negative are all intermingled. Filters can be added to the results. This is done using Home→Editing→Sort&Filter→Filter. Excel's powerful filtering capabilities can be used to show only selected results in either or both of the Amount and Indic2 fields. The results can be filtered to show only the large positive numbers or the large negative numbers or any other number range. The final step could be to rename the Indic2 field to Count.
The last-two digits test completes the Nigrini Cycle. This test is a powerful test for number invention. The test is most appropriate when we do not want number invention or number creativity.
The number invention tests (which include a test for round numbers) are usually not all that valuable for accounts payable data. This is because any odd last-two digits results will be noticeable from the number duplication test. Also, for invoices amounts (in the U.S. in U.S. dollars) this test will usually simply show that many numbers end with “00.” This fact should also be evident from the number duplication test.
The test is a little bit challenging in both Access and Excel because mathematically speaking there is no such thing as the last-two digits of a number. Irrational (which does not mean illogical in this case) numbers such as π, e, √2, and 1/7 do not have a set of last-two digits. Furthermore, a number such as 1,103 could have 03 or 00 (as in 1103.00) as the last-two digits. The question in forensic analytics would be to ask what we are trying to find, and based on this, to determine what last-two digits (if any) are appropriate for the analysis. Experience has shown that for dollars and cents (i.e., currency) the cents (the two digits to the right of the decimal point) are appropriate, and for data consisting of integers (population numbers and election results), the 10s and units digits are appropriate. So for $1,103.00 we would use 00 as the last-two digits, and for a population number or election result count of 1,103 we would use 03 as the last-two digits.
The suggested data-cleansing step is to follow the logic in the first-order test and to delete numbers less than 10 to avoid having small numbers influence the results. We also want to avoid the situation where we try to get the last-two digits of 7 or 0.02 and end up with incorrect results because of errors in the programming logic.
For the last-two digits test it is important that the data be formatted as Currency or Integer in Access to be sure that we are really getting the last-two digits. It is a good idea to randomly check some calculations to see that the query is correctly identifying the last-two digits.
The last-two digit test is generally run on data tables where we are looking for signs of number invention in data tables where we do not really want number invention. Examples of such applications might include:
- Census population numbers (quite relevant in 2010).
- Election results.
- Inventory counts.
- Odometer readings at the time of warranty claims.
- Weights of fish catches by trawlers (an early Benford's Law project).
- Temperature readings at automated weather stations (another project from the early days of digital analysis).
- Deduction numbers on individual tax returns (an application from my dissertation).
- Website hit statistics or banner ad clicks.
- Coupon redemption counts (a recent application).
The last-two digits and round numbers tests could also be useful in royalty situations where licensees have to report production numbers, sales numbers, or usage numbers to the licensor. An analysis of the number patterns might signal number invention.
The challenge from a programming perspective is to correctly identify the last-two digits. The logic includes being creative with multiplication (usually by 100) so that the last-two digits are those to the left of the decimal point. The procedures generally follow the same logic as is used in the first-order test. There are 100 possible last-two digits (00, 01, . . ., 99) and the expected proportions are equal at 0.01 for each possible last-two digit combination. Table 5.1 shows that as we move the right in a number, that the digits are expected to be uniformly (evenly) distributed. Since there are 100 possible last-two digits, our expected proportion is uniform at 1/100 (0.01) each. The graph will look a bit like the graph of the summation test.
Running the Last-Two Digits Test in Access
The last-two digits test will be run on the Amount field of the tblInvoicesPaid table. The demonstration will also show how to calculate the last-two digits for data made up of integers (whole numbers such as 10, 11, 12, . . .). Figure 8.19 shows the query used to calculate the last-two digits.
Figure 8.19 The Query Used to Calculate the Last-Two Digits
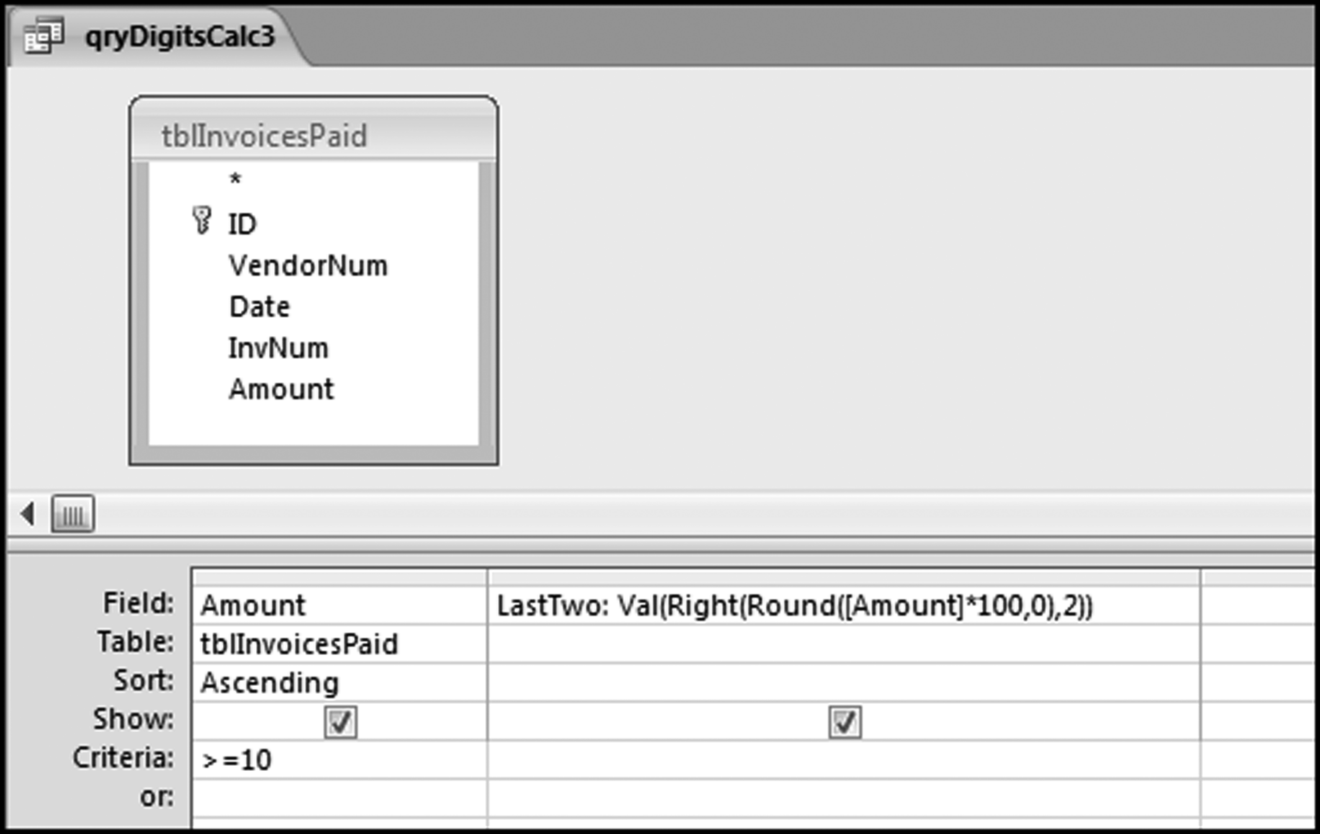
The formula for the digits is more complex than usual and is shown below:
LastTwo: Val(Right(Round([Amount]*100,0),2))
In the formula the Val function changes the result to a numeric value, the Right function takes the rightmost two characters, and the Round function rounds the number to an integer value before any calculations are done. The comma 2 means that we want the rightmost two characters. The result shows 177,763 Amounts that are greater than or equal to 10 together with the last-two digits for each of the numeric values. The next step is to count how many of each possible last-two digit combinations (00, 01, 02, . . ., 99) we have using the query shown in Figure 8.20.
Figure 8.20 The Query Used to Calculate the Counts
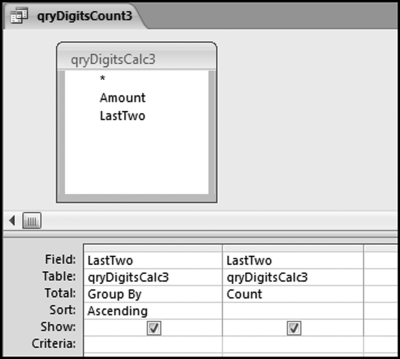
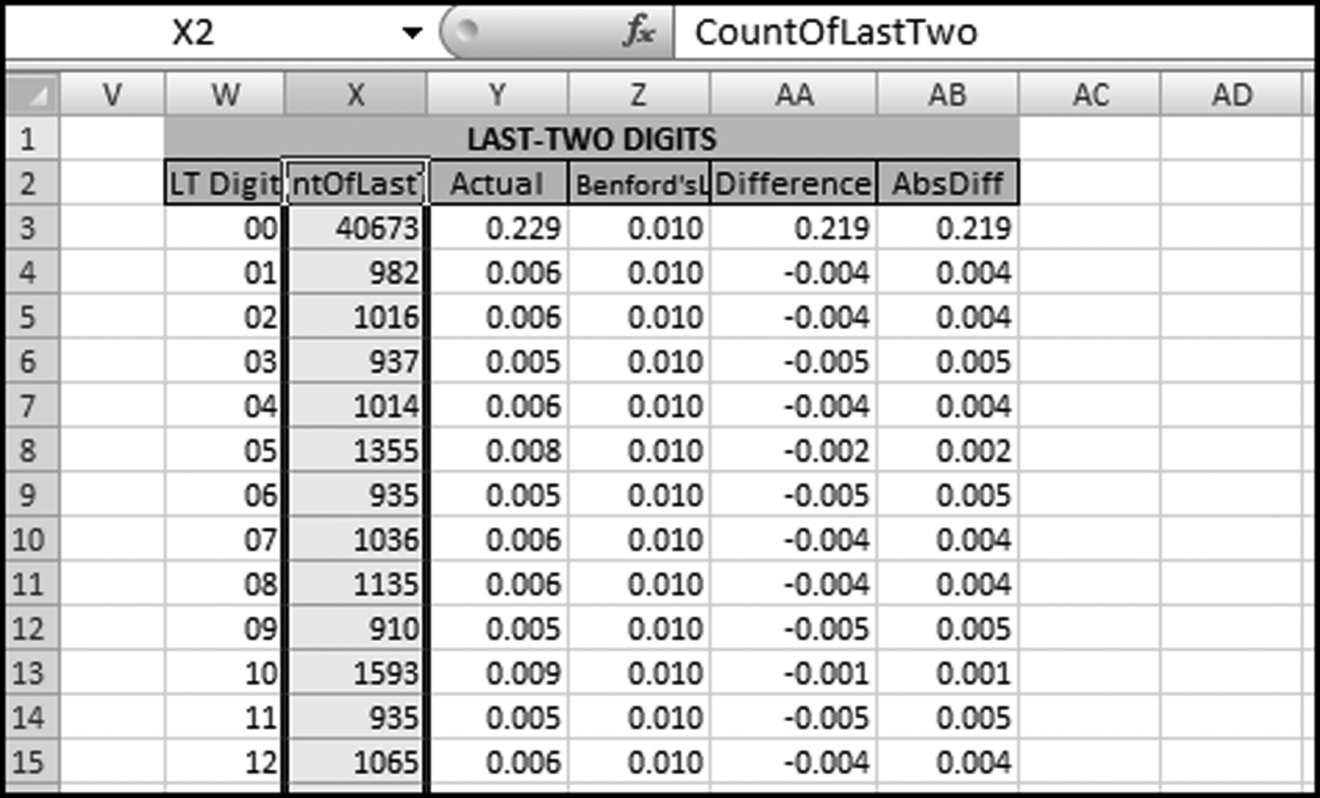
It is a good idea to check that there are 100 records in the output (from 00 to 99 equals 100 records). We want to have a count for each possible digit combination, which might not be the case for small data sets. A data set of 500 records could easily not have a number ending with (say) 64. The last-two digits are graphed in the same way as with the other digit tests in the Nigrini Cycle. Copy the CountOfLastTwo field from Access and paste the result in column X in the NigriniCycle.xlsx template. The result is shown in Figure 8.21.
Figure 8.21 The Last-Two Digit Results in Excel Worksheet
The last-two digits graph is automatically prepared in the Excel template and can be accessed by clicking on the LastTwoDigits chart sheet.
Figure 8.22 The Last-Two Digits Graph
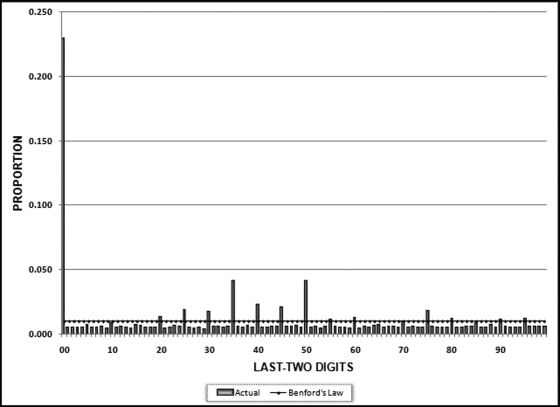
The last-two digits results are shown graphically in Figure 8.22. The graph shows that about 23 percent of the amounts ended with 00. These numbers were whole dollars with no cents. This is common for corporate accounts payable data. The most interesting result is the spiking at multiples of 5 with large spikes at 35, 40, 45, and 50. This is an unusual result and we can also see this pattern from the numbers in the number duplication table in Figure 8.13. Another interesting result is that the last-two digits for the negative numbers also show a clustering at multiples of 5, but at higher numbers in the neighborhood of 80. The clustering around multiples of 5 is an anomaly as is the clustering around 40 for the positive numbers and 80 for the negative numbers.
If our data was made up of integers (e.g., population counts or election results) we would have numbers such as 1,103. In this case we would want to have the 03 as our last-two digits. The formula that would calculate this is
LastTwo: Val(Right(Int(Round([Amount],0)),2))
The formula assumes that Amount is the field being analyzed. If not, then Amount should be changed to People or Miles or whatever the case may be.
For integer (whole numbers) data the last-two digits test can point to excessive rounding. An excess of numbers with 00 as the last-two digits (in a number such as 6,400) could signal excessive rounding. We would expect 0.01 of all numbers (election results or odometer readings) to have last-two digits of 00. If our actual proportion exceeds 0.01 it could indicate that we are looking at numbers that include estimates of some sort.
Running the Last-Two Digits Test in Excel
These tests are reasonably straightforward to run in Excel assuming that you have run the usual first-order test in Excel too. Figure 7.5 shows how to do the first-two digits calculation in Excel. The formula for the last-two digits would be
H2: = VALUE(RIGHT(ROUND(D2*100,2),2))
If we were dealing with integers we would simply adapt the formula. After calculating the last-two digits for each amount we would use the COUNTIF formula shown in Chapter 7 in the last-two digits of the NigriniCycle.xlsx template. With some practice it will probably take just a few minutes to run the test in either Access or Excel.
The number duplication and the last-two digits test complete the Nigrini Cycle. These tests should be the starting blocks for any forensic analytics project. The starting tests were the data profile, periodic graph, histogram, first-order test, second-order test, and the summation test. These tests gave valuable insights into the internal diagnostics of our data. The data profile and the histograms gave us insights into the distribution of the numbers. The periodic graph gave us an insight into the distribution of the amounts across time. The number duplication test drills down to find the source of the spikes on the first-order and summation graphs. The last-two digits test looks for signs of number invention and rounding.
The number duplication test is essentially a numbers hit parade. The report shows us which numbers occurred most often and how often they occurred. The test gives us insights into the spikes on the first-order and the summation graphs. This test can also detect possible processing inefficiencies. These would occur when a small transaction was processed over and over again. The last part of the numbers duplication test is to see if we have a match between the patterns of our credit memos (corrections and voids) and our positive numbers. We would expect a close association between the positive numbers (sales numbers) and voided, corrected, or refunded amounts.
The goal of the last-two digits test is to detect number invention in data sets where we do not really want to see signs of people inventing numbers. Because we are looking at the right-hand side of the numbers we expect the digits (00, 01, 02, . . ., 99) to be evenly distributed. With 100 possible last-two digit combinations we expect each combination to occur about 1 percent of the time. We use this test to look for rounding or number invention in forensic situations such as election results, coupon or rebate check counts, odometer readings, or website statistics. The invoices data had an abnormal duplication of amounts ending in 35, 40, 45, and 50. This test has given many interesting findings and it can be easily run in either Access or Excel.